Kazuo Misue
Department of Computer Science, University of Tsukuba, 1-1-1 Tennoudai, Tsukuba, 305-8573 Japan
Abstract. To find hidden features of co-authoring relationships, we fo-cused on drawing techniques for bipartite graphs. We previously devel-oped a drawing method called “anchored maps”, which is used to depict bipartite graphs visually. In anchored maps, some nodes are restricted to certain positions, but others are left to be arranged freely. In this study, we used our method to depict co-authoring relationships as anchored maps. The maps revealed certain co-authoring relationships. Anchored maps can help us discover important features that we cannot find when using only bipartite graphs that have a free layout.
Keywords: information visualization, graph drawing, bipartite graph, anchored map, co-authorship network.
1
Introduction
Co-authoring relationships are represented as an undirected graph, but its struc-ture is based on a bipartite graph that consists of academic papers and their au-thors. There are some research results related to drawing techniques of bipartite graphs[4,13,12,2]. However, most of them put their focus on theoretical aspects, such as planar layout and edge-crossing minimization. Drawing techniques for bipartite graphs focus on applications have not been studied very much. To find hidden features of co-authoring relationships visually, drawing techniques that are more application oriented are desired.
We developed a method of drawing bipartite graphs called “anchored map[8,9].” An anchored map restricts some nodes to certain positions but leaves other nodes so they can be arranged freely. Some examples of anchored maps can be found in published works[10]. Such examples illustrate what kind of knowledge users can find from anchored maps.
This paper describes a visual analysis tool that has two main functions: con-structing bipartite networks that represent relationships between academic pa-pers and their authors, and drawing bipartite networks as anchored maps. We took relationships between academic papers and their authors as examples and investigated the insight given into the relationships by anchored maps.
2
Academic Papers/Authors Networks
We focused on networks that can be formalized as bipartite graphs. A bipar-tite graph is produced by representing papers and authors by nodes, and then
I. Lovrek, R.J. Howlett, and L.C. Jain (Eds.): KES 2008, Part II, LNAI 5178, pp. 871–878, 2008. c
connecting by edges every node representing a paper to the corresponding nodes representing the paper’s author(s).
2.1 Formal Description of Bipartite Networks
The node set of a bipartite graph is divided into two exclusive sets. A bipartite graph is represented asG= (A∪B, E). Here,A andB are finite sets of nodes, andAandBare disjoint.E is a finite set of edges, andE is a subset ofA×B. 2.2 Network Source
We used DBLP1 to get real data. The DBLP, which is maintained by Michael Ley, is a database server providing bibliographic information on major computer science journals and proceedings. The server indexed about 950,000 articles on October 29, 2007. Each record at DBLP corresponds to a paper and contains its title, author names, conference name, journal name, page numbers, published year, etc. We extracted title, author names and published year of every paper and then stored them in an RDB for ease of construction of local structures. 2.3 How to Extract Local Structures
Visualization of the whole of the DBLP is a challenging task, but we focused on the more detailed structures of the DBLP. We decided to perform a breadth-first search beginning with an author (or a paper) in order to extract a local structure of the database.
The notations used in our searches are as follows. A set of all the papers written by authorais denoted by P(a). A set of all the co-authors who wrote paper p is denoted by A(p). Furthermore, a set of all the papers written by authors in a setA is expressed withP(A), that is P(A) = {p∈ P(a)|a∈ A}. A set of all the co-authors who wrote papers in a setP is expressed withA(P), that isA(P) ={a∈A(p)|p∈P}.
A search that begins with authora0is performed as follows. All papers written
by authora0are searched for initially. We assumed that the set of all the papers
written by author a0 is P0, that is P0 = P(a0). Then, we search for all the
co-authors of all the papers in the setP0. LetA1 denote the set of all the found
co-authors, that isA1 =A(P0). Next, we search for all the papers written by
all the co-authors inA1 . LetP1 denote the set of all the found papers, that is
P1=P(A1). We obtain a bipartite graph described as follows.
G1= (A1∪P1, E1) (1)
E1={(a, p)∈A1×P1|a∈A(p)} (2)
It seems that to getP0 andA1 as a search depth of 1 is adequate. However,
we perform the search until P1 because we want to find joint publications by
some of the co-authors inA1\ {a0}.
1
We obtain the following bipartite graphGk by repeating the searchk (k =
1,2, . . .) times (called “search ofkin depth”):
Gk= (Ak∪Pk, Ek) (3)
Ek={(a, p)∈Ak×Pk|a∈A(p)} (4)
WhereA0={a0},Pi=P(Ai),Ai+1=A(Pi) (i= 0, . . . , k).
3
Visualization of Bipartite Networks
3.1 Free Layout by Spring Embedder ModelEades’ spring embedder model[3] is a well-known method for drawing undirected graphs. We can draw bipartite graphs by using a spring embedder model if we ignore any distinctions between the two sets of nodes. One easy way is to assign different colors and/or shapes to the two sets of nodes. The problem is this produces bipartite graphs that do not have good readability.
3.2 Anchored Map
We developed a method of drawing bipartite graphs called “anchored map[8].” The node set of a bipartite graph is divided into two exclusive sets. Here, the nodes in one set are called “anchors,” and the nodes in the other set are called “free nodes.” Anchors are arranged on the circumference and free nodes are arranged at suitable positions in relation to the adjacent anchors. The anchors are fixed on the circumference as their name suggests and have an effect similar to a coordinate system in that they increase the readability of the network diagrams.
On anchored maps, the order of anchors has a significant effect on the read-ability of the graph structures. We examined some methods in order to decide the order of anchors[9].
4
Implementation of Tool
4.1 Service of Papers/Authors Graph
We developed a program to perform the search described in Section 2. The program accepts not only search depth but also a minimum degree of author nodes and a minimum degree of paper nodes. The number of the nodes often increases exponentially when we perform a deep search2. There are a lot of
authors who wrote only one or two papers with their supervisor when they were college students. Depending on the purpose, we can ignore such authors with a small of number of published papers. Our tool can specify the smallest
2
It does not always increase. When joint works are performed in a closed community, the author nodes do not increase even if the search is deepened.
degree of the author nodes, and remove the author nodes with a smaller degree than the specified degree. The smallest degree of the paper nodes can also be specified. For example, papers written by only one author do not affect the social network consisting of authoring relationships. When we are interested in a co-authorship network, we can remove such papers by setting the smallest degree of paper nodes to be 2.
The program has been developed as a web service and it can be accessed by the public. The service returns bipartite graphs in the graphML format[1]. 4.2 Visualization Tool Service
We also developed a Java applet that provides facilities for drawing anchored maps. The applet also provides facilities for deciding anchor order according to several criteria. Furthermore, we provide a web page3 with some forms for
specifying parameters in order to invoke the Java applet. On the web page, enter the name of an author, search depth, minimum degree of author nodes, and minimum degree of paper nodes. Clicking a button invokes the Java applet. Furthermore, we can obtain anchored maps by selecting the function from a menu.
5
Examples and Discussion
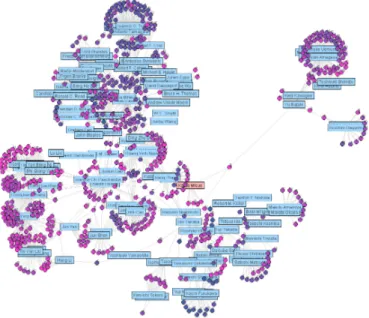
When we designated an author name “Kazuo Misue” (the author of this paper) as the starting point and 2 as the depth of search on the web page and then clicked “Draw Network” button, a bipartite graph was provided. The graph had 117 author nodes, 627 paper nodes, and 1,500 edges.
5.1 View as a Free Layout
Figure 1 shows the network drawn using the spring embedder model. A rectangle represents an author node and a bullet point represents a paper node. The colors of the paper nodes represent the publishing year of the paper (but it might be difficult to distinguish the colors in the Proceedings). Blue means old and red means new. Author nodes that have a lot of red nodes represent currently active communities. For example, the authors in the vicinity of the central right side of the figure are more active than the authors in the lower left of the figure. 5.2 Authors Are Fixed as Anchors
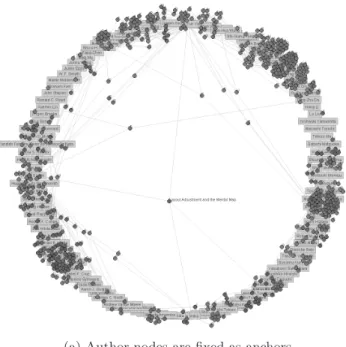
Figure 2(a) shows the network drawn as an anchored map. Here, the author nodes are fixed as anchors. The order of author nodes (anchors) has been decided so as to make author nodes that are adjacent to common paper nodes (free nodes) close to each other. If every paper is written by authors in a local community, co-authors of a paper are placed close to each other and the paper comes close
3
Fig. 1.Examples of a papers/authors network drawn using spring embedder model. Network consists of 117 author nodes (rectangles), 627 paper nodes (small circles), and 1500 edges.
to the co-authors, that is, the circumference. However, some paper nodes are placed far from the circumference. This means that such papers may have been written by authors from different communities.
For instance, the paper4placed near the center of Figure 2(a) was written by
four co-authors. When they wrote the paper, two of them worked at a private company and other two were at a university. They moved to different universities and continued research activities afterwards. From the viewpoint of their current positions, this paper is crossing communities. Anchored map helps us discover such papers.
5.3 Papers Are Fixed as Anchors
Figure 2(b) is the same network as Figure 2(a). Here, paper nodes are fixed as anchors; in other words in Figure 2(b) anchors and free nodes are exchanged with those in Figure 2(a). The order of paper nodes (anchors) has been decided in order to make paper nodes that are adjacent to common author nodes (free nodes) close to each other. Nodes of authors who wrote a lot of papers with various co-authors are toward the center of the circle. For example, we see such a node in the central right side5of the figure and in the lower left6of the figure.
4 K. Misue, P. Eades, W. Lai and K. Sugiyama: Layout Adjustment and the Mental
Map, Journal of Visual Languages and Computing, Vol. 6, No. 2, pp. 183–210, 1995.
5
Peter Eades, the author of [3].
6
(a) Author nodes are fixed as anchors.
(b) Paper nodes are fixed as anchors.
Fig. 2.Examples of a papers/authors network drawn as anchored maps. Network is same as in Figure 1.
Furthermore, we can assume that the two authors do not have many joint papers because the two nodes are placed apart from each other.
5.4 Discussion
The anchored maps are an effective tool for finding distinctive nodes. They can help us discover important features that we cannot find with feature quanti-ties such as the degree of nodes. It is possible to obtain an overview of graph structures with free layout by the spring embedder model, but it is difficult to find distinctive structures. Actually, it is difficult to find the characteristic paper nodes and author nodes mentioned above only from Figure 1.
Various studies have been conducted in order to analyze co-authorship net-works (e.g., [11,7]). Some researchers have drawn co-authorship netnet-works as di-agrams, as explained in Section3.1[6,7]. In the didi-agrams, attributes such as the number of papers, number of citations, and number of times co-authored, are represented by giving visual attributes (e.g., color, size and width) to the nodes and edges. The local characteristics of the networks are expressed visually. How-ever, the structural characteristics are not always expressed very well.
Huang et al. developed InterRing, which visualizes co-authorship without net-work diagrams[5]. In InterRing, change of co-authors’ contributions are repre-sented in a pie-chart style. It helps us see a researcher’s collaboration history in a given period; however, it cannot help us discover some of the structural characteristics.
6
Concluding Remarks
We developed a tool to visualize papers/authors networks as anchored maps. From observing drawing examples, it can be seen that anchored maps are an effective way of finding characteristic components in networks. More work is needed to bring out advantages of anchored map; We will apply anchored maps to other kind of networks, and will extend the style of anchored maps.
References
1. Brandes, U., Marshall, M.S., North, S.C.: Graph data format workshop report. In: Marks, J. (ed.) GD 2000. LNCS, vol. 1984, pp. 407–409. Springer, Heidelberg (2001)
2. Di Giacomo, E., Grilli, L., Liotta, G.: Drawing Bipartite Graphs on Two Curves. In: Kaufmann, M., Wagner, D. (eds.) GD 2006. LNCS, vol. 4372, pp. 380–385. Springer, Heidelberg (2007)
3. Eades, P.: A Heuristic for Graph Drawing. Congressus Numerantium 42, 149–160 (1984)
4. Fosmeier, U., Kaufmann, M.: Nice Drawings for Planar Bipartite Graphs. In: Pro-ceedings of the 3rd Italian Conference on Algorithms and Complexity, pp. 122–134 (1997)
5. Huang, T.-H., Huang, M.L.: Analysis and Visualization of Co-authorship Networks for Understanding Academic Collaboration and Knowledge Domain of Individual Researchers. In: Proc of IEEE Computer Graphics, Imaging and Visualisation 2006 (CGIV 2006), pp. 18–23 (2006)
6. Ke, W., B¨orner, K., Viswanath, L.: Major Information Visualization Authors, Pa-pers and Topics in the ACM Library. In: IEEE Symposium on Information Visu-alization (InfoVis 2004) (2004)
7. LaRowe, G., Ichise, R., B¨orner, K.: Analysis of Japanese Information Systems Co-authorship Data. In: Proceedings of 11th International Conference Information Visualization (IV 2007), pp. 459–464 (2007)
8. Misue, K.: Drawing Bipartite Graphs as Anchored Maps. In: Proceedings of Asia-Pacific Symposium on Information Visualization (APVIS 2006). CRIPT, vol. 60, pp. 169–177 (2006)
9. Misue, K.: Anchored Maps: Visualization Techniques for Drawing Bipartite Graphs. In: Jacko, J.A. (ed.) HCI 2007. LNCS, vol. 4551, pp. 106–114. Springer, Heidelberg (2007)
10. Misue, K.: Overview of Network Intormation by Using Anchored Maps. In: Apol-loni, B., Howlett, R.J., Jain, L. (eds.) KES 2007, Part II. LNCS (LNAI), vol. 4693, pp. 1269–1276. Springer, Heidelberg (2007)
11. Newman, M.E.J.: Coauthorship Networks and Patterns of Scientific Collaboration. Proceedings of the National Academy of Science 101, 5200–5205 (2004)
12. Newton, M., Sykora, O., Vrto, I.: Two New Heuristics for Two-Sided Bipartite Graph Drawing. In: Goodrich, M.T., Kobourov, S.G. (eds.) GD 2002. LNCS, vol. 2528, pp. 312–319. Springer, Heidelberg (2002)
13. Zheng, L., Song, L., Eades, P.: Crossing Minimisation Problems of Drawing Bi-partite Graphs in Two Clusters. In: Proceedings of Asia-Pacific Symposium on Information Visualization (APVIS 2005). CRIPT, vol. 45, pp. 33–38 (2005)