Wang et al.: Observations of aerosol optical properties at a coastal site in Hong Kong, South China, Atmos. Chem. Phys. Discuss., doi:10.5194/acp-2016-833, 2016
Replies to reviewers' comments
5Overview
The authors thank the reviewers for constructive comments, they helped improving the paper. We have replied to all questions raised by the reviewer. The major changes to the paper are that the we have
- added discussion on the uncertainties of the UFP
- discussion on the uncertainties of the calculation of the absorption coefficients 10
- instead of using the symbol m0.8 we use the symbol PM1 - added discussion on particle density
Below the responses are written in cursive letters and the changes to the manuscript are highlighted by yellow.
Detailed replies to Anonymous Referee #1
15General comments: Field observations of aerosol optical properties in different regions
are needed due to the spatial and temporal variations in aerosol optical properties which are important to assess the aerosol radiative forcing. In this study, a comprehensive research on aerosol optical properties at a coastal station in Hong Kong based on more than two years’ field observation was presented. As similar studies on aerosol optical properties at the same site was conducted a decade ago, this work is necessary and meaningful to reveal the current aerosol optical properties and their 20
variations over the past decade in Hong Kong. Meanwhile, long-term observations of several key aerosol optical properties including AAE, SAE and SSA and studies on the relationships between optical properties and particle size were presented in this study, which were limited in Hong Kong over the past decade. In addition, a range of methods including the ratio of ΔBC/ΔCO and SO2/BC, LPDM and PSC analysis were employed to intercept the temporal variations in aerosol optical properties and their quantitative linkage to multi-scale transport. The important influence of ship emissions on aerosol optical 25
properties at Hok Tsui was presented, especially under the southwesterly winds prevailed condition in summer. Overall, this manuscript is well organized and discuss aerosol optical properties and their variation in detail associated with the source analysis. The subject of this study is within the scope of this journal. Several specific comments are listed below. A minor revision is needed before being accepted.
30
There is a little confusion of the logicality of the sentence ‘Correlation analysis showed that the darkest aerosols were smaller in particle size but showed strong scattering wavelength dependencies. . .’ in Lines 18–19 on Page 1. Small particles should have high scattering Angstrom exponent, i.e., strong scattering wavelength dependencies.
Response: Thanks for the comment. We have corrected this expression in the revised manuscript.
5
‘Correlation analysis confirmed that the darkest aerosols were smaller in particle size and showed strong scattering wavelength dependencies…’
A PM2.5 cutoff was deployed for the measurement of Aethalometer, thus, the absorption coefficients of PM2.5 were measured. However, the scattering coefficients of TSP were measured by Nephelometer. Which size did the derived SSA represent? 10
PM2.5 or TSP?
Response: Thanks for the comment. To answer this question we added the following text to the methodology, in section 2.3:
‘The σsp and σap data were used for calculating single-scattering albedo SSA = σsp/(σsp + σap). The nephelometer took its sample from a Total Suspended Particle inlet (TSP) but the Aethalometer through a PM2.5 inlet so it may seem somewhat 15
uncertain which size range the SSA represents. However, BC is the most important light-absorbing constituent in aerosol particles and it is well known that they are in the submicron size range. In larger particles there might be some light-absorbing dust particles but their contribution at this site can be considered to be negligible. Therefore it is reasonable to claim that the absorption coefficients derived from the aethalometer data represent absorption in the full TSP size range even if there was a PM2.5 inlet for the Aethalometer. And since the scattering coefficients were measured after a 20
TSP inlet it is also reasonable to say that the SSA represents that of TSP.’
As stated in Lines 15–17 on Page 8, the SSA at Hok Tsui was slight lower than that observed at a coastal station in Norway in 25
summer (0.91±0.05). However, the average SSA was 0.93 as presented by the authors in Lines 13, higher than the value of 0.91.
Response: Thanks. This sentence was not organized clearly. The average SSA measured in Hok Tsui was 0.94 in autumn
(higher than 0.83 measured in Xinken during autumn) and 0.90 in summer (slightly lower than 0.91 in Norway in summer). 30
We have revised this sentence in the manuscript.
‘The highest σap and σsp values were observed in winter (10.9 ± 7.1 Mm-1 and 193.5 ± 102 Mm-1, respectively), which were more than twice that of summer. Similar pattern was observed in a previous study in Hong Kong in 1997-1999 (Man and Shih, 2001). Compared with other rural/background sites, the average SSA550nm at Hok Tsui was 0.94 ± 0.03 during
autumn which was higher than that measured at Xinken, PRD, China in the same season (0.83±0.05), while this value was 0.90 ± 0.06 in summer which was slightly lower than that observed at a coastal station in Norway in summer (0.91 ± 0.05, Mogo et al., 2012).’
How the authors concluded that the data clusters with modeled and measured aerosol scattering coefficients fit close to 1:1 is 5
most probably associated with polluted continental air? Have the authors analyzed the retroplume associated with these clusters?
Response: Thanks for the comment. Yes. We selected the data points where the slopes were close to 1:1 and computed the
average retroplume of these data points (shown in the following figure) which helped us to make this conclusion.
‘After computing the averaged retroplume of these clusters, it was found that the former data cluster is mostly associated 10
with polluted continental air and the latter with stronger winds and sea salt particles (figures were not shown).’
Are the absorption and scattering coefficients listed in Table 2 all measured at the same wavelength of 550 nm? Moreover, did the site ‘Cape D’Aguilar’ in Table 2 represent ‘Hok Tsui’ station?
15
Response: Yes. The absorption and scattering coefficients listed in Table 2 were all at the same wavelength of 550 nm.
Absorption coefficients at 550nm were calculated from linear interpolation within 520-590 nm. The site name ‘Cape D’Aguilar’ in Table 2 was the previous name of ‘Hok Tsui’ station and it was used in some earlier papers. We have added notes of the name in Table 2 and Table 3.
The diurnal variations of SSA, AAE and SAE are recommended to be presented. Because these parameters represent the aerosol optical properties better which are independent of the absolute aerosol concentrations.
Response: Thanks. We have added the diurnal variations of SSA, SAE and AAE in Fig. 4 in the manuscript.
5
The definition of selected episodes in Figure 13, i.e., GH, SP, NC, AGC, should be illustrated in detail in the manuscript. In other words, what criterions to identify these episodes?
Response: Thanks. We picked out the most representative episode days for each kind of source types by analyzing retroplume
results and variation trend of aerosol optical properties. We have added illustrations according to the suggestions. 10
The major source regions were Guangdong and Hong Kong (GH), ship emission (SP), North China (NC), and aged continental area (AGC). The selection of the episodes was done by combining the footprints using LPDM and the variation trend of aerosol optical properties and PM2.5.
The measurement of aerosol optical properties was conducted for more than two years. What about their variations in different 15
years during the observation period?
Response: Thanks. We have calculated the yearly averages during data processing but due to the short time period of data,
we cannot make conclusions about inter-annual variations. If we have longer period of data in the future, we will investigate the inter-annual variations of aerosol optical properties.
20
Technical corrections
(1) The full name of ‘LPDM’ and ‘PSC’ in Lines 22 on Page 1 should be introduced as they first appeared.
Response: Thanks. We have corrected it in the revised manuscript.
25
‘Multi-year backward Lagrangian particle dispersion modeling (LPDM) and potential source contribution (PSC) analysis revealed…’
(2) Similar to (1), the full name of the corresponding symbol should be introduced as they first appeared. For instant, the full name of σap should be illustrated as aerosol absorption coefficient before it first appear in Line 15 on Page 7. By contrary, an 30
abbreviation should be used throughout the manuscript once it was defined. For example, an abbreviation of SSA is recommended to be used in Line 31 on Page 3 instead of the full name of single scattering albedo, since this abbreviation has been defined above. The authors was recommended to check through the manuscript to avoid such mistakes.
Response: Thanks. We have corrected them and we have checked the symbol using of other parameters according to the
suggestion in the revised manuscript.
For instance, ‘…, the light absorption coefficients (σap) at all wavelengths were corrected using the method presented by Collaud Coen et al. (2010) where...’
Anonymous Referee #2
The paper presents an interesting study of aerosol optical properties over the coastal site of Hong Kong, using three years of data registered with in-situ near instrumentation operated close to the surface. Both the topic and the dataset analyzed make the study worthy to be published in ACP after some revision from the authors.
5
General comments
Main issues to be solved include the addition of detailed information on quality assurance and associated uncertainties of the different variables analyzed. Furthermore, the authors must carefully revise the number of significant figures used in Tables 1, 2, 3 and 4 and along the text. Table 4 must include more statics information then the simple average, just for giving an idea of the spreading of the data around the mean.
10
Response: Thanks for the valuable comments. We have added more illustrations on quality assurance and revised the number
of significant figures in Table 1, 2, 3, and 4 and in the text according to the suggestions in the revised manuscript. We have also revised the Table 4 containing the AVG ± STD and median value of each parameter.
‘In this work, without specific notes BC concentrations refer to the aethalometer data measured at = 880 nm. Sample 15
flow on the Aethalometer display was checked once a week to ensure the flow was within 0.2 LPM of previous week and flow calibration was conducted once a month using an independent flowmeter. The inlet cyclone was cleaned every month.’ * Revision of Table 4 please refer to the manuscript.
Detailed comments 20
On Page 1 line 16 the authors write 150.6 Mm-1 for the average light scattering that according to Table 1 presents a STD of 99.4 Mm-1. This must be change both in the text and in the table by 150+-100 Mm-1. This procedure must be applied to variables that also present an excessive of significant figures, like absorption coefficient, SAE, Ntotal, GMD and m0.8. This suggestion is based on the fact that using an excessive number of significant figures for the STD is not appropriate. Furthermore, the experimental errors and their propagation are also against the excessive number of significant figures both for the STD and 25
Averages, that must be expressed with coherent significant figures.
Response: Thanks. We have changed the number of significant figures of variables according to the suggestion in the Tables
and in the text.
For instance: ‘At 550 nm, the average light scattering (151 ± 100 Mm-1) and absorption coefficient (8.3 ± 6.1 Mm-1) were 30
lower than most of other rural sites in eastern China’
In the abstract, line 21 the authors use deltaBC/delta CO for the ratio BC concentration over CO concentration, but in the text they change the notation in some cases, this must be carefully revised and corrected.
Response: Thanks. ΔBC/ΔCO at Hok Tsui station were calculated as total concentration minus regional baseline (mentioned
on Page 11). But for Fig. 7 we used BC/CO because this ratio was calculated from the emission inventory, which means it only represents the emission intensity (no region baseline) for each grid cell. In other word we can also call it ΔBC/ΔCO only if the regional background was zero.
5
On Page 2, line 22 the authors use for the first time in the paper the acronyms LPDM and PSC, so they must include their respective meanings.
Response: Thanks. We have corrected it in the revised manuscript.
10
‘Multi-year backward Lagrangian particle dispersion modeling (LPDM) and potential source contribution (PSC) analysis revealed that these particles were mainly from the air masses moved southward over Shenzhen and urban Hong Kong and the…’
The reference Cazorla et al., 2013 is missing in the reference list. 15
Response: Thanks. We have added it in the reference list.
Cazorla, A., Bahadur, R., Suski, K., Cahill, J., Chand, D., Schmid, B., Ramanathan, V., and Prather, K.: Relating aerosol absorption due to soot, organic carbon, and dust to emission sources determined from in-situ chemical measurements, Atmospheric Chemistry and Physics, 13, 9337-9350, 2013.
20
On page 2 line 23, the comment should be enriched using the reference: “Valenzuela, A., Olmo, F.J., Lyamani, H., Antón, M., Titos, G., Cazorla, A., Alados-Arboledas, L., Aerosol scattering and absorption Angström exponents as indicators of dust and dust-free days over Granada (Spain). Atmospheric Research, 154, pp. 1-13. 2015”.
25
Response: Thanks. This paper surely contains useful information and we have added this reference according to the suggestion.
‘The AAE in externally mixed BC-dominated regions have been reported to be around 1 (Anderson et al., 2007; Hegg et al., 2002; Bond and Bergstrom, 2006; Bond et al., 2013), while it is greater than 1 for some organic aerosol from biomass smoke and mineral dust due to their diverse light absorbing abilities at different wavelength ranges (Kirchstetter et al., 30
2004;Russell et al., 2010; Valenzuela et al., 2015; Devi et al, 2016).’
On page 4 line 26 the meaning of the acronym CAB must be detailed. As explained in the general comments, it is necessary including information on the uncertainties for the different experimental and derived variables analyzed in this study. 35
Response: Thanks. We have added the name of this station it in the revised manuscript.
‘…In order to correct the systematic errors of filter-based absorption technique, the light absorption coefficients (σap) at all wavelengths were calculated by using the method presented by Collaud Coen et al. (2010) where the Cref factor was set to be 4.26 according to the value from Cabauw (CAB) station reported in the same paper. CAB station is located near populated and industrialized areas which was to some extent similar to Hok Tsui station (near most of cities in the Pearl 5
River Delta region). The reported average Cref value at CAB was 4.26 ± 0.11 and it varies from 2.60 to 4.75 (Collaud Coen et al., 2010). There was no MAAP or any other reference absorption instrument available so determining Cref at Hok Tsui was not possible and the published mean Cref at CAB station was used. However, to present an upper estimate for σap, the Cref = 3.51 calculated for the clean marine site of Mace Head (MHD) (Collaud Coen et al., 2010) was also used and the respective average σap and SSA are presented in the discussions. Since the Cref is responsible for the largest 10
uncertainty in the calculation of σap (Collaud Coen et al., 2010) we did not make further uncertainty analyses by using the uncertainties related to the other factors within the algorithm.’
The UFP monitor presents some limitations that have been described in the literature, see for example: Hillemann, L., Zschoppe, A., Caldow, R., Sem, G. J., and Wieden- sohler, A. (2014). An Ultrafine Particle Monitor for Size-resolved Number 15
Concentration Measurements in Atmospheric Aerosols. J. Aerosol Sci., 68:14–24. Gómez-Moreno, C2F.J., Alonso, E., Artíñano, B., Juncal-Bello, V., Iglesias-Samitier, S., Piñeiro Iglesias, M., Lopez Mahía, P., Perez, N., Pey, J., Ripoll, A., Alastuey, A., De la Morena, B.A., García, M.I., Rodríguez, S., Sorribas, M., Titos, G., Lyamani, H., Alados-Arboledas, L., Latorre, E., Tritscher, T., Bischof, O., 2015. Intercomparisons of mobility size spectrometers and condensation particle counters in the frame of the Spanish atmospheric observational aerosol network. Aerosol Sci. Technol. 49 (9), 777e785. 20
http://dx.doi.org/10.1080/02786826.2015.1074656. In this sense, some comments and the appropriate references must be included in the instrument section.
Response: Thanks. The reviewer is right and we have added more illustrations about the limitations of UFP with more
references. 25
Both the PM1 and the σsp calculated from the number size distributions have uncertainties due to the uncertainties of the UFP monitor. The first is the wide range of particle diameters within the size bins and the use of the geometric mean of the bin limits for the whole bin. This yields the highest uncertainty for the bin that measures particles in the size range 200 – 800 nm as can easily be calculated assuming all particles in that size range were 800 nm instead of the geometric mean 400 nm. This calculation is theoretical in the real atmosphere, however and yields unrealistically high uncertainties 30
and will not be analyzed further. Another source of uncertainty is related to the instrument itself. Hillemann et al. (2014) found that the number concentrations measured by UFPM are typically within a range of ± 20 % from the reference values measured with an SMPS. Also Gómez-Moreno et al. (2015) compared the UFP with an SMPS and found that the size distributions measured by UFPM and SMPS were similar in the sense that the peak concentrations were observed at
the same size. In the same study it was also observed that in the size channels corresponding to particle diameters < 100 nm the UFP overestimated the number concentrations and in the two largest channels it underestimated the number concentrations. These are the channels that measure the particles that have the highest mass and that scatter light most efficiently. It may therefore be argued that both the PM1 and the modeled σsp are underestimated.
5
In section 2.4 the authors present information on the data processing followed for deriving m0.8 including a value for the particle density that requires justification and a reference.
Response: Thanks. We have add explanations about the reason of using 1.7 g cm-3to calculate m
0.8. Also, we have changed 10
the abbreviation m0.8 into PM1 and reason was explained in the manuscript.
‘For spherical particles the aerodynamic diameter Da is calculated from the mobility diameter Dm as Da = Dm p 0 where p is the density of the particle and o the density of water. For Dm = 0.8 µm and p = 1.7 g cm-3 this yields Da = 1.0 µm. In the results, therefore, the mass concentration calculated from the number size distributions was denoted as PM1….
15
…It was mentioned above that the PM1 concentrations were calculated by using the density of 1.7 g cm-3 which deserves reasoning. The densities of major inorganic aerosol compounds such as ammonium sulfate and sodium chloride are 1.76 and 2.165 g cm-3 (e.g. Tang, 1996). Zhang et al. (2008) estimated that the density of sulfuric acid-coated soot is 1.7 g cm -3. Ambient aerosols contain also many unknown compounds such as organics and also some water even after drying to 20
RH < 50 %. Densities of real atmospheric aerosols have been measured in several campaigns. Quinn et al. (2001) determined aerosol densities on a cruise across the Atlantic Ocean. The density of submicron aerosols, averaged from observations at very different regions was 1.73 ± 0.24 g cm-3. Pitz et al. (2003) determined the mean apparent particle density of 1.6 ± 0.5 g cm-3 for urban aerosol. Saarikoski et al. (2005) found that at a boreal forest site the average density was 1.66 ± 0.13 g cm-3. Based on these publications it is reasonable to use the density of 1.7 g cm-3 for the estimation of 25
aerosol mass concentration from the number size distributions of particles smaller than 800 nm of mobility diameter. It has to be noted, however that there is uncertanty in it since it was not measured at this site.’
Section 3.1 and Table 2 must include additional studies developed with similar instrumentation in other urban locations affected by mineral dust transport: Lyamani., F. J. Olmo, and L. Alados-Arboledas. Physical and optical properties of aerosols 30
over an urban location in Spain: seasonal and diurnal variability. Atmospheric Chemistry and Physics., 10, 239-254, 2010.
The discussion on page 7 on BC, including the comments on temporal trends, could be enriched considering the next reference: Lyamani, H., F.J. Olmo, I. Foyo, L. Alados- Arboledas. Black carbon aerosols over an urban area in south-eastern Spain: Changes detected after the 2008 economic crisis. Atmospheric Environment, Volume 45, Issue 35, Pages 6423-6432, 2011 5
Response: Thanks. The station in the above-mentioned paper is an urban site located in Graanda, Spain. It is so different a
Observations of aerosol optical properties at a coastal site in Hong
Kong, South China
Jiaping. Wang
1,2,3,4,*, Aki. Virkkula
1,2,3,5,6, Yuan. Gao
4,7, Shuncheng. Lee
4,*, Yicheng. Shen
1,2,3, Xuguang. Chi
1,2,3,
Wei. Nie
1,2,3, Qiang.Liu
1,2,3, Zheng. Xu
1,2,3, Xin. Huang
1,2,3, Tao. Wang
4, Long.Cui
4, Aijun. Ding
1,2,31 Joint International Research Laboratory of Atmospheric and Earth System Sciences, Nanjing, China 5
2 Institute for Climate and Global Change Research & School of Atmospheric Sciences, Nanjing University, Nanjing, 210023, China
3 Collaborative Innovation Center of Climate Change, Jiangsu Province, China
4 Department of Civil and Environmental Engineering, The Hong Kong Polytechnic University, Hung Hom, Kowloon, Hong Kong
10
5 Finnish Meteorological Institute, Helsinki, Finland
6 Department of Physics, University of Helsinki, Helsinki, Finland
7 Department of Civil Engineering, the Chu Hai College of Higher Education, Castle Peak Bay, Hong Kong Correspondence to: J.P. Wang ([email protected]); S.C. Lee ([email protected])
Abstract. Temporal variations of aerosol optical properties were investigated at a coastal station in Hong Kong based on the 15
field observation from February 2012 to February 2015. At 550 nm, the average light scattering (151 ± 100 Mm-1) and absorption coefficient (8.3 ± 6.1 Mm-1) were lower than most of other rural sites in eastern China while the single scattering albedo (SSA=0.93 ± 0.05) was relatively higher compared with other rural sites in the Pearl River Delta (PRD) region. Correlation analysis confirmed that the darkest aerosols were smaller in particle size and showed strong scattering wavelength dependencies, indicating possible sources from fresh emissions close to the measurement site. Particles with Dp of 200-800 20
nm were less in number, yet contributed the most to the light scattering coefficients among submicron particles. In summer, both ΔBC/ΔCO and SO2/BC peaked, indicating the impact of nearby combustion sources on this site. Multi-year backward Lagrangian particle dispersion modeling (LPDM) and potential source contribution (PSC) analysis revealed that these particles were mainly from the air masses moved southward over Shenzhen and urban Hong Kong and the polluted marine air containing ship exhausts. These fresh emission sources led to low SSA during summer. For winter and autumn months, contrarily, 25
ΔBC/ΔCO and SO2/BC were relatively low, showing that the site was more under influence of well-mixed air masses from long-range transport including South China, East China coastal regions, and aged aerosol transported over Pacific Ocean and Taiwan Island, causing stronger abilities of light extinction and larger variability of aerosol optical properties. Our results showed that ship emissions in the vicinity of Hong Kong could have visible impact on the light scattering and absorption abilities as well as SSA at Hok Tsui.
1. Introduction
Atmospheric aerosol strongly affects the earth’s radiative balance by scattering and absorbing incoming solar radiation, which however, is still a large source of uncertainties in global climate forcing assessment (IPCC, 2013). The aerosol optical properties are responsible for the direct aerosol radiative forcing, depending on aerosol chemical composition and microphysical properties. Relative to another major component of radiative forcing, greenhouse gases, the shorter atmospheric 5
lifetime of aerosols leads to more localized effects and regional differences in aerosol optical properties. Due to the spatial and temporal differences of aerosol optical properties caused by the complex distribution of tropospheric aerosols, field monitoring of aerosol optical properties in different regions around the world is critical for exploring the variations of aerosol radiative forcing. Among the major aerosol radiative forcing drivers, mineral dust, sulfate, nitrate and organic carbon generally have negative radiative forcing. Contrarily, absorbing aerosols, like black carbon (BC), can strongly absorb visible light enhancing 10
the warming effect of the atmosphere (Jacobson, 2001; Babu and Moorthy, 2001; Ding et al., 2016).
Light absorption and scattering of different kinds of aerosols have distinct wavelength dependencies that are approximately proportional to -AAE or -SAE, respectively, where is the wavelength and AAE and SAE are the Ångström exponents of absorption and scattering, respectively. Hence, the wavelength dependency of aerosol light scattering and absorption has been 15
recognized as an efficient index to distinguish aerosol types (e.g., Russell et al., 2010; Moosmüller and Chakrabarty, 2011; Devi et al., 2016). For instance, BC can strongly absorb light at all visible wavelengths, while other light absorbing aerosols (some organic aerosol, soil, and dust) absorb more blue light than red light (Moosmüller et al., 2011; Bond et al., 2013; Ding et al., 2016). Therefore, the absorption Ångström exponent (AAE) is often related to the dominant absorbing aerosol type for a mixture of aerosols (Cazorla et al., 2013). The AAE in externally mixed BC-dominated regions have been reported to be 20
around 1 (Anderson et al., 2007; Hegg et al., 2002; Bond and Bergstrom, 2006; Bond et al., 2013), while it is greater than 1 for some organic aerosol from biomass smoke and mineral dust due to their diverse light absorbing abilities at different wavelength ranges (Kirchstetter et al., 2004;Russell et al., 2010; Valenzuela et al., 2015; Devi et al, 2016). Moreover, studies have shown that AAE of BC has a large variability depending on the size of BC cores and coating thickness (e.g., Lack and Cappa, 2010). For non-coated BC with small diameter (e.g. 10 nm), AAE is close to 1, but large BC cores can have AAE<1 25
(e.g., Gyawali et al., 2009; Lack and Cappa, 2010). For coated BC particles, laboratory measurements of Schnaiter et al. (2005) reported that thickly coated BC by α-pinene plus ozone SOA could decrease the AAE to 0.8. Coating of BC by purely scattering material may also result in AAE up to about 1.8 (Gyawali et al., 2009; Lack and Cappa, 2010). The scattering Ångström exponent (SAE) is often regarded as a qualitative indicator of the dominating particle size, that is, large values (SAE > 2) indicate a large contribution of small particles and small values (SAE < 1) a large contribution of large particles. For instance, 30
Delene and Ogren (2002) reported that the influence of large sea-salt particles led to the lower SAE. However, this interpretation is not quite unambiguous, as was shown, e.g. by Schuster et al. (2006) and Virkkula et al. (2011). The SSA is the ratio of scattering to extinction coefficient, i.e., the sum of scattering and absorption coefficients. It equals 1 for purely
scattering aerosol and clearly lower, approximately 0.3 for pure BC particles (e.g., Schnaiter et al., 2003; Mikhailov et al., 2006). SSA varies significantly for smoke of different origin and age and correlates with the presence of BC in the combustion products (e.g., Dubovik et al., 2002).
There are several ways to assess the sources of aerosols, for instance by comparing observed particle concentrations with other 5
tracers. As a by-product of the incomplete oxidation, CO has a long lifetime (about 1-2 months) in the troposphere, which therefore can act as a tracer of anthropogenic emissions (Jennings et al., 1996). A strong positive correlation between BC and CO has been found in previous studies concerning source identifications (Pan et al., 2011; Jennings et al., 1996). The BC/CO ratio is considered as a good indicator to determine BC emission and to recognize source characteristics. Also, the emission ratio of BC and CO varies significantly from different sources, making it an effective index for validating emission inventories 10
(Girach et al., 2014). The SO2/BC ratio can be also used for assessing the sources since both BC and SO2 are emitted in fossil fuel combustion (Bond et al., 2013).
The Pearl River Delta (PRD) region in Southern China has undergone fast industrialization with increasing emissions of particulate and gaseous pollutants (Wang et al., 2003). In particular, the growing crisis of high particulate matter (PM) levels 15
in the Pearl River Delta (PRD) region is of great concern due to its adverse effects on regional and continental atmospheric environment (Wang et al., 2009; Ding et al., 2013; Lam et al., 2005; Liu and Chan, 2002; Verma et al., 2010). Hong Kong is a typical coastal city in the PRD region. Under the influence of the East Asian monsoon, this region is controlled by the southerly winds bringing marine inflow from the South China Sea in summer, while in winter it is downwind from the North and East China Plains and dominated by the continental outflow (Ding et al., 2013; Lam et al., 2001; Zhou et al., 2013). Thus, 20
it is an ideal place for exploring the characteristics of optical properties for continental and marine aerosol.
There have been studies concerning aerosol optical properties and light-absorbing aerosols in the PRD region. Man and Shih (2001) did field observations of light scattering and absorption coefficients from September 1997 to April 1999 in Hong Kong. Cheng et al. (2006a) investigated the seasonal variation patterns of BC concentrations in Hong Kong as well as the potential 25
sources of BC by continuous measurement from June 2004 to May 2005 using model AE-42 Aethalometer (Magee Scientific Inc., Berkeley, Calif.). Cheng et al. (2008) presented the one-month record of aerosol optical measurements with related chemical apportionment at Xinken in PRD region and reported a relatively low SSA at this polluted rural site. Mixing states of light-absorbing aerosols were also investigated using optical closure experiments during campaign (Cheng et al., 2006b; Tan et al., 2016). However, long-term observations of several key aerosol optical properties including wavelength 30
dependencies of light scattering and absorption, SSA and studies on the relationships between optical properties and particle size, as well as their quantitative linkage to multi-scale transport are limited in Hong Kong over the past decade.
In this study, we aim at demonstrating the temporal variations of aerosol optical properties at a coastal station in Hong Kong and investigating the relationships between aerosol optical properties and size distributions based on field observations. Source analyses are conducted by comparing observed BC-to-CO ratios as well as the SO2
-t
o-BC ratios. Transport pattern and origins of aerosols were quantitatively studied based on LPDM. Characteristics of local aerosol optical properties dominated by different aerosol source regions were also compared and illustrated.5
2. Methodology
2.1 Sampling site
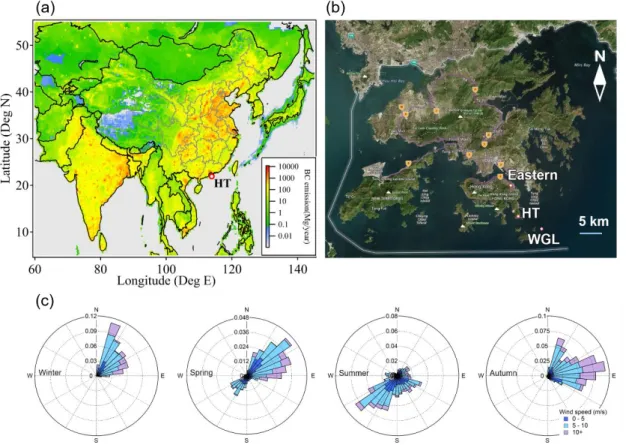
The Hok Tsui (HT) monitoring station is situated on the southeast tip of Hong Kong Island facing the South China Sea (22.22ºN, 114.25ºE, 60 m above the sea level) with an almost vertical drop to the sea. This station has a view of the sea for 10
over 180° from the northeast to southwest and is 20 km away from urban area of Hong Kong on the northwest. Owing to the characteristics of the location mentioned above, it is an ideal background monitoring site for identifying both the long-range transport of polluted continental/marine air mass caused by anthropogenic emissions and relatively clean marine air mass in different seasons. For more details about the HT site, please refer to Wang et al. (2009) and papers cited in.
15
2.2 Light absorption measurement
Light absorption measurement was conducted using a model AE-31 Aethalometer (Magee Scientific Company Berkeley, California, USA) from 1 February 2012 to 30 September 2013 and 1 March 2014 to 28 February 2015. Sample air was obtained through a stainless steel inlet with a PM2.5 cut-off, protected with a rain cap. Prior to entering the instrument, sample air was heated to ensure a moderate relative humidity. The sample inlet was approximately 1.5 m above the roof of the measurement 20
station building, which was about 4 m above the ground. The sample flow provided by the internal pump was set to 4.0 LPM. The AE-31 Aethalometer performs continuous measurements of BC concentrations at seven wavelengths (370 nm, 470 nm, 520 nm, 590 nm, 660 nm, 880 nm and 950 nm) with a time resolution of 5 min. In this work, without specific notes BC concentrations refer to the aethalometer data measured at = 880 nm. Sample flow on the Aethalometer display was checked once a week to ensure the flow was within 0.2 LPM of previous week and flow calibration was conducted once a month using 25
an independent flowmeter. The inlet cyclone was cleaned every month. In order to correct the systematic errors of filter-based absorption technique, the light absorption coefficients (σap) at all wavelengths were calculated by using the method presented by Collaud Coen et al. (2010) where the Cref factor was set to be 4.26 according to the value from Cabauw (CAB) station reported in the same paper. CAB station is located near populated and industrialized areas which was to some extent similar to Hok Tsui station (near most of cities in the Pearl River Delta region). The reported average Cref value at CAB was 4.26 ± 30
0.11 and it varies from 2.60 to 4.75 (Collaud Coen et al., 2010). There was no MAAP or any other reference absorption instrument available so determining Cref at Hok Tsui was not possible and the published mean Cref at CAB station was used.
However, to present an upper estimate for σap, the Cref = 3.51 calculated for the clean marine site of Mace Head (MHD) (Collaud Coen et al., 2010) was also used and the respective average σap and SSA are presented in the discussions. Since the Cref is responsible for the largest uncertainty in the calculation of σap (Collaud Coen et al., 2010) we did not make further uncertainty analyses by using the uncertainties related to the other factors within the algorithm. Absorption coefficients were presented under Standard Temperature and Pressure (STP) (273.15 K, 1013 hPa). Measured BC concentrations were corrected 5
following the algorithm presented by Virkkula et al. (2007).
2.3 Light scattering measurement
Light scattering coefficients (σsp) at wavelength of 450 nm, 550 nm and 700 nm were measured using an integrating nephelometer (Model 3563, TSI Inc, St. Paul, MN, USA). The averaging time was set to 5 min. Calibration was conducted 10
once a month using CO2 and filtered air as described in the user manual. An internal heater was used to maintain a moderate relative humidity during measurement. Raw σsp data were corrected for truncation errors following the method from (Anderson and Ogren, 1998) where the scattering coefficients were determined by calculating the Ångström exponents from uncorrected scattering coefficients and the correction factors with no-cut inlet. Scattering coefficients were then corrected to STP using pressure and temperature readings from the nephelometer.
15
The σsp and σap data were used for calculating SSA = σsp/(σsp + σap). The nephelometer took its sample from a Total Suspended Particle inlet (TSP) but the Aethalometer through a PM2.5 inlet so it may seem somewhat uncertain which size range the SSA represents. However, BC is the most important light-absorbing constituent in aerosol particles and it is well known that they are in the submicron size range. In larger particles there might be some light-absorbing dust particles but their contribution at 20
this site can be considered to be negligible. Therefore it is reasonable to claim that the absorption coefficients derived from the aethalometer data represent absorption in the full TSP size range even if there was a PM2.5 inlet for the Aethalometer. And since the scattering coefficients were measured after a TSP inlet it is also reasonable to say that the SSA represents that of TSP.
2.4 Particle size measurement and the use of the size distributions 25
An Ultrafine Particle Monitor (UFP, Model 3031, TSI Inc.) was used to measure the number size distribution of particles in the size range of 20 to 800 nm with six size bins of mobility diameter: 20~30 nm, 30~50 nm, 50~70 nm, 70~100 nm, 100~200 nm and 200~800 nm. The operating principle of UFP Monitor is based on diffusion charging of particles, followed by size segregation within a Differential Mobility Analyzer (DMA) and detection of the aerosol via a sensitive electrometer. The UFP monitor was equipped with a Model 3031200 environmental sampling system. The sample inlet was placed 2.0 m 30
above the ground. Ambient air was continuously drawn through a size selective PM10 inlet at a standard flow rate of 16.7 L/min. The sample then passed through a PM1 cyclone to remove larger particles. The main sample stream was
subsampled into the UFP at a flow rate of 5 L/min. A Nafion dryer was installed upstream of the UFP to ensure proper conditioning of the aerosol and to minimize effects due to water vapor. The remaining 11.7 L/min of make-up air, drawn
through a vacuum pump and exhausted, was routed through the Nafion dryer as purge air. The averaging time was set to 15 min.
The total mass concentrations of particles with mobility diameter less than 800 nm were calculated using the following equation:
3
1 ,
1
6
n
i i p i i
PM
N
D
, (1) 5where Ni was the number concentration in each size bin, ρi was the density of particles assumed to be 1.7 g cm-3, Dp,i was the geometric mean of the upper and lower limit diameter in each size bin.
For spherical particles the aerodynamic diameter Da is calculated from the mobility diameter Dm as Da = Dm p 0 where p is the density of the particle and o the density of water. For Dm = 0.8 µm and p = 1.7 g cm-3 this yields Da = 1.0 µm. In the 10
results, therefore, the mass concentration calculated from the number size distributions was denoted as PM1.
The size distributions were used for calculating scattering coefficients from: 2
( ) ( , , ) ( )
4
p
sp sp p p p
D
Q D m
n D dD
, (2) where the scattering efficiencies (Qsp) were calculated by using the BHMIE code (Bohren and Huffman, 1983). We assumed 15that the Dp of each particle is equal to the geometric mean of the upper and lower limit diameter in its size bin for modeling, and the aerosol is ammonium sulfate with the refractive index m = mr = 1.52 (Chamaillard et al., 2006). The refractive index used in the modeling could in principle be varied and iterated until the measured and modeled scattering coefficients match as was done, e.g., by Virkkula et al. (2011). However, due to the different size ranges and low number of size bins of the size distributions, this kind of iteration is not reasonable for the data in this work.
20
Both the PM
1and the σ
spcalculated from the number size distributions have uncertainties due to the uncertainties
of the UFP monitor. The first is the wide range of particle diameters within the size bins and the use of the geometric
mean of the bin limits for the whole bin. This yields the highest uncertainty for the bin that measures particles in
the size range 200 – 800 nm as can easily be calculated assuming all particles in that size range were 800 nm instead
25of the geometric mean 400 nm. This calculation is theoretical in the real atmosphere, however and yields
unrealistically high uncertainties and will not be analyzed further. Another source of uncertainty is related to the
instrument itself. Hillemann et al. (2014) found that the number concentrations measured by UFPM are typically
within a range of ± 20 % from the reference values measured with an SMPS. Also Gómez-Moreno et al. (2015)
compared the UFP with an SMPS and found that the size distributions measured by UFPM and SMPS were similar
30in the sense that the peak concentrations were observed at the same size. In the same study it was also observed
that in the size channels corresponding to particle diameters < 100 nm the UFP overestimated the number
concentrations and in the two largest channels it underestimated the number concentrations. These are the channels
that measure the particles that have the highest mass and that scatter light most efficiently. It may therefore be
argued that both the PM
1and the modeled σ
spare underestimated.
5
It was mentioned above that the PM
1concentrations were calculated by using the density of 1.7 g cm
-3which
deserves reasoning. The densities of major inorganic aerosol compounds such as ammonium sulfate and sodium
chloride are 1.76 and 2.165 g cm
-3(e.g. Tang, 1996). Zhang et al. (2008) estimated that the density of sulfuric
acid-coated soot is 1.7 g cm
-3. Ambient aerosols contain also many unknown compounds such as organics and also some
10
water even after drying to RH < 50 %. Densities of real atmospheric aerosols have been measured in several
campaigns. Quinn et al. (2001) determined aerosol densities on a cruise across the Atlantic Ocean. The density of
submicron aerosols, averaged from observations at very different regions was 1.73 ± 0.24 g cm
-3. Pitz et al. (2003)
determined the mean apparent particle density of 1.6 ± 0.5 g cm
-3for urban aerosol. Saarikoski et al. (2005) found
that at a boreal forest site the average density was 1.66 ± 0.13 g cm
-3. Based on these publications it is reasonable
15
to use the density of 1.7 g cm
-3for the estimation of aerosol mass concentration from the number size distributions
of particles smaller than 800 nm of mobility diameter. It has to be noted, however that there is uncertanty in it since
it was not measured at this site.
20
2.5 Supporting measurements
CO data was used to help analyzing aerosol sources since it typically originating from incomplete combustion like BC. Hourly mixing ratios of carbon monoxide was measured with a nondispersive infrared absorption instrument (Teledyne API Model 300) at Hok Tsui station.
25
In addition to the measurements at the HT station, the following supporting data measured at two near-by sites were used in the analyses. SO2 is the precursor of sulphate, the most important light-scattering constituent and it is also one of the major pollutants of ship emission. PM2.5 concentrations can be used for a semi-quantitative quality check of the aerosol mass concentrations calculated from the size distributions. Hourly SO2 and PM2.5 concentrations at Eastern station (about 7 km away from HT station, the location is shown in Fig. 1b) were downloaded from the open-access dataset from the website of Hong 30
The hourly averaged meteorological parameters including air temperature, relative humidity (RH), wind direction, wind speed and precipitation were obtained from dataset in the HKEPD in which meteorological data from the nearest meteorological station (Waglan Island, WGL) was used for analyzing in this paper. The location of WGL station is shown in Fig. 1b.
2.6 Backward Lagrangian particle dispersion modeling (LPDM) 5
Transport and dispersion simulations were conducted using a Lagrangian particle dispersion modeling (LPDM) following the method developed by Ding et al. (2013). LPDM was conducted by using the Hybrid Single-Particle Lagrangian Integrated Trajectory (HYSPLIT) model, developed in the Air Resource Laboratory (ARL) of the USA National Oceanic and Atmospheric Administration (Draxler, 1998; Stein et al., 2015). In each simulation, particles were released at a height of 100 m above the ground level at the site and backward in time for a 7-day period. LPDM calculations were driven with GDAS 10
(Global Data Assimilation System) data (http://ready.arl.noaa.gov/HYSPLIT.php). Particle positions were calculated in each hour and gridded concentrations were in a spatial resolution of 0.01° in latitude by 0.01° in longitude.
Knowing the transport characteristics of air masses, the next step was to explore the source profile of light absorbing particles affecting the regional aerosol optical properties in Hong Kong. Since BC is the most significant light-absorbing constituent of 15
aerosols, the PSC of BC to observed air masses was calculated using MIX Asian emission inventory (Li et al., 2015) together with LPDM results. The MIX emission inventory has a horizontal grid resolution of 0.25°×0.25° in longitude and latitude and it considered the anthropogenic emissions from transportation, residential, industry and power generation in continental area. In each grid cell, emission rate was multiplied with the footprint retroplume and the sum of this potential source contribution of all grid cells can provide the total BC concentration resulting from emissions during a certain period (Ding et al., 2013). 20
The maps of averaged source contribution profile of BC in different seasons were calculated covering 70°-140° in longitude and 0°-50° in latitude. This method to calculate the PSC of target pollutants has been adopted in a previous study by Ding et al. (2013). The major advantage of this method is that it captures the potential contribution of target pollutants to the receptor due to the transport of air mass containing the information of anthropogenic emissions.
25
In this study, the MIX emission inventory provided relatively high spatial resolution of BC emission rates considering its major anthropogenic sources in China and nearby Asian countries. However, marine emission is not included in the MIX database. To investigate the possible influence of marine sources, like ship emissions, on the observed aerosol concentrations at this coastal site, we used the observed aerosol concentrations together with the LPDM footprint. We used the following concentration-weighted equation to calculate the potential source contribution from each grid cell:
30
(i, j) 1
x (i, j)
(i, j) 1
(x
)
n t t t n t tR
A
R
where x is the selected optical property or other parameters, and we chose σap, σsp and PM1 in this study. R represents the retroplume with 3-day backward time. t is the time step and n is the total number of the time steps. The interpretation of Eq.(3) is that it shows the average value of the property x observed at the receiving site when air masses have come from over grid cell i,j. The method is analogous to that presented by Stohl et al. (1996) and the concentration-weighted trajectory (CWT) methods reviewed by Cheng et al. (2015). The major difference is that in the present approach the footprints were used instead 5
of single trajectories for each time step.
3. Results and discussions
3.1 Aerosol optical properties and their relationships with particle size 3.1.1 Overall results of aerosol optical properties and related parameters 10
Table 1 shows a basic statistical summary of all measured parameters. The light absorption coefficients at λ=550 nm were interpolated between the σap at 520 nm and 590 nm. The mean absorption and scattering coefficients at λ=550 nm during the whole measurement period were 8.3 ± 6.1 Mm-1 and 151 ± 100 Mm-1, respectively. As mentioned in the methods, the above-mentioned σap was calculated by using the Cref of CAB. If, instead we use the Cref of MHD, σap = 10.1 ± 6.1, which may be considered as an upper estimate. Table 2 summarizes the light scattering and absorption coefficients and single scattering 15
albedos observed in this study and in selected other studies using comparable instruments (Man and Shih, 2001; Xu et al., 2002; Yan et al., 2008). On average, the σap was lower than that measured at Lin’an regional background station in the rural area of the Yangtze River Delta Region (Xu et al., 2002). Compared to the value measured at same station, σap was lower than that observed in Hok Tsui from November 1997 to February 1999 (Man and Shih, 2001). As the most significant light-absorbing constituent of aerosols, a similar decrease of BC concentration was also found. Table 3 presents the mean BC mass 20
concentrations reported in other comparable studies. The overall average of BC mass concentrations in this study was 1.4 ± 1.1 µg/m3 (Table 1), which was lower than the values observed at same site in 2004-2005 (with a mean of 2.4 µg/m3 using AE-42 Aethalometer) (Cheng et al., 2006). A decreasing trend of BC concentration was found at Panyu station in the PRD region with a decreasing rate of approximately 1 µg/m3 per year from 2004 to 2007 (Wu et al., 2009). Compared to the other rural sites in the South China, BC levels in Hok Tsui station were lower than the concentrations measured at a rural site in the 25
center of PRD region, yet higher than those on Yongxing Island, an oceanic rural site in the middle of the South China Sea (Yu et al., 2013). BC concentrations were also higher than those measured in European coastal stations (Saha and Despiau, 2009; Andriejauskienė, 2008). The σsp was comparable to that obtained at Shangdianzi station in the suburb of Beijing, but much higher than the value at Hok Tsui station measured a decade ago (Yan et al., 2008; Man and Shih, 2001). The overall average SSA550nm was 0.93 ± 0.05, which was comparable to that in a rural station, Lin’an, China (Xu et al., 2002) but higher 30
than those measured in a suburban station in Northern China (Mean SSA525nm = 0.88) (Yan et al., 2008). And as done above for σap, a lower estimate for SSA = 0.92 ± 0.05 can be obtained by using the Cref of MHD in the calculations. This shows that
even by changing the Cref by ~20% the SSA is very high, which is reasonable at a site at the sea. CO mixing ratios in Hok Tsui station were comparable to those measured at same site in 1994-1996 (Lam et al., 2001).
3.1.2 Temporal variations and overall characteristics
The seasonal cycles of target parameters were analyzed based on hourly-averaged data classified as four seasons: winter 5
(December-February), spring (March–May), summer (June–August), and autumn (September–November). Seasonal averaged values of selected parameters are listed in Table 4. The highest σap and σsp values were observed in winter (10.9 ± 7.1 Mm-1 and 193.5 ± 102 Mm-1, respectively), which were more than twice that of summer. Similar pattern was observed in a previous study in Hong Kong in 1997-1999 (Man and Shih, 2001). Compared with other rural/background sites, the average SSA550nm at Hok Tsui was 0.94 ± 0.03 during autumn which was higher than that measured at Xinken, PRD, China in the same season 10
(0.83±0.05), while this value was 0.90 ± 0.06 in summer which was slightly lower than that observed at a coastal station in Norway in summer (0.91±0.05, Mogo et al., 2012).
Fig. 2 presents the monthly variation of measured optical properties and meteorological parameters. A clear seasonal cycle of aerosol optical properties is shown with σap and σsp peaked in January and reached to the lowest level in July. The aerosol was the darkest in summer especially in August, with a seasonal mean SSA of 0.87, while it was lighter in winter. Averaged 15
seasonal values of 1-SSA in 36 wind sectors are presented in Fig. 3a. These figures show the disparity of SSA from different wind directions. Overall, air plume coming from the southwest to the north (225-360°) had higher 1-SSA, i.e. lower SSA, than that from the east (45-135°). Ding et al. (2013) reported that the contribution of anthropogenic emissions from Guangdong and Hong Kong was the highest in August, which means more freshly emitted urban aerosols were brought to the monitoring station with lower SSA in this month (Cheng et al., 2008). Main synoptic process contributing to this kind sub-regional 20
transport is tropical cyclones. Ding et al. (2004) explained the mechanism on how these tropical cyclones influence the development of sea-land breeze and further on sub-regional and urban air mass accumulation in the South China. Zhang et al. (2013) found an important influence of tropical cyclones in ozone and haze pollution in this region in summer based on an analysis of 13-year data.
Another possible reason for the relatively low SSA in August is that the air mass came mainly from the southwest of the 25
site (Fig. 1), a main waterway for ocean-going vessels in Hong Kong (Yau et al., 2012). These vessels emitted considerable amount of light absorbing carbon from diesel engines during combustion. Similar pattern was also observed in the seasonal diagrams of BC, SO2, PM2.5 and CO which are typical components of ship exhaust (Fig. 2, Hong Kong Air Pollutant Emission
Inventory for 2013 from Hong Kong Environmental Protection Department:
http://www.epd.gov.hk/epd/english/environmentinhk/air/data/emission_inve.html). 30
Fig. 3b demonstrates the averaged 7-day retroplume of the times when SSA was lower than 0.9. Compared with the overall averaged 7-day retroplume during the whole measurement period (Fig. 3c), darker aerosols were mostly from two main types of regions in the vicinity: one was the nearby continental area, where fresh polluted air masses from urban Hong Kong
and neighboring PRD cities, another branch was from the ocean side. Fresh emission of passing ships or fast transport from the South Asia could lead to higher proportion of BC in the air plumes and thus caused lower SSA.
Fig. 4 shows the diurnal cycles of σap, σsp , BC, CO and PM1 for four seasons. There was an increase of σap after sunrise with peak occurred before noontime. It might be associated with a combined effect of increased human activities and turbulence mixing in the boundary layer in the morning. This pattern was more significant in summer although the pollution level was 5
relatively low. This phenomenon supports the explanation of turbulent mixing from middle or upper planetary boundary layer (PBL) because of a stronger vertical mixing in summer. The PM1 also showed a daytime maximum concentration but with the peak in the afternoon (Fig. 4c). For σsp, morning peaks were not as significant as σap. The decrease of σap in the early afternoon might cause by a further development of PBL or mixing layer, in which the air pollutants experienced a substantial dilution, resulting in lower concentrations of pollutants at the ground surface. Diurnal variations and fluctuations of CO mixing ratios 10
show a similar pattern with σap but a relatively smaller variability.
3.1.3 Optical properties and their relationships with particle size
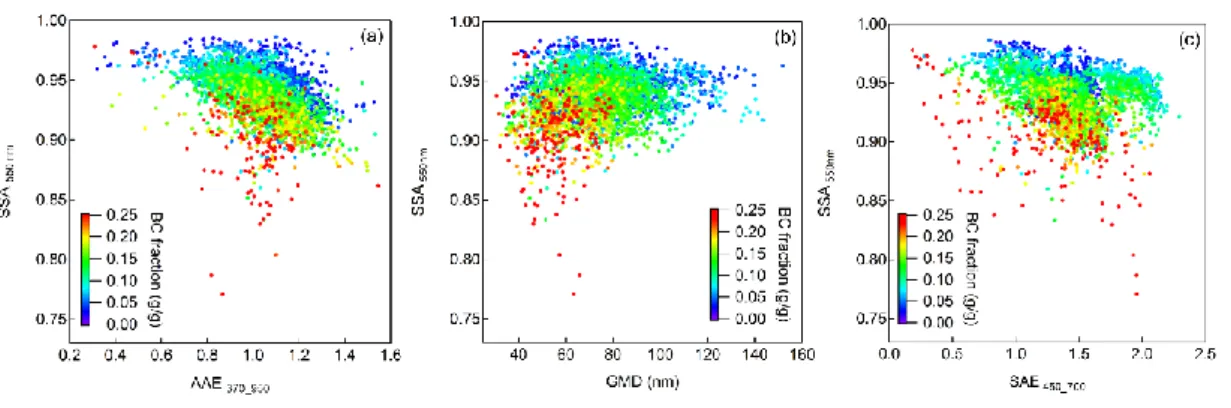
Wavelength dependencies of aerosol light scattering and absorption are closely related to aerosol size and dominating aerosol types. To find out the difference of light absorbing materials, Fig. 5a displays the relationship of SSA with AAE color-coded 15
with BC mass fraction of submicron particles (PM1 was calculated from the particle number size distributions measured with the UFP monitor). It shows that aerosols with high SSA had lower BC fraction and that AAE varied greatly in the lower value region, indicating the dominance of scattering particles. Such kind of air masses was likely of longer transport time and the BC aerosols had mixed well with light scattering aerosols during transport. Contrarily, the low SSA values mostly occurred when AAE were closely distributed around 1.0 and in these cases BC took up a higher proportion (red dots in
20
Fig. 5a), showing a fresh-emitted BC plumes.
Fig. 5b and 5c demonstrate the relationships between particle size and their scattering Ångström exponents as well as their darkness. It can be observed that SAE generally increased with decreasing SSA. Dark aerosols with low SSA were mostly small in size with low GMD but high BC fraction. These small dark aerosols had higher SAE (1.5 to 2.0). The wide range of SAE was possibly due to the mixed control by continental aerosols and large sea-salt aerosols.
25
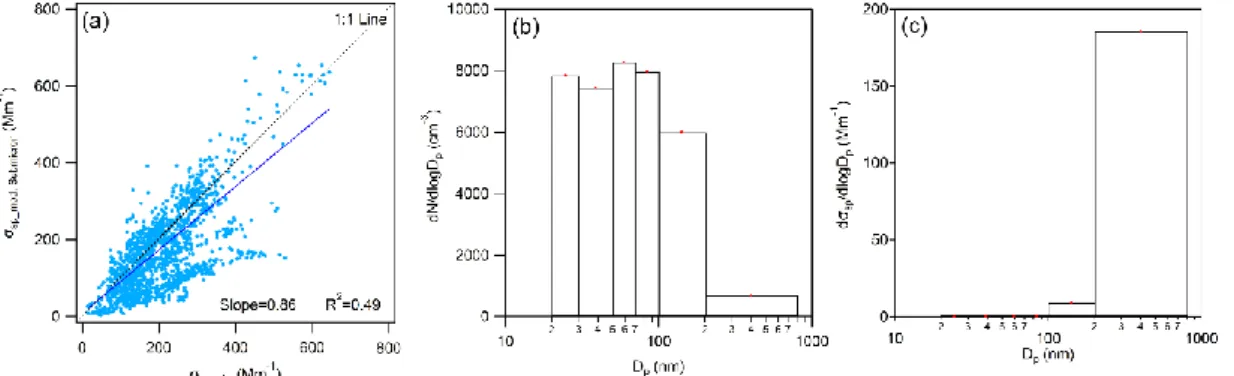
Fig. 6 shows the scatter plot of σsp calculated using Eq.(2) versus the measured σsp . The slope of σsp, submicron / σsp, obs was 0.86, indicating that submicron particles were the major light scattering components in the air masses arriving at the Hok Tsui station. For most of time in the study period, the simulated σsp was lower than the observed σsp. This is probably because that the particle size distribution data from UFP monitor used in the calculation only the scanned submicron particles with mobility diameter from 20 to 800 nm (see Fig. 6b and 6c), but the nephelometer, equipped with a TSP inlet, measured light scattering 30
coefficients from all particles with a wider size range. The relatively limited number of particle size bins in the UFP monitor probably also leads to uncertainties for the calculation of σsp. Hence, this result can only provide rough image of the relationships between particle light scattering and their size distribution at the Hok Tsui station. It can be observed that particles
with Dp less than 200 nm contributed the largest fraction of the total number of submicron particles but very little to the total scattering whereas the small amount of larger particles (Dp: 200-800 nm) contributed the most to the total light scattering.
The scatter plot (Fig 6a) also shows that there were clusters of data where the modeled and measured σsp fit close to the 1:1-line and clusters where the measured σsp was clearly larger than the modeled on. After computing the averaged retroplume of these clusters, it was found that the former data cluster is mostly associated with polluted continental air and the latter with 5
stronger winds and sea salt particles (figures were not shown).
3.2 Source identification
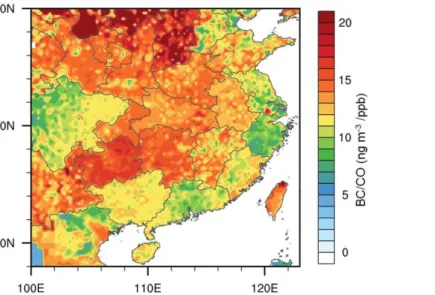
Fig. 7 shows the spatial distribution of BC/CO emission ratios in East China and the nearby regions calculated using the MIX emission inventory. It can be seen that BC/CO emission ratio was higher in Shanxi Province (higher than 25 ng/m3/ppbv), 10
Taiwan Island (approximately 20 ng/m3/ppbv) and the regions along the coastline of East China. As reported by previous studies, BC/CO emission ratio from industrial coal burning ranges from 1.9 to 20 ng/m3/ppbv and it was 5.6~13.3 ng/m3/ppbv from open biomass burning (Wang et al., 2011; Zhang et al., 2009). For diesel vehicles, BC/CO emission ratio was 14~39 ng/m3/ppbv and it was 15.6 ng/m3/ppbv for ship emission calculated from a previous study in South Asia (Dickerson et al., 2002). A strong correlation between BC and CO and a high slope of 27×10-3 g BC/g CO were found from a previous 15
study using C-130 aircraft flew over the Arabian Sea and Northern Indian Ocean (Dickerson et al., 2002; Mayol-Bracero et al., 2002).
In this study, ΔBC/ΔCO and SO2/BC ratios were investigated to study the source characteristics and the freshness of the fuel combustion sources. ΔBC/ΔCO (net growth of BC and CO: total concentration minus regional baseline, Spackman et al., 2008) and SO2/BC were calculated with 1-hour time resolution. The baseline of BC and CO were determined as 1.25th 20
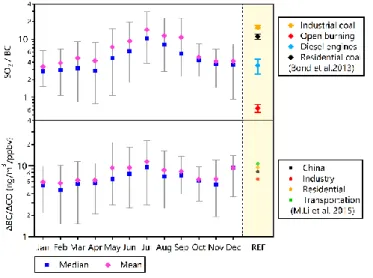
percentiles of data in each month (Pan et al., 2011). Monthly variation of ΔBC/ΔCO is displayed in Fig. 8 together with SO2/BC to demonstrate the fuel burning emission profile since SO2 is a co-emitted species of fossil fuel combustion (Bond et al., 2013). Reference emission ratios of BC/CO and SO2/BC from previous studies (Bond et al., 2013; Li et al., 2015) are also plotted in Fig. 8.
In Hong Kong, major SO2 emission was from navigation and public electricity generation, contributing 50% and 47% 25
to total SO2 emission (Emission Inventory 2013, HKEPD,
http://www.epd.gov.hk/epd/english/environmentinhk/air/data/emission_inve.html). However, these two sources only took up 19% and 6% of CO emission and the largest contributor of CO reported in the emission inventory was road transport (59%). As shown in Fig. 8, ΔBC/ΔCO and SO2/BC ratios presented similar monthly variation patterns. The monthly mean ΔBC/ΔCO ranged from 1.5 to 20 μg·m-3/ppbv during whole study period. The highest values occurred in summer months for both 30
ΔBC/ΔCO and SO2/BC and the ratios were relatively lower in winter. Since SO2 has short lifetime, which can easily deposit and transform into secondary aerosols, the synchronous elevation of ΔBC/ΔCO and SO2/BC in summer indicates that freshly emitted anthropogenic pollutants might be more easily influenced by the air masses in this coastal area. The decrease of
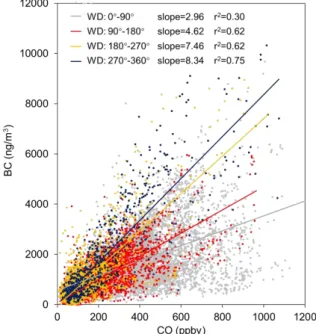
ΔBC/ΔCO and SO2/BC in winter provided the evidence that this area was under the influence of contaminated air masses from a longer distance. Fig. 9 displays the scatter plot of BC vs. CO in four wind sectors, giving an image of the freshness of polluted air masses and the intensities of combustion emissions from different directions. For wind directions from 180° to 360°, the data points show a good positive correlation, suggesting that most of the BC and CO emission sources in these areas were closer to the measurement site. Data points in the 0-180° wind direction sector were much more scattered with a lower slope 5
of BC-CO and weaker correlation coefficients, indicating the higher complexity of source regions and longer transport age of air pollutants coming from the northeast to southeast. Through the transport of air plume, diffusion and deposition of air pollutants would decrease their concentrations arriving to the receptor and therefore lower the slope of ΔBC/ΔCO and their correlation coefficients.
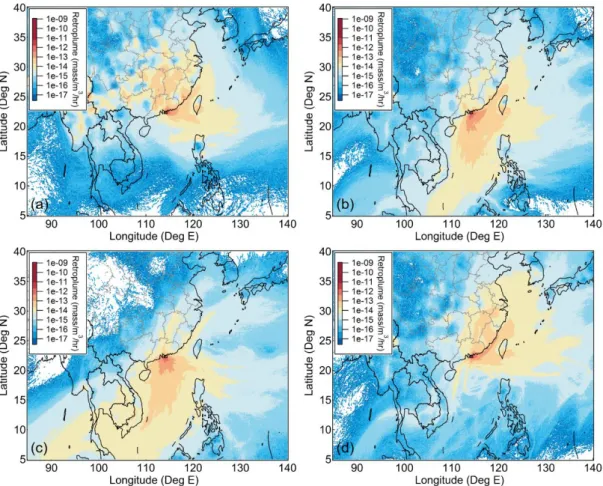
To investigate the transport pattern of air masses arrived at the site during the study period, Fig. 10 shows averaged 7-day 10
retroplume for four seasons. As that presented in Ding et al. (2013), it shows a distinguished different transport patterns under the influence of Asian monsoon. During summer, the majority of air masses came from the south and nearby PRD cities. Due to the dominance of relatively clean marine air, emission from passing ships or local activities in adjacent regions could make visible effects on the temporal variations of air pollutants. The source distribution was more complicated during winter. Driven by the winter monsoon, cold and dry air masses transported along the coastline of the East China and from central China took 15
up a higher proportion in winter months (Ding et al., 2013). There were also air masses passing through Taiwan Island and the East China Sea during cold season (Fig. 10a).
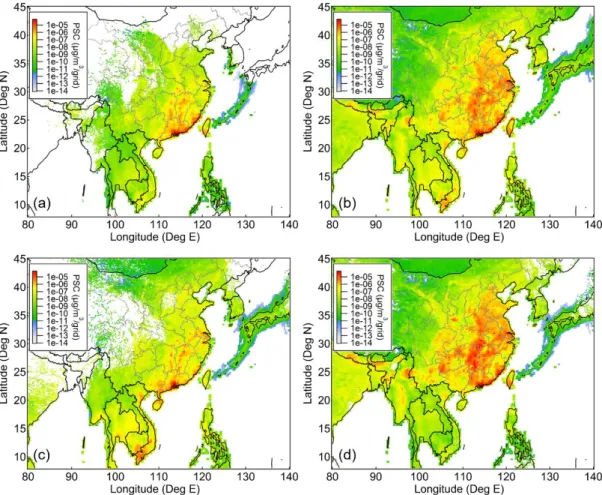
Since BC is the most significant light-absorbing constituent of aerosols, to evaluate the potential source contribution of light absorbing particles on regional optical properties, averaged PSC maps of BC for different transport time and seasons were 20
calculated using the method described in Sect. 2.6, and illustrated in Fig. 11. However, here we only calculated the PSC from emission over land because the available emission inventory from MIX database is mainly focus on land area. As shown in Fig. 11a and 10b, BC concentrations were influenced by the transport from nearby cities within a short time, especially Shenzhen and urban Hong Kong. Long-range transport of BC from the South and East China also played important contribution. It was also showed that BC coming from continental area through longer distance took up a higher proportion of the pollutant 25
level in winter (Fig. 11d) than that in summer month (Fig. 11c). During summer, local emission was the biggest BC contributor.
Fig. 12a-11c illustrates the average levels of σap, σsp and PM1 and the corresponding frequency of occurrence for air masses passing through different regions calculated using Eq.(3). Together with the shipping routes density map (Fig. 12d), it can be observed that the high levels of σap and σsp were closely associated with the congested shipping lanes in the maritime space 30
nearby Hong Kong. The high σap and σsp were especially visible in the northeast due to the prevailing northeasterly wind from autumn to spring, transporting ship exhausts mainly through the Taiwan Strait. The belt-like zone with higher σap and σsp was likely to be the reveal of ship emission. As shown in Fig. 12d, there were dense shipping routes between Hong Kong and Singapore transporting through the Xisha Islands in the South China Sea where the routes were similar to the high σap area in
the south. During summer, Hong Kong was influenced by the southerly and southwesterly wind, bringing clean marine air to this region for the most of time and leading to the lower pollutant levels (Wang et al., 2009; Ding et al., 2013). Here Fig. 12 indicates that Hong Kong could be affected by the passing vessels in the South China Sea due to controlling wind direction driven by the summer monsoon.
5
3.3 Analyses of selected episodes
Fig. 13 demonstrates the aerosol optical properties and BC-CO correlations associated with air masses from different source regions during selected episodes. The major source regions were Guangdong and Hong Kong (GH), ship emission (SP), North China (NC), and aged continental area (AGC). The selection of the episodes was done by combining the footprints using LPDM and the variation trend of aerosol optical properties and PM2.5. The air pollution plumes coming from Guangdong and 10
urban Hong Kong had the highest BC and CO concentrations (Fig. 13a), indicating higher level of emission intensity and stronger light extinction ability of aerosols from these regions. The slope of BC vs. CO was the highest from ship emission (0.012 µg/m3/ppbv) with high correlation (r2=0.84), showing that ship emission source was close to the measurement station and its exhausts could largely affect the pollution level.
15
Fig. 13b displays that Ångström exponents of scattering from Guangdong and Hong Kong were relatively high as well as ship emission compared with that from aged continental area and North China, proving the dominance of smaller particles of emissions from PRD cities and passing ships. BC-containing particles transported from the North and East China went through longer coating and deposition processes, which enlarged their size but decreased their concentrations arriving to the measurement site. This can further explain the lower SSA in summer months.
20
Overall, the analyses suggest that aerosols from different source regions could make great discrepancies on regional aerosol optical properties. Thus, more ground observations of aerosol optical properties are needed to fully understand the characteristics of different types of atmospheric aerosols and provide reference datasets for further investigating aerosol radiative forcing and climatic effects.
25
4. Conclusions
Based on aerosol optical properties, relevant species and aerosol size measured at Hok Tsui station in Hong Kong, we studied the temporal variations and investigated the potential sources by using correlation analysis and Lagrangian dispersion modeling. Overall, the absorption coefficients at the site in the South China coastal region were lower than most of other rural sites in 30
eastern China. Scattering coefficients observed in this study were almost twice as the values monitored at the same station in 1998, yet BC concentrations decreased over fifty percent compared with the measurements in 2004. The darkest aerosols were