The 11.2
µ
m emission of PAHs in astrophysical objects
A. Candian
1,2‹and P. J. Sarre
21Leiden Observatory, Niels Bohrweg 2, NL-2333 CA Leiden, the Netherlands
2School of Chemistry, The University of Nottingham, University Park, Nottingham NG7 2RD, UK
Accepted 2015 January 27. Received 2015 January 26; in original form 2014 July 28
A B S T R A C T
The 11.2-µm emission band belongs to the family of the ‘unidentified’ infrared emission bands seen in many astronomical environments. In this work, we present a theoretical interpretation of the band characteristics and profile variation for a number of astrophysical sources in which the carriers are subject to a range of physical conditions. The results of Density Functional Theory calculations for the solo out-of-plane vibrational bending modes of large polycyclic aromatic hydrocarbon (PAH) molecules are used as input for a detailed emission model which includes the temperature and mass dependence of PAH band wavelength, and a PAH mass distribution that varies with object. Comparison of the model with astronomical spectra indicates that the 11.2-µm band asymmetry and profile variation can be explained principally in terms of the mass distribution of neutral PAHs with a small contribution from anharmonic effects.
Key words: line: profiles – molecular data – molecular processes – ISM: lines and bands – ISM: molecules – infrared: ISM.
1 I N T R O D U C T I O N
The discovery by Gillett, Forrest & Merrill (1973) of an emission feature near 11.2µm in spectra of planetary nebulae opened a new era in the study of interstellar matter. It is now recognized as one of the strongest of the ‘unidentified infrared’ (UIR) or ‘aromatic infrared’ (AIB) bands that lie between 3 and 20µm and which are generally attributed to vibrational transitions of polycyclic aro-matic hydrocarbon (PAH) molecules (for a review see Tielens2008, and references therein). However, in no case has it proved possible to identify a specific PAH molecule. This is unfortunate because knowledge of PAH shape, size distribution, and degree of hydro-genation and/or ionization would allow much greater exploitation of the spectra as probes of astrophysical conditions and processes. The advent of infrared (IR) satellites includingISO,Spitzer(Werner et al.2004a), andAKARI(Murakami et al.2007) has revealed the richness of the AIB spectrum and also significant differences in the profiles of individual bands (e.g. van Diedenhoven et al.2004; Bern´e et al.2007; Rosenberg et al.2011,2012; Boersma, Rubin & Allamandola2012; Boersma, Bregman & Allamandola2013). Interpretation of these variations in terms of the physical and chem-ical properties of PAHs and the astronomchem-ical objects in which they are found could assist in the identification of PAH sub-groups, and thus narrow down the number of possible PAHs as carriers of AIBs. In this paper, we focus on the 11.2µm feature, which is one of the most distinctive bands in the AIB spectrum. It has been assigned to the C–H out-of-plane (OOP) bending mode of solo-containing neutral PAHs (Hony et al. 2001; van Diedenhoven et al.2004; Bauschlicher, Peeters & Allamandola2008; Ricca et al.2012),
E-mail:[email protected]
though their precise molecular shapes and size distribution has not been established. Weaker emission features around 11.0µm are generally attributed to the same type of transition in PAH cations (Hudgins & Allamandola1999; Sloan et al.1999; Boersma et al. 2013). We present here an emission model based on Density Functional Theory (DFT) calculations of vibrational transitions and intensities for a set of PAH molecules. The model considers the emission process following optical/UV excitation using the rel-evant stellar spectral energy distribution (SED) and includes the temperature dependence of the emission wavelength (band posi-tion) as the PAH molecule cools through emission of IR photons. The results are used to explore the variation of the 11.2µm profile in a range of astronomical objects with particular reference to the influence of the PAH mass distribution.
The paper is arranged as follows. In Section 2, the characteristics of the 11.2µm band are reviewed. The theoretical approach and the results of a series of DFT calculations are presented in Section 3 and the emission model is described in Section 4. Sections 5 and 6 contain the results and discussion of their astrophysical implica-tions. A possible contribution from acenes to the 11.0µm feature in the Red Rectangle (RR) is also discussed.
2 C H A R AC T E R I S T I C S O F T H E 1 1 . 2µm B A N D
2.1 Classification of the 11.2µm band
The 11.2µm feature has an asymmetric shape with a steep blue side and an extended red tail (Roche, Aitken & Smith1989; Witteborn et al.1989). Following analysis ofISOobservations of objects in the Galaxy, van Diedenhoven et al. (2004) proposed two classes of 11.2µm sources (A11.2and B11.2) and introduced a description using
Figure 1. Comparison of the 11.2µm profiles of class A11.2(Orion H2S1)
– in red (thin line), B11.2(HD 44179 – the RR), and A(B)11.2(NGC 7027).
TheseISOspectra are continuum-subtracted and normalized to the peak intensity.
atail-to-topratio, i.e. the strength of the red wing relative to the peak intensity of the overall profile with maximum near 11.2µm. Sloan et al. (2007) introduced a third class, C11.2. The class characteristics,
illustrated with examples in Fig.1, are as follows.
A11.2– the most common, with a peak wavelength ranging
be-tween 11.20 and 11.24µm and a relatively short red tail. Sources belonging to this class have a low value oftail-to-topratio and comprise various types of interstellar matter – reflection nebulae, HIIregions, and the general interstellar medium.
B11.2– less common, with a peak wavelength of 11.25µm and
a long tail. Objects in this class, such as the RR (HD 44179), have a high value oftail-to-topratio and are usually associated with circumstellar matter.
C11.2 – only a few examples, with peak wavelength ranging
between 11.35 and 11.40µm and an approximately symmetric shape. Bands belonging to this class are found in carbon-rich objects.
Some objects (mostly planetary nebulae) are classified as class A(B)11.2 and have a mixture of the characteristics of the A and
B classes, with a peak wavelength of class A11.2and atail-to-top
ra-tio of class B11.2objects (see for example BD+30◦3639 in Fig.1).
Also, within the single reflection nebula NGC 7023, variation in the 11.2µm spectra from type A to A(B) has been found (Boersma et al.2013). The A/B-type classification has also been applied to other spectral features in the 3 and 6–9µm regions.
Based on a study of mid-IRSpitzerspectra of carbon-rich post-AGB stars in the LMC, Matsuura et al. (2014) have introduced separate classifications for the 6–9 and 10–14µm regions, where the spectra for the latter region are classified asα,β,γ, andδ. As the spectra we consider here are high-resolution data fromISO-SWS (de Graauw et al.1996), we have elected to use the A11.2, B11.2, and
A(B)11.2classification of van Diedenhoven et al. (2004).
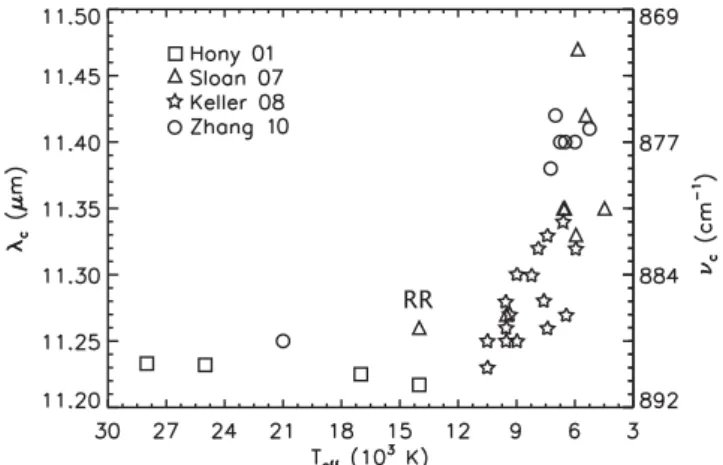
RR
Figure 2. Peak wavelength (λc) and class-type of the 11.2µm feature versus
effective temperature (Teff) of the central star. The squares are a sample
of type A/A(B)11.2sources from Hony et al. (2001): GGD 27-ILL (star
formation region), CD-42 11721 (Herbig Ae/Be star), NGC 7023 (reflection nebula), and IRAS 21282+5050 (planetary nebula). The triangles are the Red Rectangle (RR) and mostly carbon stars (class B11.2to C11.2) from
Sloan et al. (2007), the five-point stars represent Herbig Ae/Be stars (class B11.2to B/C11.2) from Keller et al. (2008), and the circles are protoplanetary
nebulae (class B/C11.2to C11.2) from Zhang, Kwok & Hrivnak (2010).
2.2 Asymmetry and peak wavelength of the 11.2µm band Interpretation of the shape and the variation in the profile of the 11.2µm band is a significant challenge which requires an expla-nation of (a) the steep short-wavelength side, (b) the variable peak wavelength, and (c) the extension to longer wavelength. Consider-ing these in turn:
(a) The wavelength at half peak intensity (λ1/2) on the
short-wavelength side of the 11.2µm feature in 16 spectra of class A11.2sources is almost invariant, which we determine to be 11.171
(2σ =0.002)µm; the origin of this striking property is not under-stood. If the short-wavelength edge is considered to be part of a Lorentzian profile this would correspond to an FWHM (full width at half-maximum) of onlyc.4 cm−1which is narrow compared with
other UIR bands.
(b) The peak wavelength of the 11.2µm feature has been found to depend on the effective temperature,Teff, of the exciting star
(Sloan et al. 2007; Keller et al. 2008). Fig. 2 collects together data from various authors. The peak wavelength of the 11.2µm band is independent of temperature for class A11.2objects (squares),
but starting from class B11.2(triangle – the RR) it shifts to longer
wavelength with decrease in stellar temperature. This change has been interpreted in terms of relatively newly formed mate-rial near-to-low temperature carbon-rich or Herbig Ae/Be stars (class C11.2) compared with older processed material in the higher
temperature environments of planetary nebulae and HII regions
(Sloan et al.2007).
(c) Barker, Allamandola & Tielens (1987) suggested that the long red tail of the 11.2µm band may be due to superimposed transitions between higher vibrational levels such asv=2→1. In the absence of laboratory data this contribution was incorporated assuming that thev=2→1 band falls at an arbitrarily chosen wavenumber 5 cm−1 lower than for the fundamental transition.
More recently, van Diedenhoven et al. (2004) noted that while a feature of class A(B)11.2could be considered as coming from the
difference between the A11.2and B11.2classes could not readily be
explained by anharmonic effects alone. A contribution to emission in the red tail could potentially come from duo-Hs of compact PAH cations (Hudgins & Allamandola1999), C–H OOP transitions in PAH anions (Bauschlicher, Peeters & Allamandola2009) or from protonated PAHs (Knorke et al. 2009). In addition, Wada et al. (2003) have discussed the possible role of13C isotopic substitution.
Blind spectral decomposition studies indicate that a contribution to the red wing of ‘11.2µm’ emission arises in carriers well removed from the exciting star in e.g. NGC 7023; this emission has been ascribed to ‘Very Small Grains’ (VSGs; Rapacioli et al.2006; Bern´e et al.2007; Rosenberg et al.2011,2012).
The shapes of the AIBs have been modelled (Schutte, Tielens & Allamandola1993; Cook & Saykally1998; Verstraete et al.2001; Pathak & Rastogi 2008; Candian et al.2012); the most detailed study of the 11.2µm band is that of Pech, Joblin & Boissel (2002) and includes both intermode anharmonicity [which from laboratory measurements of Joblin et al. (1995) allows the effect of cooling on emission wavelength and linewidth to be estimated], and intramode anharmonicity which is a contribution from vibrational transitions of the typev→v−1 withv≥2. A mass distribution for the PAHs was included of the formN−C3.5whereNCis the number of carbon
atoms. This affects the response of the PAHs to optical excitation and their subsequent cooling. However, in considering molecular diversity, it was assumed that all PAHs contributing to the 11.2-µm band profile had exactly the same IR active mode frequency. It was deduced that the asymmetric profile appeared to be characteristic of the anharmonicity of molecular modes, and that including a spread of frequencies according to molecular size and geometry would lead to a change in overall band shape and consequent difficulty in achieving a good fit to the observed band. This contrasts with the work reported here where we find that the dependence of the vibrational transition frequencies on the masses of the 11.2µm carriers and their relative abundance are key factors in determining the overall 11.2-µm band profile and its variation between objects.
3 D F T C A L C U L AT I O N S
3.1 Theoretical approach
A large number of DFT calculations of PAH vibrational frequen-cies have been reported. Attention has generally been focused on neutral and singly ionized (i.e. radical cation) PAH molecules, with extension to hydrogenated, protonated, irregular, and other closed-shell charged PAHs (Beegle, Wdowiak & Harrison2001; Hudgins, Bauschlicher & Allamandola2001; Pathak & Rastogi2005,2006; Bauschlicher et al.2008,2009,2010; Ricks, Douberly & Duncan 2009; Hammonds, Candian & Sarre2011; Ricca, Bauschlicher & Allamandola 2011; Ricca et al.2012; Boersma et al. 2014; Can-dian, Sarre & Tielens2014). The work reported here is in two closely related parts.
First, we report the results of DFT calculations on a set of medium-sized PAHs, inspired in part by the work of Pathak & Rastogi (2005) on a series of acenes up to heptacene (see their fig. 7 which shows convergence of the solo-OOP wavelength at high mass). We have undertaken a systematic investigation to explore how the frequency and intensity of the OOP bending solo modes of neutral PAHs vary with PAH size and shape. The calculations were performed usingQ–CHEM(Shao et al.2006) with the B3LYP
functional (Becke1993; Stephens et al.1994) and the 6–31G* basis set. Secondly, DFT calculations were carried out for selected highly
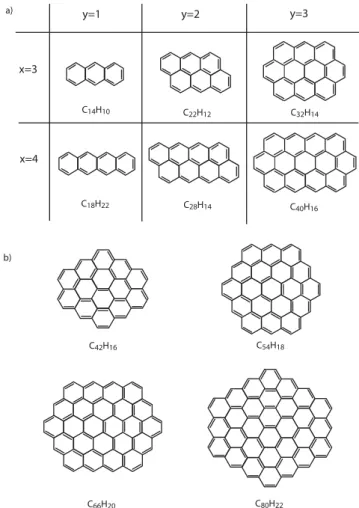
Figure 3. Molecular structures (a) for PAHs withx=3–4 andy=1–3, wherexis the number of six-membered rings in a row andyis the number of rows. Fory=3,xindicates the number of edge rings in the top and bottom rows. In (b) four large PAH structures with D2hand D6hsymmetry are shown.
symmetric compact large solo-containing PAHs and these results applied in the full spectral profile modelling. Gas-phase laboratory data were used to obtain mode-specific vibrational scaling factors.
In the first part of the study, PAH structures are labelled (x,y), wherexis the number of six-membered rings in a row andyis the number of rows. Examples include anthracene (C14H10) for which
x=3 andy=1 and anthanthrene (C22H12) for whichx=3 andy=2
(see Fig.3a and Table1a). Vibrational frequencies computed in DFT calculations are systematically high and a scaling factor is often invoked to bring calculation and experiment into agreement. Here, a scaling factor for the specific solo-OOP mode was employed. For
y=1, 2, and 3 PAHs a scaling factor of 0.987 was adopted in the modelling, determined by comparing the high-resolution gas-phase experimental value for anthracene of 876.7 cm−1(Can´e et al.1997)
with the unscaled DFT result of 888.2 cm−1.
Table 1. Computed scaled DFT (B3LYP/6–31G*) C–H OOP vi-brational wavenumbers for (a) acenes withx=3–8,y=1 and multirow PAHs withx=3–7,y=2 and 3 (sf=0.987, see the text), and for (b) large compact PAHs (sf=0.975, see the text) shown in Fig.3.
(x,y) Molecule Wavenumber Wavelength Intensity (cm−1) (µm) (km mol−1)
(a)
(3,1) C14H10 876.7 11.410 55.0
(4,1) C18H12 895.3 11.169 69.3
(5,1) C22H14 901.7 11.090 87.8
(6,1) C26H16 905.7 11.041 106.7
(7,1) C30H18 906.6 11.030 124.8
(8,1) C34H20 906.6 11.030 146.2
(3,2) C22H12 875.2 11.426 96.9
(4,2) C28H14 881.8 11.340 109.3
(5,2) C34H16 886.5 11.280 123.4
(6,2) C40H18 888.1 11.300 133.7
(7,2) C46H20 888.1 11.300 172.0
(3,3) C32H14 884.2 11.310 123.0
(4,3) C40H16 890.5 11.230 155.4
(5,3) C48H18 891.3 11.220 185.0
(6,3) C56H20 891.3 11.220 204.6
(7,3) C64H22 891.3 11.220 231.8
(b)
C32H14 877.0 11.403 120.3
C42H16 882.2 11.328 154.3
C54H18 885.0 11.300 190.6
C66H20 887.9 11.262 203.61
C80H22 889.3 11.245 234.31
C96H24 891.1 11.222 265.16
0.975 was used for these molecules, deduced by reference to the experimental gas-phase data for the solo-OOP bending mode of ovalene (C32H14; Joblin et al.1994).
The use of a scaling factor is normal practice when comparing laboratory and DFT results. Typically, a scaling factor of 0.958 for B3LYP/4–31G is used for simplicity for the entire spectrum, based on comparison with matrix-isolation data. However, it is known that this technique introduces unpredictable shifts in the band positions (Langhoff1996). In contrast to previous studies, the scaling factor employed in this work is referenced to gas-phase data and is specific to the vibrational mode (solo-OOP transitions of PAHs). For our analysis, this is preferable to the use of a generic scaling factor. At the present time, there is insufficient laboratory gas-phase data on a range of PAHs to evaluate the applicability of the same scaling factor for all PAHs. However, the use of the well-characterized B3LYP/6–31G* and the mode-specific scaling factor should reduce the uncertainty significantly.
3.2 Results and Discussion
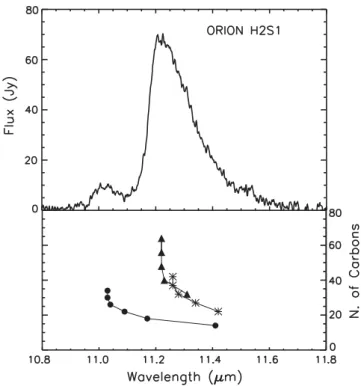
Table1 collects together the computed intensities and unscaled vibrational wavenumbers of the studied molecules. Fig.4shows that for the acenes (x=3–8,y=1) the wavelength decreases with increase inx(or number of carbon atoms), converging towards a high-mass asymptotic value of 11.03µm. A similar characteristic holds for zig-zag edge molecules with two rows (stars) and three rows (filled triangles), but they reach the high-mass limiting value at longer wavelength (Fig.4, lower panel). In all cases, the wavelength for the solo-OOP bending mode moves to shorter wavelength as the number of carbon atoms (i.e. the mass) increases (see Tables1a and
Figure 4. Upper panel:ISO-SWS spectrum of the 11.0- and 11.2-µm band complex in Orion H2S1, an example of class A11.2. Lower panel: wavelength
behaviour of the OOP bending transition with respect to number of carbon atoms fory=1 (filled circles – acenes),y=2 (stars), andy=3 (filled triangles) – see Fig.3(a) and Table1(a).
b). A similar dependence of the C–H OOP frequency on PAH mass is found in the computed data of Bauschlicher et al. (2008) who used the B3LYP functional and a (smaller) 4–31G basis set; the values for C54H18and C96H24are 11.061 and 10.959µm, respectively.
Larger PAH molecules withNC>100 are needed to determine
the value at the asymptotic limit but this was beyond our computa-tional capacity. Hence a funccomputa-tional form was used to fit the available data (once scaled) from Table1(b) and so deduce the asymptotic wavelength limit for the largest PAHs:ω=(b+a/N2
C)−1, whereω
is the mode wavenumber andNCthe number of carbon atoms. The
parameters of the best fitting area=0.021±0.002 and the asymp-totic value b=11.2139± 0.0007µm (or 891.75±0.06 cm−1).
Thus, the inferred asymptotic limit for large PAHs falls to shorter wavelength compared with low-medium mass PAHs, i.e. PAHs with multiple rows withy=2 and 3 as shown in Fig.3(a). The value of 11.21µm falls within the range of peak wavelengths (11.20– 11.24µm) in class A11.2objects (van Diedenhoven et al.2004) and
falls very close to the observed value ofλ1/2of 11.171µm discussed
in Section 2.2(a).
Key results from these calculations are (a) the more extended (acene) and larger PAH molecules have solo-OOP modes at the shortest wavelengths, (b) the transition wavelengths for acenes and for large PAHs reach asymptotic values at high mass, (c) increasing the number of rows (larger PAHs) results in a faster approach to the asymptotic limit than for the single-row acenes, (d) the higher mass acenes may contribute to 11.0µm emission. The presence of a high-mass asymptote for the wavelength of the largest PAHs provides an attractive explanation for the steepness and wavelength invariance of the short-wavelength side (λ1/2) among class A11.2
4 E M I S S I O N M O D E L
In this section, we describe how the DFT results for frequencies and intensities are incorporated into a model for the AIB emission occurring in astrophysical environments. As far as we are aware this is the first attempt to include mass dependence of the PAH emission wavelength into a model and using, where available, reference to experimental results. We have chosen to employ a model based on the thermal approximation (as employed by e.g. Pech et al.2002; Pathak & Rastogi2008).
4.1 Theoretical approach
L´eger, d’Hendecourt & Defourneau (1989) proposed that the ther-mal approximation can be used to describe the IR cooling of PAHs where this treatment assumes that a molecule can be considered as a heat bath with an average molecular energyUand temperature
T. Following absorption of a UV photon, a PAH molecule has an internal energyU(Tp), whereTpis the (initial) peak temperature.
In the harmonic approximation, the internal energy can be written as
U(T)=
n
i=1
hc ωi
exp(hc ωi/kBT)−1
,
whereωiis the wavenumber of theith vibrational mode andnis the total number of modes of the molecule. The PAH molecule cools through its various vibrational modes, through a so-calledradiative cascade. For theith mode the emission rateφiis given by
φi=
A1i,0 exp(hc ωi/kBT)−1,
where the Einstein coefficientsA1i,0for spontaneous emission can
be calculated from the DFT transition intensities (Cook & Saykally 1998).
The fractional energy emitted in theith mode, corresponding to a fall in internal energyδU, is
δEi(T)= φi
×ωi
n
i=1φi×ωi
δU(T).
The total emitted energy is obtained by integration over the tem-perature range fromTpto 50 K, and weighted by the rate of photon
absorption
Rabs=
13.6
0
Bd νσν
hν dν,
where ν is the frequency of the absorbed photon, σν is the
frequency-dependent photoabsorption cross-section, and 13.6 eV represents the high-energy cut-off in the radiation field. For each molecule,σνwas taken from the French-Italian data base1(Malloci,
Joblin & Mulas2007). For a molecule (PAH1) for which there was no entry, the cross-section was estimated using data available for the molecule closest in size (PAH2), scaled byNPAH1
C /NCPAH2 (Mulas
et al.2006). The excitation source is represented by a diluted Planck functionBd
ν (see Table2). At high photon energy, photoionization
of the neutral PAH can also be significant and leads to a reduction in the quantum yield for IR emission. To take this process into account, we incorporated in our modelling the energy-dependent photoyield using the empirical law given by Le Page, Snow &
1http://astrochemistry.oa-cagliari.inaf.it/database
Table 2. Physical conditions for objects considered in the modelling. Teffrepresents the effective temperature of the central star in K,Lthe
luminosity in units of solar luminosity (L),Wdilthe geometric dilution
factor andDthe distance in kpc. In the case of the HD 44179, the two components of the binary stellar system are taken into account.
Object Orion H2S1 NGC 7027 HD 44179
Classa A11.2 A(B)11.2 B11.2
Teff(K) 4×10⁴b 1.6×10⁵c 8250d 6×10⁴d
L(L) 1.35×10⁷e 10f 6×10³d 100d
Wdil 2.09×10⁻¹¹ 2.8×10⁻¹⁷ 4.8×10⁻⁶ 3.7×10⁻¹³
D(kpc) 0.45b 1f 0.71d
avan Diedenhoven et al. (2004),bO’Dell (2001),cBeintema et al. (1996), dMen’shchikov et al. (2002),eVerstraete et al. (2001),fBujarrabal et al. (2001).
Bierbaum (2001) and ionization energies (IE) from the French-Italian data base. When experimental values were not available, a theoretical vertical IE was used.
4.2 Experimental input
Joblin et al. (1995) studied the influence of temperature on IR absorption spectra of gas-phase PAHs in the laboratory and found a linear dependence on temperature for both band position and band width, arising mostly from anharmonic coupling between modes. The following relations for the frequencyω(T) and widthω(T) were used in the modelling:
ω(T)=ω0+ωRS+χT (1)
and
ω(T)=ω(0)+χT , (2)
whereωRS=ωL(0)−ω0can be considered to be an empirical
red-shift (RS) between the calculated DFT frequency (at zero Kelvin) ω(0) and the frequencyωL(0), at zero Kelvin inferred from the
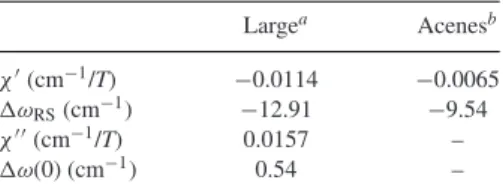
ex-perimental (laboratory) studies (Cook & Saykally1998). Table3 collects the coefficients for the solo-OOP mode. We consider ova-lene and anthracene to be representative of large and small (acene) PAH molecules, respectively. In the case of ovalene,χwas derived after removing the rotational contribution (see fig. 8 of Pech et al. 2002). For a molecule such as ovalene and based on experiments
Table 3. Empirical coefficients for the temperature-dependent wavenumber and linewidth of the solo-OOP mode (see equations 1 and 2).
Largea Acenesb χ(cm−1/T) −0.0114 −0.0065
ωRS(cm−1) −12.91 −9.54
χ(cm−1/T) 0.0157 –
ω(0) (cm−1) 0.54 –
aMeasurements on neutral gas-phase ovalene in the 550–820 K range and in a Ne matrix at 4 K (Joblin et al.1994,1995; Pech et al.2002).
Figure 5. Emission profile computed for C54H18exposed to stellar
radia-tion withTeff=8250 K (dotted line) and 160 000 K (full line). The linewidth
is taken to be constant with an FWHM of 5 cm−1.
in absorption, it is expected that the emission will move to longer wavelength (lowerω) as the cooling cascade occurs, and that the linewidth will increase.
4.3 Single molecule calculation: influence of temperature?
We consider here the emission profile resulting from the cooling cas-cade for a single PAH molecule, circumcoronene (C54H18, Fig.3b),
in radiation fields withTeff=8250 and 160 000 K corresponding
to HD 44179 and NGC 7027, respectively. The results are given in Fig.5and show that (a) the peak wavelength is redshifted and (b) the redward side extends to longer wavelength for a PAH with a high initial internal temperature (i.e. irradiation as in NGC 7027). However, this is not in agreement with observation. The observed peak wavelength in NGC 7027 is lower and the red wing is no more extended than in HD 44179 (see Fig.6). We also remark that a red tail originating from ‘hot-band’ emission from higher vibrational levels is difficult to reconcile with the presence of class A11.2
fea-tures (with a low tail-to-top ratio) in many compact and extended HIIregions (van Diedenhoven et al.2004).
We conclude that a factor other than the radiation temperature is responsible for the change in 11.2µm profile between objects and, given the DFT results of Section 3, propose that the dependence of the emission wavelength on PAH mass is the largest single fac-tor in determining the differences in the 11.2µm profiles between objects. This is now explored through modelling of astronomical emission profiles which includes the wavelength dependence on PAH mass.
4.4 Summary of calculations
The procedure to calculate the energy E(T) emitted in a band is described in Section 4.1. EachE(T) is then associated with a Lorentzian profile so that the total energy emitted in the solo-OOP bending mode is described by
Esolo(ω)=
m
αm
T
(/2)Em(T)
π((/2)2+(ω−ω
m(T))2)
,
where=ωm(T) is the FWHM,αmis a multiplicative coefficient, andmis summed over the molecules considered. This calculation is then weighted byRabsand aχ2-minimization routine employed
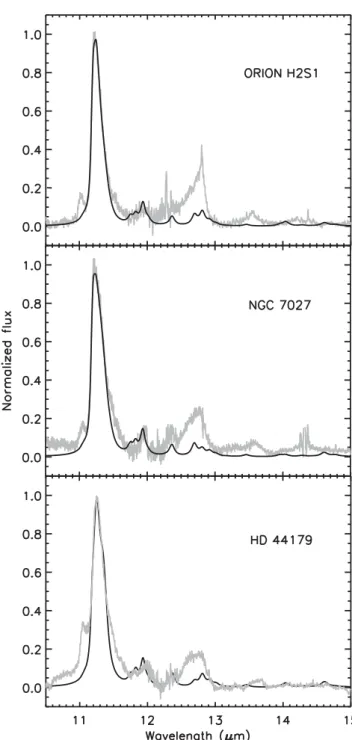
Figure 6. Continuum-subtractedISO-SWS spectra of objects of class A11.2
– Orion H2S1, A(B)11.2– NGC 7027, and B11.2– HD 44179, the Red
Rectangle (grey line), superimposed with the emission model results using (Model 1) temperature-dependentω(T) (short dashed line), and (Model 2) molecule-specific constrained widthsω(long dashed line) – see the text for details. The lower panel shows the (scaled) wavelength behaviour of the solo-OOP mode of large PAHs from Table1(b).
to determine the best fit to the astronomicalISOspectra of the three sources – Orion H2S1, NGC 7027, and HD 44179 (see Table2) – with the smallest possible number of contributing molecules. The only variable in theχ2-minimization is
5 A S T R O N O M I C A L P R O F I L E M O D E L L I N G
In this section, we describe the results of modelling the 11.2µm band for three profile classes: (A11.2, A(B)11.2, and B11.2). It was
found that only four very symmetrical solo-containing molecules (C32H14, C42H16, C54H18, and C66H20, Table1b) were needed to
produce acceptable fits, the sole variable in the χ2 optimization
being the relative proportions of these PAHs (αm) which are taken to be representative of the PAH mass distribution. However, we emphasize that this does not represent identification of these partic-ular four PAHs; rather the results show that solo-containing neutral PAHs in this absolute and relative size range provide a good fit to the 11.2µm feature and its profile variation with object. This aspect is discussed further in Section 6.1. Two closely related models were developed.
5.1 Model 1: 11.2µm modelling using temperature-dependent linewidths
In the first application of the above approach (short-dashed line in Fig.6), the experimentally-based temperature dependence for the band frequency and width (equations 1 and 2, respectively – see Sec-tion 4.2) for ovalene were taken to hold for the larger molecules in the set (i.e. independent of PAH mass). However, as each molecule has a different initial peak temperature (determined by the stellar SED) and a different vibrational solo-OOP frequency according to molecular size, the cooling cascade and resultant emission profile necessarily differs in each case. Aχ2-minimization was undertaken
with the only variable being the relative abundance of the four PAHs. This model provides a reasonable match with the peak wavelength and long-wavelength tails of the bands, but it does not account very well for the steep short-wavelength side seen in many astronomical spectra including Orion H2S1 and NGC 7027. This discrepancy falls in the part of the profile where high-mass PAHs are expected to contribute most strongly and lies near to the asymptotic limit discussed in Section 3.2.
Considering the experimental observations for the widths of the IR active C–H stretch transitions in naphthalene, pyrene, and coronene2(equation 2), then for a given temperature the width of
the band is found to decrease with increase in PAH mass (see ta-ble 2 and fig. 4 in Joblin et al.1995); for example at 600 K the linewidth values for naphthalene, pyrene, and coronene are 40, 26, and 15 cm−1, respectively. The solo-OOP transition linewidth
be-haves similarly; at 370 K the experimental solo-OOP linewidths in absorption for anthracene (Can´e et al.1997) and ovalene (Joblin, C., personal communication) are 25 and 6 cm−1, respectively.
Ad-ditionally, as higher mass PAHs do not reach as high an internal temperature – for the same exciting SED, high-mass PAHs have narrower absorption (and emission) band widths than their lower mass counterparts. This aspect is addressed in Model 2.
5.2 Model 2: molecule-dependent temperature-independent linewidths
Assuming that a Lorentzian profile describes the short wavelength side of the 11.2µm band for class A11.2and A(B)11.2objects, then
from profile fitting of the short-wavelength part of the profile we obtain a Lorentzian peak wavelength of 11.198µm (or 893.02 cm−1)
and an FWHM of only 0.05µm (or 4 cm−1). This FWHM represents
2Ovalene was not considered because the law was deduced from only two
experimental points.
the upper limit on the width of a single contribution to the shorter wavelength side of the 11.2µm band. A similar value has been suggested by Cami (2011). Using this information, Fig.6shows the bestχ2- minimized fit with constrained FWHM values of 10, 7.5, 5,
and 4 cm−1for C
32H14, C42H16, C54H18, and C66H20, respectively.
The value of 10 cm−1was taken for ovalene with reference to the
laboratory absorption data (at 600 K) and the 4 cm−1 value as
constrained by the observational data (see above and Section 5.1). The fit to the steep short-wavelength side of the 11.2µm band for the class A11.2 and A(B)11.2 objects is improved, while the
long-wavelength tail does not change significantly. Thus, an accurate description of the shorter wavelength side of the 11.2µm band requires lower linewidths than experimentally found for the FWHM of e.g. ovalene. We also note the RR, and in part NGC 7027, has a discrepancy in the 11.45–11.65µm region in both models. We return to this in Section 6.2.
5.3 Effect of SED on computed 11.2µm profiles
In Section 4.3, it was shown that for a single PAH molecule, C54H18,
the calculated emission profile with a lowTeffSED is narrower than
for higherTeff. To explore the effect of the excitation SED on
com-puted 11.2µm profiles, we have taken the (fixed) mass distribution which was determined for NGC 7027 using the SED for NGC 7027, and calculated the profile using a lowerTeffSED – that of the RR.
The calculated result in Fig.7(upper panel, full line) is qualitatively similar to the single-molecule calculation and gives a very poor match to the astronomical spectrum for NGC 7027 when compared with Fig.6(middle panel, Model 2). Similarly, taking the (fixed) mass distribution as deduced for the RR, using a high-temperature SED (that of NGC 7027) also yields a poor match (Fig.7, lower panel, full line). Clearly, the SED used in the calculation plays a role in determining a computed 11.2µm profile but the SED is fixed for a given object and the observed profile is determined principally by the solo-containing PAH mass distribution.
6 A N A LY S I S A N D D I S C U S S I O N
6.1 PAH mass distribution and the 11.2µm profile
Taking the sum of the contributions of the two lower mass PAHs (C32H14and C42H16) to the 11.2-µm band fit in Model 2, and
sim-ilarly taking C54H18and C66H20 as representative of higher mass
PAHs, an indicative low mass to high mass abundance ratio can be determined with the break falling atNC ∼ 50. Using theχ2
fitted results, this ratio is 1.8:1 for Orion H2S1, 2.4:1 for NGC 7027, and 3.7:1 for the RR. From this we infer that the RR PAH population comprises lower mass PAHs than for NGC 7027 and Orion H2S1. We deduce that the shape and peak wavelength of the 11.2µm feature can be described principally in terms of the PAH mass distribution, where high-mass PAHs are responsible for the steep short wavelength side. The low variance ofλ1/2and the
steep blue side in A11.2 objects arise as a natural consequence of
the asymptotic limit reached by the solo-OOP mode in high-mass PAHs. In class B11.2objects such as the RR, the less steep
short-wavelength side, the more extended redward tail and a band maxi-mum at longer wavelength suggests that the PAH mass distribution is skewed towards lower masses than in class A11.2 objects. The
class A(B)11.2object NGC 7027 then falls between the class A and
Figure 7. Upper panel. Calculated results for the 11.2µm in the spectrum of NGC 7027 (grey) using the mass distribution inferred for this object from Model 2 and using the SED for the Red Rectangle. Lower panel. Calculated results for the astronomical 11.2µm band in the Red Rectangle (grey) using the mass distribution inferred for this object from Model 2 and using the SED of NGC 7027.
(2013) fitted the PAH emission spectra as a function of offset from the star HD 200775 using the NASA AMES PAH IR Spectroscopic Database (Bauschlicher et al.2010). The shape of the 11.2µm fea-ture evolves from class A11.2relatively near the star (cf. 20 arcsec
offset) towards B11.2 as a denser region is approached at higher
offset. It was concluded that the overall PAH spectra result from ap-proximately equal proportions of large and small PAHs at Position I (a dense region) with larger PAHs being more prominent in the diffuse region (Position II). Our interpretation of the 11.2-µm band shape is consistent with these results, though our approach differs in that our inferred mass distributions hold specifically for neutral solo-containing PAHs.
6.2 Emission in the 11.4–11.7µm region
The RR and to a lesser extent Orion H2S1 and NGC 7027 have excess emission relative to the models in the 11.4–11.7µm wave-length region. Based on the results of DFT calculations and the gas-phase experimental OOP value for anthracene of 11.4µm (at 373 K, see Fig.6), it is suggested the excess in the RR is due to emission from relatively low-mass PAHs which were not included in the modelling of the 11.2µm feature presented here. The scaled DFT OOP bending modes for anthracene C14H10 (x=3;y=1)
and anthanthrene C22H12(x=3;y=2) fall at 11.4µm. This too
Figure 8. Experimental gas-phase absorption spectra (T∼500 K) of an-thracene (C14H10, top panel), 1,2,3,4-tetrahydroanthracene (C14H14,
mid-dle panel) and 1,2,3,4,5,6,7,8-octahydroanthracene (C14H18, bottom panel).
The data are taken from NIST MS Data Center/S. E. Stein (2011). As the number of attached hydrogens increases, the peak position of the solo C–H OOP bending mode moves to longer wavelength.
is consistent with a PAH population of lower mass for the RR de-duced separately in Section 6.1. Noting the usual redward shift that occurs in emission, these and similar molecules probably contribute to emission in the 11.4–11.7µm region.
A second possible contribution to the ‘excess’ could arise from hydrogenated PAHs. Addition of hydrogen atoms to PAH molecules (H-PAHs) perturbs the C–H OOP bending mode frequency, thus affecting the peak position. Fig. 8 shows gas-phase absorption spectra in the 11.4µm region, recorded at ∼500 K (NIST MS Data Center/S. E. Stein2011) for the closely related molecules: anthracene (C14H10), 1,2,3,4-tetrahydroanthracene (C14H14) and
1,2,3,4,5,6,7,8-octahydroanthracene (C14H18). Starting with
near 3.4µm, and that aromatic C–H OOP bending mode bands in the 11–15µm region shift and weaken (Sandford, Bernstein & Materese 2013). However, very few PAHs in the sample set had solo-hydrogens. We tentatively suggest that a signal identified by Rosenberg et al. (2011) could be due to solo-containing hydro-genated PAH molecules rather than ‘Very Small Grains’ – VSGs (see their fig. 6); further assessment of this will be described else-where. Significantly, objects classified as A(B)11.2and B11.2, show
aliphatic bands at 3.4 and 3.52µm (Geballe et al.1985) as would be expected to appear when PAH hydrogenation levels are high; these bands appear in the experimental spectra of hydrogenated an-thracene, but emission in the 6–9µm region remains weak as for other neutral PAHs.
6.3 The 11–15µm and wider spectral region
The molecules considered here give a strong contribution to the UIR bands in the 11–15µm range (Schutte et al.1993). Fig.9shows the fingerprint region for the three prototype objects compared with the emission model results. Due to the lack of T-dependent experimen-tal data for the position of and width of the bands in the finger-print region, a single scaling factor of 0.979 and a fixed FWHM of 12 cm−1were applied for all bands. To combine the fit for the
11.0–11.2µm band region and the remaining bands in the finger-print region, we assumed that the molecular contribution for the solo mode in a PAH can be modelled as a Lorentzian function peak-ing at the scaled (sf=0.979) DFT frequency but with an FWHM of 10 cm−1. The predictions for the bands in the fingerprint region
are consistent with the astronomical spectra of the three objects, with no more than a small contribution to the 12.7µm feature. The model slightly overestimates the flux of the 12.0µm band for the RR, which is generally ascribed to duo-hydrogen modes (Hony et al.2001). However, in SWS-ISOdata, the region around 12µm is sensitive to the way spectra are combined, thus introducing extra uncertainty of 20–30 per cent (Hony et al.2001). A further issue is placement of the continuum in the subtraction applied to the spec-tra. The lack of a detailed treatment of anharmonicity (temperature dependence) may also affect this modelled spectrum. It is notable that the model built on treatment of the 11.2µm region does not introduce features which are not present in astrophysical spectra of the 11–15µm region; this is also the case for the 6–11µm region. For example, the strongest calculated vibration of C54H18 in the
6–9µm region has a strength of 50 km mol−1(Candian2012)
com-pared with 191 km mol−1for the solo-OOP mode, i.e. an intensity
ratio of 0.3. The effect of the radiative cascade during the PAH emission will reduce this ratio even more. Also, the 6–9µm region is generally attributed to ionized PAHs, which show very strong C–C and C–H in plane stretching modes, compared to their neutral counterparts (Hudgins & Allamandola 1999). As for the 3.3µm band, it is known that DFT calculations overestimate the intensity of the C–H stretching modes (Langhoff1996), making it difficult to directly compare our model with the astronomical spectra.
6.4 Emission in the 11.0µm region
6.4.1 Emission in the 11.0µm region – a summary
Given the proximity of 11.0µm emission to the 11.2µm band, we review here whether there is significant evidence for a related ori-gin. Roche, Aitken & Smith (1991) first identified a faint feature on the short-wavelength side of the 11.2µm band which appears quite prominently in spectra of a number of objects (Hony et al.
Figure 9. Emission model in the fingerprint region for the astronomical objects as in Fig.6. A scaling factor of 0.979 and a fixed FWHM of 12 cm−1
were applied. To combine the fit for the 11.0–11.2µm band complex and the remaining bands in the fingerprint region, the molecular contribution for the solo mode in a PAH was assumed to be a Lorentzian function peaking at the scaled (sf=0.979) DFT frequency and with FWHM of 10 cm−1.
2001). The most commonly occurring band has an approximately symmetric shape centred at 11.05µm, a rather narrow FWHM of 0.1µm and an intensity which ranges between 2 and 10 per cent of the 11.2µm feature. In a few cases a somewhat higher 11.0/11.2 ratio is found: two Herbig Ae/Be stars, MWC 1080 (Sakon et al. 2007), and HD 37411 (Boersma et al. 2008), in the HII region
Emission features in the 11.0µm region have been described as ‘blue outliers’ of the 11.2µm band by Sloan et al. (1999). On in-creasing distance from the hot star SVS3 it was found that a shorter wavelength part at∼10.8µm disappeared first, whereas∼11.0µm emission was more persistent. Using the results of theoretical calcu-lations by Langhoff (1996), Sloan et al. (1999) considered whether the ‘11.0µm’ emission might be due to neutral acenes, such as anthracene or pentacene, but following comparison with IR matrix data they concluded that this was unlikely and PAH cations were preferred as carriers. Hudgins & Allamandola (1999) discussed this in some detail and extended consideration across the 11–14µm region. The idea of a cationic origin gained support from DFT calculations on large solo-containing PAHs (Bauschlicher et al. 2008; Ricca et al.2012) where the (scaled) solo wavelengths for the cations were found to fall to wavelengths shorter than that for neutrals. Werner et al. (2004b) and Sakon et al. (2007) found that thec.11.0µm emission reduces in intensity moving away from the exciting star in NGC 7023 and MWC 1080, respectively, a result for NGC 7023 recently reinforced bySpitzerobservations (Boersma et al.2013).
The most commonly discussed carrier of thec.11.0µm emission carrier is PAH cations. However, Povich et al. (2007) observed a lack of variation in the shape and/or intensity of the 11.0µm band in the photodissociation region M17-SW, even where the level of the ionization in the gas varied with position. Moreover, in recent work on the evolution of the 11.2 and 11.0µm features SE of the Orion Bright Bar (Boersma et al.2012), the integrated strength of the main 11.2µm feature dropped by a factor of 5.7 between 2.6 and 5.7 arcmin whereas the 11.0µm feature dropped by a factor of 2.7. This result was described as ‘counterintuitive’ in terms of the 11.0µm emission being due to PAH cations but rationalized as being influenced by the degree of hydrogenation. In a recentSpitzer
study of the mid-IR structure of the massive star formation region W49A further puzzles have emerged; the 11.0/11.2 ratio is found to be constant across the whole region and with a very low value of∼0.01 (Stock et al.2014). The ratio is more commonly in the range 0.02–0.2 as discussed by Stock et al. (2014). In a recent study fitting the spectrum of NGC 7023 with the NASA AMES PAH data base; Boersma et al. (2013) noted that the 11.0µm band could be reproduced by ionized nitrogen-containing PAHs. In summary there are many questions as to the origin(s) of feature(s) in the 11.0µm region.
6.4.2 RR emission in the 11.0µm region
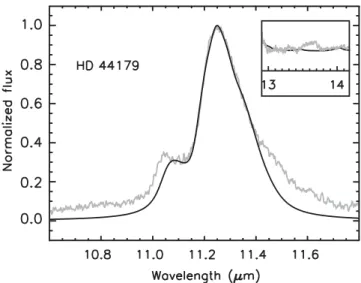
It was inferred earlier that the RR has a population of lower mass PAHs than for Orion H2S1 and NGC 7027 (Section 6.1), so it is of interest to explore whether low-mass PAHs including acenes might contribute to the 11.0µm region in this object. It is notable that DFT calculations predict an asymptotic wavelength for the longer acenes which falls at a shorter wavelength than the 11.2µm band (Section 3.2). We have conducted a Model 2-type calculation in-cluding acenes which yields the result shown in Fig.10. The fit to the 11.0µm region is improved and the 11.2µm profile is not affected, suggesting that, at least for this object, the acene series may make a significant contribution to 11.0µm emission. The lack of a very good fit between the 11.0µm feature and larger acenes may be due to the underestimation of the frequency of the OOP solo mode transition for these molecules. We are exploring this fur-ther by undertaking DFT calculations which include anharmonicity explicitly.
Figure 10. Comparison between modelled and astronomical spectrum of the Red Rectangle (grey line) for the 11.0–11.2µm band complex. The fit takes into consideration the four large PAHs plus pentacene, hexacene, and heptacene. The width for the contribution is fixed at 8 cm−1for acenes and
as in Model 2 for large PAHs. The value of the low mass to high mass ratio of 3.7:1 deduced in Section 6.1 is changed by less than 10 per cent on including acenes in the mode. The inset shows a comparison between the contribution of quarto OOP bending modes in acenes and the Red Rectangle spectrum (grey line) around 13.5µm. The contribution is fitted using the constraints described in Section 6.3.
The IR vibrational spectrum of neutral, long acenes is dominated by strong C–H OOP modes (solo and quarto; Pathak & Rastogi 2005). We therefore checked the contribution of the acene quarto modes by modelling them (Model 2) and compared the result with the emission in the RR (Fig.10, small insert). Clearly, the prediction is consistent with the astronomical spectrum. The overall result that the RR has a population of relatively low mass PAHs may be of significance in determining the origin of the strong unidentified optical emission bands seen in this object (Warren-Smith, Scarrott & Murdin1981).
7 C O N C L U S I O N S
Based on the results of DFT calculations, we created a detailed emission model and applied it to a small set of PAH molecules with the aim of understanding profile and profile variations in the 11.2µm band.
The model shows that the 11.2µm feature, regardless of the A/B classification, can be fitted by a mass distribution of a few, large neutral PAHs containing solo hydrogens. We infer that the mass dis-tribution is principally responsible for the red tail of the feature and the steep short-wavelength side, and hence offers a good explana-tion for the 11.2-µm band asymmetry and its variation between and within objects. In this picture, large neutral solo-containing PAHs dominate class A11.2objects and smaller PAHs class B11.2objects,
whereas class A(B)11.2possesses a more even mass distribution. We
In this paper, we described the results of a detailed emission model applied to the solo mode in PAHs and compared them to astronomical data. Based on the results we find that the profile of the 11.2µm band and its variation are well described principally in terms of the mass distribution of neutral solo-containing PAHs.
AC K N OW L E D G E M E N T S
We thank Dr Amit Pathak for useful discussions, Dr Christine Joblin for unpublished information on the temperature dependence of the ovalene spectrum, and Dr Jesse Bregman for very helpful comments. AC acknowledges STFC for a studentship and The University of Nottingham and the Royal Astronomical Society for financial sup-port. PJS thanks the Leverhulme Trust for award of a Research Fellowship and the Leiden Observatory for hospitality that allowed completion of this work. All quantum chemical calculations were performed using the University of Nottingham High Performance Computing Facility.ISOis an ESA project with instruments funded by ESA Member States (especially the PI countries: France, Ger-many, the Netherlands, and the UK) and with the participation of ISAS and NASA.
R E F E R E N C E S
Barker J. R., Allamandola L. J., Tielens A. G. G. M., 1987, ApJ, 315, L61 Bauschlicher C. W., Peeters E., Allamandola L. J., 2008, ApJ, 678, 316 Bauschlicher C. W., Peeters E., Allamandola L. J., 2009, ApJ, 697, 311 Bauschlicher C. W. et al., 2010, ApJ, 189, 341
Becke A. D., 1993, J. Chem. Phys., 98, 5648
Beegle L. W., Wdowiak T. J., Harrison J. G., 2001, Spectrochim. Acta A, 57, 737
Beintema D. A. et al., 1996, A&A, 315, L369 Bern´e O. et al., 2007, A&A, 469, 575
Boersma C., Bouwman J., Lahuis F., van Kerckhoven C., Tielens A. G. G. M., Waters L. B. F. M., Henning T., 2008, A&A, 484, 241
Boersma C., Rubin R. H., Allamandola L. J., 2012, ApJ, 753, 168 Boersma C., Bregman J. D., Allamandola L. J., 2013, ApJ, 769, 117 Boersma C. et al., 2014, ApJS, 211, 8
Bujarrabal V., Castro-Carrizo A., Alcolea J., S´anchez Contreras C., 2001, A&A, 377, 868
Califano S., 1962, J. Chem. Phys., 36, 903
Cami J., 2011, in Joblin C., Tielens A. G. G. M., eds, EAS Publ. Ser. Vol. 46, PAHs and the Universe. EDP Sciences, Les Ulis, p. 117
Cami J., Bernard-Salas J., Peeters E., Malek S. E., 2010, Science, 329, 1180 Candian A., 2012, PhD thesis, Univ. Nottingham
Candian A., Kerr T. H., Song I.-O., McCombie J., Sarre P. J., 2012, MNRAS, 426, 389
Candian A., Sarre P. J., Tielens A. G. G. M., 2014, ApJ, 791, L10 Can´e E., Miani A., Palmieri P., Tarroni R., Trombetti A., 1997, J. Chem.
Phys., 106, 9004
Cook D. J., Saykally R. J., 1998, ApJ, 493, 793 de Grauuw T. et al., 1996, A&A, 315, L49
Frisch M. J. et al., 2004, Gaussian 03. Gaussian, Inc., Wallingford, CT Geballe T. R., Lacy J. H., Persson S. E., McGregor P. J., Soifer B. T., 1985,
ApJ, 292, 500
Gillett F. C., Forrest W. J., Merrill K. M., 1973, ApJ, 183, 87
Hammonds M., Candian A., Sarre P. J., 2011, in Joblin C., Tielens A. G. G. M., eds, EAS Publ. Ser. Vol. 46, PAHs and the Universe. EDP Sciences, Les Ulis, p. 191
Hony S., Van Kerckhoven C., Peeters E., Tielens A. G. G. M., Hudgins D. M., Allamandola L. J., 2001, A&A, 370, 1030
Hudgins D. M., Allamndola L. J., 1999, ApJ, 516, L41
Hudgins D. M., Sandford S. A., 1998, J. Phys. Chem. A, 102, 329 Hudgins D. M., Bauschlicher C. W., Jr, Allamandola L. J., 2001,
Spec-trochim. Acta A, 57, 907
Joblin C., d’Hendecourt L., L´eger A., D´efourneau D., 1994, A&A, 281, 923 Joblin C., Boissel P., L´eger A., d’Hendecourt L., D´efourneau D., 1995,
A&A, 299, 835
Keller L. D. et al., 2008, ApJ, 684, 411
Knorke H., Langer J., Oomens J., Dopfer O., 2009, ApJ, 706, L66 Langhoff S., 1996, J. Phys. Chem., 100, 2819
Le Page V., Snow T. P., Bierbaum V. M., 2001, ApJ, 132, 233 L´eger A., d’Hendecourt L., Defourneau D., 1989, A&A, 216, 148 Malloci G., Joblin C., Mulas G., 2007, A&A, 332, 353
Matsuura M. et al., 2014, MNRAS, 439, 1472
Men’shchikov A. B., Schertl D., Tuthill P. G., Weigelt G., Yungelson L. R., 2002, A&A, 393, 867
Mulas G., Malloci G., Joblin C., Toublanc D., 2006, A&A, 446, 537 Murakami H. et al., 2007, PASJ, 59, S369
NIST MS Data Center /S. E. Stein 2011, in Linstrom P. J., Mallard W. G., eds, NIST Chemistry WebBook: Infrared Spectra. NIST Standard Reference Database Number 69. National Institute of Standards and Technology, Gaithersburg MD, available at:http://webbook.nist.gov
O’Dell C. R., 2001, ARA&A, 39, 99
Pathak A., Rastogi S., 2005, Chem. Phys., 313, 133 Pathak A., Rastogi S., 2006, Chem. Phys., 326, 315 Pathak A., Rastogi S., 2008, A&A, 485, 735 Pech C., Joblin C., Boissel P., 2002, A&A, 388, 639 Povich M. et al., 2007, ApJ, 660, 346
Rapacioli M., Calvo F., Joblin C., Parneix P., Toublanc D., Spiegelman F., 2006, A&A, 460, 519
Ricca A., Bauschlicher C. W., Allamandola L. J., 2011, ApJ, 727, 128 Ricca A., Bauschlicher C. W., Boersma C., Tielens A. G. G. M., Allamandola
L. J., 2012, ApJ, 754, 75
Ricks A. M., Douberly G. E., Duncan M. A., 2009, ApJ, 702, 301 Roche P. F., Aitken D. K., Smith C. H., 1989, MNRAS, 236, 485 Roche P. F., Aitken D. K., Smith C. H., 1991, MNRAS, 252, 282 Roelfsema P. R. et al., 1996, A&A, 315, L289
Rosenberg M. J. F., Bern´e O., Boersma C., Allamandola L. J., Tielens A. G. G. M., 2011, A&A, 532, A128
Rosenberg M. J. F., Bern´e O., Boersma C., Allamandola L. J., Tielens A. G. G. M., 2012, A&A, 537, C5
Sakon I., Okamoto Y. K., Kataza H., Onaka T., Kaneda H., Honda M., 2007, Adv. Geosci. WSPC, 7, 146
Sandford S. A., Bernstein M. P., Materese C. K., 2013, ApJS, 205, 8 Schutte W. A., Tielens A. G. G. M., Allamandola L. J., 1993, ApJ, 415, 397 Sellgren K., Werner M. W., Ingalls J. G., Smith J. D. T., Carleton T. M.,
Joblin C., 2010, ApJ, 722, L54
Semmler J., Yang P. W., Crawford G. E., 1991, Vib. Spectrosc., 2, 189 Shao Y. et al., 2006, Phys. Chem. Chem. Phys., 8, 3172
Sloan G. C., Hayward T. L., Allamandola L. J., Bregman J. D., Devito B., Hudgins D. M., 1999, ApJ, 513, L65
Sloan G. C. et al., 2007, ApJ, 664, 1144
Stephens P. J., Devlin F. J., Chabalowski C. F., Frisch M. J., 1994, J. Phys. Chem., 45, 11623
Stock D. J., Peeters E., Choi W. D.-Y., Shannon M. J., 2014, ApJ, 791, 99 Tielens A. G. G. M., 2008, ARA&A, 46, 289
van Diedenhoven B., Peeters E., Van Kerckhoven C., Hony S., Hudgins D. M., Allamandola L. J., Tielens A. G. G. M., 2004, ApJ, 611, 928 Verstraete L., Puget J. L., Falgarone E., Drapatz S., Wright C. M.,
Timmer-mann R., 2001, A&A, 372, 981
Wada S., Onaka T., Yamamura I., Murata Y., Tokunaga A. T., 2003, A&A, 407, 551
Warren-Smith R. F., Scarrott S. M., Murdin P., 1981, Nature, 292, 317 Werner M. W. et al., 2004a, ApJS, 154, 10
Werner M. W., Uchida K. I., Sellgren K., Marengo M., Gordon K. D., Morris P. W., Houck J. R., Stansberry J. A., 2004b, ApJS, 154, 309
Witteborn F. C., Sandford S. A., Bregman J. D., Allamandola L. J., Cohen M., Wooden D. H., Graps A. L., 1989, ApJ, 341, 270
Zhang Y., Kwok S., Hrivnak B. J., 2010, ApJ, 725, 990