arXiv:1801.08140v1 [astro-ph.GA] 24 Jan 2018
An ALMA view of star formation efficiency suppression in
early-type galaxies after gas-rich minor mergers
Freeke van de Voort,
1,2,3,4⋆Timothy A. Davis,
5Satoki Matsushita,
2Kate Rowlands,
6Stanislav S. Shabala,
7James R. Allison,
8,9Yuan-Sen Ting,
10,11,12Anne E. Sansom
13and Paul P. van der Werf
141Heidelberg Institute for Theoretical Studies, Schloss-Wolfsbrunnenweg 35, 69118, Heidelberg, Germany
2Academia Sinica Institute of Astronomy and Astrophysics, P.O. Box 23-141, Taipei 10617, Taiwan
3Department of Astronomy and Theoretical Astrophysics Center, University of California, Berkeley, CA 94720-3411, USA
4Astronomy Department, Yale University, P.O. Box 208101, New Haven, CT 06520-8101, USA
5School of Physics & Astronomy, Cardiff University, Queens Buildings, The Parade, Cardiff, CF24 3AA, UK
6Department of Physics & Astronomy, Johns Hopkins University, Bloomberg Center, 3400 N. Charles St., Baltimore, MD 21218,
USA
7School of Natural Sciences, University of Tasmania, Private Bag 37, Hobart, Tasmania 7001, Australia
8Sydney Institute for Astronomy, School of Physics A28, The University of Sydney, NSW 2006, Australia
9ARC Centre of Excellence for All Sky Astrophysics in 3 Dimensions (ASTRO 3D)
10Institute for Advanced Study, Princeton, NJ 08540, USA
11Department of Astrophysical Sciences, Princeton University, Princeton, NJ 08544, USA
12Observatories of the Carnegie Institution of Washington, 813 Santa Barbara Street, Pasadena, CA 91101, USA
13Jeremiah Horrocks Institute, University of Central Lancashire, Preston, Lancashire, PR1 2HE, UK
14Leiden Observatory, Leiden University, P.O. Box 9513, NL-2300 RA Leiden, the Netherlands
Accepted 2018 January 24. Received 2018 January 23; in original form 2017 December 21
ABSTRACT
Gas-rich minor mergers contribute significantly to the gas reservoir of early-type galaxies (ETGs) at low redshift, yet the star formation efficiency (SFE; the star for-mation rate divided by the molecular gas mass) appears to be strongly suppressed following some of these events, in contrast to the more well-known merger-driven star-bursts. We present observations with the Atacama Large Millimeter/submillimeter Array (ALMA) of six ETGs, which have each recently undergone a gas-rich minor merger, as evidenced by their disturbed stellar morphologies. These galaxies were se-lected because they exhibit extremely low SFEs. We use the resolving power of ALMA to study the morphology and kinematics of the molecular gas. The majority of our galaxies exhibit spatial and kinematical irregularities, such as detached gas clouds, warps, and other asymmetries. These asymmetries support the interpretation that the suppression of the SFE is caused by dynamical effects stabilizing the gas against grav-itational collapse. Through kinematic modelling we derive high velocity dispersions and Toomre Qstability parameters for the gas, but caution that such measurements in edge-on galaxies suffer from degeneracies. We estimate merger ages to be about 100 Myr based on the observed disturbances in the gas distribution. Furthermore, we determine that these galaxies lie, on average, two orders of magnitude below the Kennicutt-Schmidt relation for star-forming galaxies as well as below the relation for relaxed ETGs. We discuss potential dynamical processes responsible for this strong suppression of star formation surface density at fixed molecular gas surface density.
Key words: galaxies: formation – galaxies: evolution – galaxies: star formation – galaxies: ISM – galaxies: elliptical and lenticular, cD – galaxies: kinematics and dynamics
⋆ E-mail: [email protected]
1 INTRODUCTION
as-sembly of galaxies. Galaxy mergers are capable of inducing strong star formation, fuelling black hole growth, and pre-cipitating morphological transformations, such as the for-mation of bulges (e.g.Sanders et al. 1988;Hernquist 1993;
Springel et al. 2005). Merger events are often divided into two categories: major mergers with mass ratios larger than 1 : 4 and minor mergers with mass ratios below 1 : 4. Each of these can be either gas-rich (‘wet’) or gas-poor (‘dry’). Gas-poor mergers are thought to be responsible for both morphological transformation and the build-up of the mass and size of early-type galaxies (ETGs) since z ≈ 2 (e.g.
Naab et al. 2009;van Dokkum et al. 2010). Gas-rich major mergers are usually associated with strong starbursts with extreme star formation rates (SFRs; e.g.Sanders et al. 1988;
Barnes & Hernquist 1991).
The star formation efficiency (SFE) is here defined as the amount of star formation per unit molecular gas and defined as
SFE = SFR/MH2, (1)
whereMH2is the molecular gas mass. The SFE is the inverse of the gas depletion time, which can be as low as 107 yr
in extreme starburst galaxies (e.g. Gao & Solomon 2004). This unusually efficient star formation is usually explained by the dissipative collapse of the gas to the galaxy centre following a gas-rich major merger. The presence of a pre-existing interstellar medium (ISM) in spiral galaxies causes strong shocks when the gas in the two galaxies collide. These shocks and angular momentum loss drive the gas densities up and result in a nuclear starburst (e.g.Mihos & Hernquist 1996).
The effect of gas-rich minor mergers on the star formation in galaxies has not been quantified as thor-oughly. Minor mergers are less violent events, but these too might be expected to increase the SFR and/or SFE (e.g.
Mihos & Hernquist 1994; Saintonge et al. 2012). Kaviraj
(2014) found that minor mergers play an important role in the low-redshift universe, where about 40 per cent of star for-mation in local spiral galaxies is induced by minor mergers. Such events also dominate the star formation budget in mas-sive early-type systems, where they likely provide the vast majority of the star-forming gas (e.g. Kaviraj et al. 2009;
Davis et al. 2011).
This work is an extension of that by Kaviraj et al.
(2012) and Kaviraj et al.(2013), who selected a sample of recent minor merger remnants, based on their disturbed op-tical morphologies. In these recently merged galaxies, the major partner was a gas-poor ETG and the minor partner was a gas-rich dwarf. The median merger mass ratio was es-timated to be 1:40, based on gas-to-dust ratios (Davis et al. 2015). The resulting systems are very gas- and dust-rich compared to undisturbed ETGs and have a sizeable molec-ular gas component (MH2>109M
⊙). Contrary to
expecta-tions, these coalesced systems do not host strong starbursts. The absence of strong merger-induced shocks, due to the gas-poor nature of the original host galaxy, may be respon-sible for this. More surprising is that the SFE was found to be suppressed by orders of magnitude, with gas depletion times that exceed the Hubble time.
The physical process that is suppressing star formation in these minor merger systems is not yet understood. Clearly such objects do not fit within a framework where the SFE
is constant (e.g. Bigiel et al. 2011) or one where mergers boost the efficiency of star formation (e.g.Genzel et al. 2010;
Daddi et al. 2010;Saintonge et al. 2012). ETGs have previ-ously been found to have somewhat lower SFE than late-type systems (e.g.Saintonge et al. 2012;Davis et al. 2014).
Martig et al.(2009) found that this may be caused by gas stability in a spheroidal potential well. This could also be the reason why the star formation rate is less enhanced af-ter minor mergers in galaxies with more prominent bulges (Kaviraj 2014). The recent minor merger systems studied in
Davis et al.(2015) and in this work, however, have an order of magnitude greater suppression of the SFE and larger gas fractions than seen in relaxed ETGs. Gas stabilization due to the shape of the potential is therefore unlikely to be the reason for the low SFEs, at least in these extreme objects.
Star formation is a dynamical process. The cold, dense gas in galaxies follows a turbulent cascade down to the smallest scales, where it fragments and eventually forms stars. Various dynamical and environmental processes can work to suppress this cascade and affect the resulting SFE.
Davis et al. (2015) suggested that these objects may have been caught at a very specific phase in their evolution, when gas is still free-streaming towards the galaxy centre, but has not yet settled. Such streaming motions have been shown to suppress the efficiency of star formation (e.g.Meidt et al. 2013). In this scenario, the gas-free nature of the early-type progenitor explains why star formation suppression after mi-nor mergers has not been observed in other systems.
This explanation is not unique, however. Shear in-duced by rotation can prevent the gravitational collapse of gas clouds or pull them apart, suppressing star forma-tion (Toomre 1964;Seigar 2005). Additionally, gravitational heating, i.e. conversion of potential energy to thermal en-ergy during a merger, can deposit enen-ergy into the gas via weak shocks (e.g.Johansson et al. 2009). Such energy could stall gravitational collapse and suppress star formation. Al-ternatively, although no evidence for strong nuclear activity has been found in these objects (Shabala et al. 2012), ac-tive galactic nuclei (AGN) are also expected to be triggered by mergers (Kaviraj et al. 2015). Therefore, nascent feed-back from a central black hole may be acting to suppress star formation. Determining which, if any, of these processes are acting to suppress star formation in ETGs after a mi-nor merger will allow us to understand its importance for merger-driven star formation in all types of galaxies.
In this paper we present results based on new observa-tions with the Atacama Large Millimeter/submillimeter Ar-ray (ALMA) of six minor merger remnants fromDavis et al.
(2015). We selected those objects with the most suppressed SFEs (below 10−10 yr−1). Their depletion times are above
10 Gyr, longer than those of ‘normal’ ETGs, such as those in the ATLAS3Dsample (Davis et al. 2014), by a factor of
three. They have typical stellar masses of about 1011 M
⊙,
with molecular gas fractions between 1 and 25 per cent. In Section2we describe the targeted galaxies and the ALMA observations. In Section3we show the resolved ISM morphologies and velocity structures, which often exhibit clear disturbances, and present results from our kinematic modelling. We discuss which process is likely responsible for the low SFEs and conclude in Section 4. In this work, we assume a cosmology with H0 = 71 km s−1 Mpc−1, Ω
m =
2 OBSERVATIONS
2.1 Sample
The galaxies targeted in this study were originally se-lected from the Sloan Digital Sky Survey (SDSS) pho-tometry by Kaviraj et al. (2012) as part of the Galaxy Zoo project (Lintott et al. 2008). The objects are massive, bulge-dominated galaxies with large dust lanes obscuring part of the optical light. The parent sample selected the most dust-rich objects using 250µm luminosities observed with the Herschel Space Telescope (Kaviraj et al. 2013). From the galaxies observable from ALMA’s location, we se-lected the six galaxies with the lowest SFEs based on pre-vious Institut de Radioastronomie Millim´etrique (IRAM) 30 m data (Davis et al. 2015). Three-colour (66×66 kpc2)
images of our six targets are shown in Figure 1, us-ing the Dark Energy Camera Legacy Survey (DECaLS;
Dark Energy Survey Collaboration et al. 2016; in bands
grz), when available, and from SDSS (Abazajian et al. 2009; in bandsgri) for galaxies NGC4797 and 2MASXJ1333. Be-sides the clear dust lanes, indicating the likely presence of edge-on gas discs, some of the images also reveal clear dis-turbances of the stellar light in the outskirts of the galaxies, which point to recent minor merger events (seeKaviraj et al. 2012).
The properties of our target galaxies are taken from
Davis et al. (2015) and presented in Table 1. The source name, redshift, luminosity distance, stellar mass, SFR, SFE, and conversion factor from arcsec to kpc are listed for each source. The SFRs are derived by modelling the spectral en-ergy distribution from the ultraviolet to the far-infrared with energy-balance code magphys (da Cunha et al. 2008) and therefore typically sensitive to timescales of approximately 100 Myr (Kennicutt & Evans 2012). The errors on the SFE are unfortunately fairly large and the SFEs of the six galax-ies are consistent with each other within 2σ. We therefore do not expect to find strong trends with SFE within our sample.
2.2 ALMA data
We observed the12CO(1–0) line in our six dust lane ETGs
with ALMA, as part of programme 2015.1.00320.S. ALMA’s 12 m antennas were used in a compact configuration, result-ing in an approximately 1′′beam and sensitivity to emission
on scales up to≈30−40′′. A 1850 MHz correlator window
was placed over the CO(1–0) line, yielding a continuous ve-locity coverage of about 1600 km s−1 with a raw velocity
resolution of ≈ 1.0 km s−1. This is sufficient to properly
cover and sample the line. Three additional 2 GHz wide low-resolution correlator windows were simultaneously used to potentially detect continuum emission (see Section2.4).
The raw ALMA data were calibrated using the stan-dard ALMA pipeline, provided by the ALMA regional centre staff. We then used the Common Astronomy Software Ap-plications (casa) package to image the resulting visibility files for each track, producing a three-dimensional RA-Dec-velocity data cube (with velocities determined with respect to the rest frequency of the 12CO(1–0) line). In this work
we bin the raw data to a channel width of 10 km s−1 and use pixels of 0.3′′ (giving us approximately 4 pixels across
the synthesized beam).
The data presented here were produced using Briggs weighting with a robust parameter of 0.5. We attempted to detect continuum emission from these sources over the full line-free bandwidth. If present, we subtracted the contin-uum from the line data in the uv plane using the casa task uvcontsub. The continuum-subtracted dirty cubes were cleaned in regions of source emission (identified in-teractively) to a threshold equal to the root-mean-square (RMS) noise of the dirty channels. The clean components were then re-convolved using a Gaussian beam of full-width at half-maximum (FWHM) equal to that of the dirty beam. Finally, the residuals were added back into the clean compo-nents. This produced the final, reduced, and fully calibrated
12CO(1–0) data cubes.
The molecular masses used here assume a GalacticXCO
factor, which quantifies the conversion between CO inte-grated line flux and H2mass. However,XCOhas been shown
to vary with metallicity (see Bolatto et al. 2013 for a re-view). We unfortunately do not have an independent mea-sure of the gas-phase metallicity in our galaxies, which may be sub-solar. We could therefore be underestimating the amount of molecular gas present in these systems, possibly by an order of magnitude (Leroy et al. 2007). This would only reduce the SFEs even further and make our targets even more extreme objects.
2.3 Line detections
Table2summarizes our observational parameters. For each source, we list its full name (taken from the NASA/IPAC Extragalactic Database1), the dates the galaxies were
ob-served, the total integration time, the calibrator sources used (for the amplitude, bandpass, and phase), the beam size, and the RMS noise reached in 10 km s−1 channels.
The data quality and precision are sufficient to resolve the spatial structure of the molecular ISM and its line-of-sight velocity in all of our target galaxies using the CO(1-0) line. No other lines were detected. We use these data to detect and quantify morphological and kinematic disturbances in the gas in Section3.
2.4 Continuum detections and upper limits
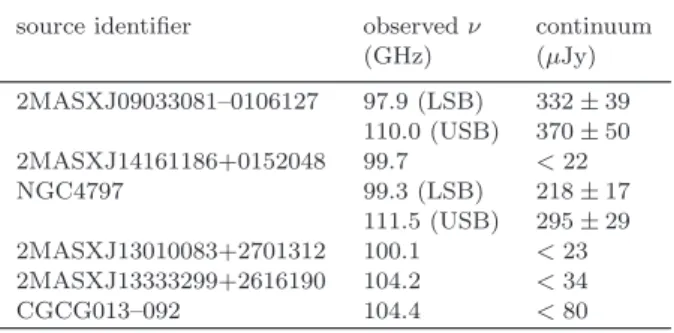
Although the focus of this work is on the molecular gas, we attempted to detect continuum emission as well. Table3
summarizes our findings and lists, for each source, our mea-surement or upper limit of the 3 mm continuum flux (right column) and the frequency at which this was observed (mid-dle column). In case of a detection, we list the flux from the upper and lower side band (USB and LSB) separately, but combined them for our upper limits. We detected the continuum for galaxies 2MASXJ0903 and CGCG013–092 (≈300µJy), which are both point sources at 3 mm. By com-paring to the far-infrared fluxes fromRowlands et al.(2012), we interpret this emission as arising from the Rayleigh-Jeans tail of the dust emission. We do not discuss this further here, because this is beyond the scope of this work. The lack of synchrotron-dominated spectra at 3 mm (non-detections or
CGCG013-092 2MASXJ1301
2MASXJ0903 2MASXJ1416
2MASXJ1333
NGC4797
Figure 1. Three-colour imaging of our target sources at fixed spatial scale of 66×66 kpc2 from DECaLS (grz), when available, and from SDSS (gri) for galaxies NGC4797 and 2MASXJ1333. Each panel is labelled with (a shortened version of) the source name. The dust lanes are clearly visible for all galaxies and are almost edge-on. Disturbances in the stellar light are also visible in certain panels, providing evidence for a recent minor merger.
Table 1.Properties of our selected galaxies: source identifier, redshift, angular diameter distance, stellar mass, SFR, SFE, and conversion factor from arcsec to kpc. The errors given are 1σerrors on the measurements.
source identifier z DL Mstar MH2 SFR SFE conversion
(Mpc) (M⊙) (M⊙) (M⊙yr−1) (yr−1) (kpc/′′)
2MASXJ09033081–0106127 0.040 161 1010.9±0.1 109.64±0.07 0.09+0.05
−0.01 (2.06 +1.19
−0.40)×10
−11 0.78 2MASXJ14161186+0152048 0.082 315 1011.2±0.1 109.89±0.11 0.02+0.06
−0.01 (2.58 +7.77
−1.45)×10
−12 1.53 NGC4797 0.026 106 1011.2±0.1 109.17±0.08 0.03+0.03
−0.01 (2.03 +2.06
−0.77)×10
−11 0.52 2MASXJ13010083+2701312 0.078 301 1010.9±0.1 1010.31±0.05 0.44+0.44
−0.37 (2.16 +2.17
−1.83)×10−11 1.46 2MASXJ13333299+2616190 0.037 150 1010.8±0.1 109.71±0.05 0.01+0.06
−0.01 (1.95 +11.70
−1.95 )×10−12 0.73 CGCG013–092 0.035 142 1010.9±0.1 109.84±0.04 0.28+0.06
−0.04 (4.05 +0.94
−0.69)×10−11 0.69
Table 2.Parameters for our ALMA observations: source identifier, date of observation, total observation time, amplitude calibrator, bandpass calibrator, phase calibrator, beam size, and RMS noise in 10 km s−1 channels of each source.
source identifier obs. date tobs amplitude bandpass phase θbeam RMS
(mins) calibrator calibrator calibrator (′′) (mJy beam−1) 2MASXJ09033081–0106127 2016-03-19 29.36 J0750+1231 J0854+2006 J0909+0121 1.91×1.32 0.9 2MASXJ14161186+0152048 2016-04-09 47.35 Ganymede J1337-1257 J1410+0203 1.78×1.46 0.8
NGC4797 2016-03-21 62.73 Callisto J1229+0203 J1303+2433 1.80×1.35 1.0
2MASXJ13010083+2701312 2016-05-04 29.86 Callisto J1229+0203 J1303+2433 2.05×1.29 1.1 2MASXJ13333299+2616190 2016-05-04 27.15 J1256-0547 J1229+0203 J1333+2725 2.35×1.03 1.5
Table 3.Continuum detections or upper limits: source identifier, observed frequency, and 3 mm continuum flux (or 3σupper limit) of each source. In case of a detection, we analyze the upper and lower sideband (USB and LSB) seperately.
source identifier observedν continuum
(GHz) (µJy)
2MASXJ09033081–0106127 97.9 (LSB) 332±39 110.0 (USB) 370±50 2MASXJ14161186+0152048 99.7 <22
NGC4797 99.3 (LSB) 218±17
111.5 (USB) 295±29 2MASXJ13010083+2701312 100.1 <23 2MASXJ13333299+2616190 104.2 <34
CGCG013–092 104.4 <80
a spectral slope inconsistent with synchrotron emission) ar-gues against the presence of strong AGN, but we cannot exclude low-luminosity AGN.
3 RESULTS
The aim of this work is to resolve the spatial and kinematic structure of the molecular gas in the selected dust lane ETGs in order to narrow down the cause of the suppression in their SFEs. Figure2therefore shows the new ALMA obser-vations of the six selected galaxies. Left and middle panels show CO(1-0) flux contours in orange, in the left panels combined with the SDSS r-band image in greyscale. The contours displayed range from 3 times the RMS level to the maximum value in 3 (left) or 19 (middle) linearly spaced increments. The right panels show the CO(1-0) line-of-sight velocity contours centred on the kinematic centre as deter-mined from their kinematic modelling (see Section3.1).
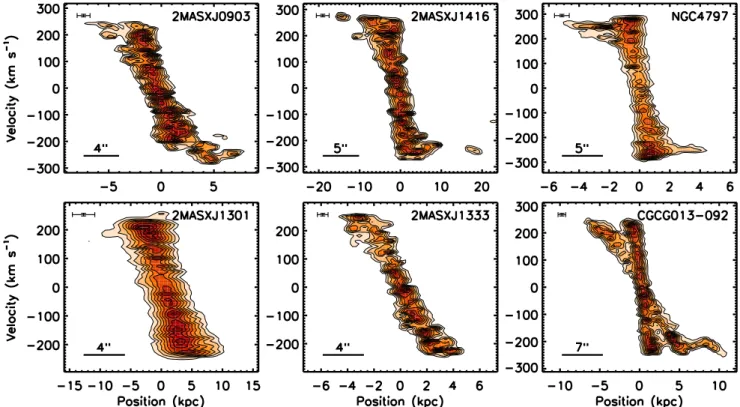
As expected, the gas is coincident with the dust lane seen in absorption against the stellar light, which means that both likely have the same origin. The images show that the majority of the galaxies’ molecular gas discs are asymmetri-cal. 2MASXJ1416 has detached gas clouds, the low-surface brightness emission extends further from the centre on one side of the disc in 2MASXJ0903 and CGCG013–092, and NGC4797 and 2MASXJ1301 exhibit a small warp in their centres (best seen by the tilt in the zero velocity contour in the velocity maps). Only galaxy 2MASXJ1333 shows no sign of asymmetries. The disturbed kinematics can also be identified in the position-velocity diagrams (see Figure 4). This provides visual evidence that the molecular gas is not completely relaxed. It also supports our conclusion that the gas was brought in by a gas-rich minor merger in the recent past.
It is interesting to compare the extent of the molecular gas in our sample to that of relaxed ETGs in the ATLAS3D
sample. We measure the radius of the relaxed gas disc by fitting a kinematic model to the data cube, which only re-produces the symmetric, undisturbed part (see Section3.1). The radius of the undisturbed gas is defined as the radius at which the model surface brightness falls below 10 M⊙pc−2,
which is the surface brightness limit used by Davis et al.
(2013). The total extent, including the morphologically and kinematically disturbed part, is measured directly from the
data, also using the surface brightness limit of 10 M⊙pc−2.
For the relaxed galaxies, the radius of the molecular gas disc normalized by the radius of the 25 mag arcsec2 isophote in theB band is RCO/R25 = 0.16 (Davis et al. 2013). Unsur-prisingly, the gas discs in our selected dust lane ETGs are more extended. For the undisturbed part of our gas discs, we find an averageRCO/R25 = 0.28 and if we include the disturbed gas this increases toRCO/R25= 0.53. This shows that our sample galaxies are extreme, not just in their total molecular gas mass, but also in the extent of their molecular gas.
In Figure3we compare our ALMA CO(1-0) flux mea-surements with those previously obtained with the IRAM 30 m telescope (Davis et al. 2015), showing the CO(1-0) flux as a function of velocity, where the centre is obtained from our kinematic modelling (see Section3.1). The ALMA spec-tra were made by exspec-tracting a rectangular region based on the images shown in Figure2, then summing the unclipped data cube spatially, and dividing by the beam area. Both observations show the typical double-horned spectrum of ro-tating galaxies. Our interferometric observations are similar to the single dish measurements. The total flux is consis-tent within uncertainties, which indicates that we are likely not resolving out any structure on large scales. The spectra of galaxies 2MASXJ0903, 2MASXJ1416, 2MASXJ1301, and CGCG013–092 have an asymmetric profile, reflecting their asymmetric morphologies.
To study the rotation curve of the molecular gas, Fig-ure4shows the major-axis position-velocity diagram of each of our target galaxies. This was created by extracting a slice from the cube at the estimated position angle, with a width of 5 pixels, which were then summed spatially. Contour lev-els are evenly spaced between 3 times the RMS level and the peak flux in 9 increments. The disturbed structures, previ-ously identified along the major axis in the images in Fig-ure2, can also be seen here. According to our best-fit kine-matic model (see Section3.1), they do not follow the general galaxy rotation curve, although accurate stellar photometry is needed to model the stellar mass and be absolutely cer-tain about this. 4 out of our 6 targets clearly show asym-metrical features at large radii – galaxies 2MASXJ0903, 2MASXJ1416, NGC4797, and CGCG013–092. The asym-metry of galaxy 2MASXJ1301 is more subtle, but can be identified by noticing that the emission extends from−8 kpc to +10 kpc. Galaxy 2MASXJ1333 is the only object for which, at the current resolution, all the detected molecu-lar gas seems to be part of a regumolecu-lar, relaxed gas disc.
A large fraction of the molecular gas is located in the rising part of the rotation curve. This is consistent with sam-ples of relaxed ETGs (from ATLAS3Dand EDGE-CALIFA),
which show that the SFE decreases as this fraction increases (Davis et al. 2014;Colombo et al. 2017). This could suggest that a dynamical effect, such as the higher shear rate in this region, acts to stabilize the gas against collapse. However, the dust lane ETGs have SFEs that are much lower than those in ATLAS3D, so this is likely not the dominant
mech-anism for our extreme SFE suppressed galaxies.
Figure 3.Spectra of the CO(1-0) data for all six galaxies with our new ALMA data shown in black and previously obtained (lower resolution) IRAM data in red. The flux detected in our new interferometric observations is similar to that from the previous single dish measurements. This means that we are likely capturing molecular gas structures on all important scales with ALMA.
ented along the major axis, we consider the most likely sce-nario that this gas is accreting.
3.1 Kinematic modelling
To learn more about the dynamical state of the gas and its physical parameters, we aim to construct kinematic models that reproduce our CO observations. In order to model the kinematics of the gas, we use a forward modelling approach. We assume that the gas is in a circularly symmetric disc and therefore do not try to model the asymmetrical features seen in Figure2and4. Because the disturbances are low sur-face density features, they do not strongly affect the model, which aims to reproduce the majority of the molecular gas (i.e. the central disc).
We used the KINematic Molecular Simulation (KinMS2) tool (Davis et al. 2013), with which we produce
mock observations of a theoretical gas distribution with the same beam, pixel size, and velocity resolution as our ALMA observations. We then compare the mock observations to the real data and explore the parameter range with the Markov Chain Monte Carlo (MCMC) code KinMS MCMC that couples to the KinMS routines in order to get the full Bayesian posterior probability distribution. This code fits the entire CO data cube produced by ALMA, rather than simply the position-velocity diagram shown in Figure4.
The mass budget in these ETGs is dominated by their stars. Due to the lack of sufficiently high resolution optical imaging, we model a galaxy’s rotation curve by assuming it follows an arctangent (e.g.Swinbank et al. 2012). We force the curve to reach its maximum faster by imposing
v=vcirc,flattan−1
R
rnorm
for tan−1 R
rnorm
<1
=vcirc,flat for tan−1
R
rnorm
>1,
(2)
wherevcirc,flatis the asymptotic (or maximum) circular
ve-locity in the flat part of the rotation curve,Ris the radius, and rnorm is the normalization radius. We fit vcirc,flat and rnormto best match the gas velocities. We repeated our kine-matic modelling based on available long-wavelength optical or near-infrared image (from SDSS or Spitzer) and found best fit values similar to those using the arctangent model and presented in Table4.
We furthermore fit the total flux, kinematic centre, sys-temic velocity, position angle, and inclination of the gas disc. We additionally fit a model of the gas surface bright-ness profile and gas velocity dispersion (assumed to be constant throughout the disc), in order to reproduce the bulk properties of the disc. For the galaxies 2MASXJ0903, 2MASXJ1416, NGC4797, and 2MASXJ1301, we find a rea-sonable fit by using an exponential gas surface brightness profile. This simple form has previously been shown to be appropriate in most ETGs (Davis et al. 2013) and provides a good match to the observed morphology and velocity of the gas in these objects. For galaxy 2MASXJ1333, however, we find that we additionally need an outer surface density cutoff in order to fit the data. Object CGCG013–092 clearly shows an X-shape in its position-velocity diagram, which is
2 https://github.com/TimothyADavis/KinMS
typical for molecular gas within a bar. We model this with a central ring and an outer exponential profile.
We use the derived centre, systemic velocity, and po-sition angle to centre the previous figures. With the de-rived velocity dispersion and gas profile, we try to estimate whether or not the observed gas discs are stable against gravitational collapse. In order to do this, we calculate the ToomreQparameter (Toomre 1964) by evaluating
Q= κσgas
πGΣgas
. (3)
Here, G is the gravitational constant, Σgas is the surface
density of the molecular gas, andκis the epicyclic frequency (i.e. the frequency at which a gas parcel will oscillate when radially displaced). The latter is calculated by
κ= r
4Ω2+RdΩ 2
dR, (4)
where R is the radius and Ω is the angular frequency Ω = vcirc/R, where vcirc is the circular velocity. A higher velocity dispersion means higher gas pressure stabilizing the disc against collapse. Here, we calculate κ from our best-fitting arctangent models.κthus depends on the potential, but does not include the effects of any streaming or non-circular motions.
Theoretically, the disc is expected to be unstable to per-turbations if Q . 1. However, star-forming galaxies have been found to haveQvalues above unity (e.g. Leroy et al. 2008;Romeo & Mogotsi 2017). Higher threshold values have therefore also been used in order to account for asymmet-ric perturbations not captured in the simple model. Such perturbations are likely present in our disturbed galaxies as well and we therefore caution the reader that Q by itself can probably not determine the stability of the disturbed gas discs.
Another problem is that the observed gas discs are nearly edge-on and our kinematic modelling therefore suf-fers from degeneracies due to non-circular rotation and beam smearing effects, although our modelling procedure attempts to take this into account. The derived velocity dispersion found is thus potentially a combination of the true velocity dispersion and the radial variation in velocities and may be spuriously high (Barth et al. 2016). We therefore consider our values upper limits to the true velocity dispersion of the gas.
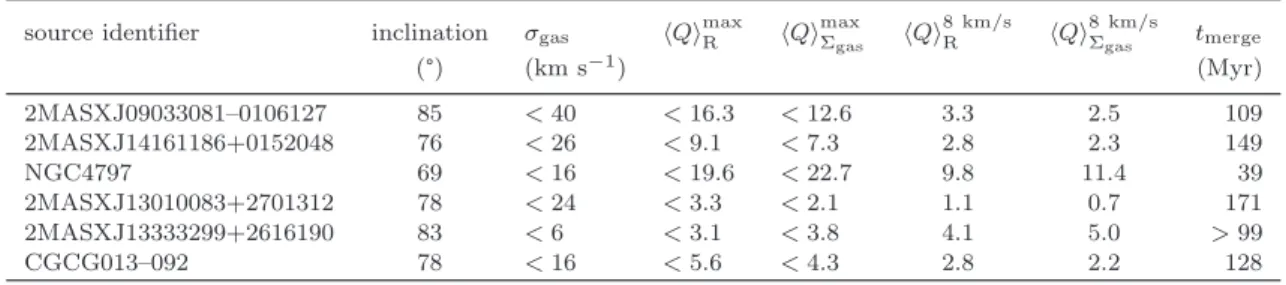
The results from our kinematic modelling are listed in Table4. The second and third column give the best fit value for the galaxies’ inclinations (with errors<3°) and velocity dispersions. The next four columns show the derived val-ues for Q based either on the best-fit velocity dispersions (fourth and fifth columns) or on a canonicalσgas= 8 km s−1
(sixth and seventh columns;Cald´u-Primo & Schruba 2016). The values given include both the radial averages (fourth and sixth columns) and the surface density-weighted aver-ages (fifth and seventh columns). The derived upper lim-its for the velocity dispersions are generally high, except for 2MASXJ1333. Even when assuming a canonical value of
σgas = 8 km s−1, we find that Q > 1 and therefore
Table 4.Resulting parameter values from the kinematic modelling: source identifier, inclination, gas velocity dispersion (upper limit), Toomre stability parameter based on modelledσgas and radially averaged, based on modelledσgas and gas surface density-weighted, based onσgas= 8 km s−1and radially averaged and based onσgas= 8 km s−1and surface density-weighted, inclination of the gas disc, and estimate for the merger age equal to three times the dynamical time at the radius out to which the gas is undisturbed.
source identifier inclination σgas hQimaxR hQimaxΣ gas hQi
8 km/s
R hQi
8 km/s
Σgas tmerge
(°) (km s−1) (Myr)
2MASXJ09033081–0106127 85 <40 <16.3 <12.6 3.3 2.5 109
2MASXJ14161186+0152048 76 <26 <9.1 <7.3 2.8 2.3 149
NGC4797 69 <16 <19.6 <22.7 9.8 11.4 39
2MASXJ13010083+2701312 78 <24 <3.3 <2.1 1.1 0.7 171
2MASXJ13333299+2616190 83 <6 <3.1 <3.8 4.1 5.0 >99
CGCG013–092 78 <16 <5.6 <4.3 2.8 2.2 128
The last column in Table 4lists the estimated merger age,tmerge, assumed to be equal to five times the dynamical time at the transition between the undisturbed disc (based on our modelling) and disturbed gas structures (measured at 3 times the RMS level). Because the gas inside this ra-dius appears to be relaxed, whereas the gas outside this radius is clearly not settled yet, this time can serve as a proxy for when the merger happened. This rough estimate is based on theoretical studies of the relaxation of misaligned gas discs in the potential of elliptical galaxies that found that the relaxation process typically takes a few dynami-cal times (tdyn;Tohline et al. 1982;Lake & Norman 1983). Specifically, Lake & Norman (1983) found that the relax-ation time, i.e. the time it takes a misaligned disc to settle into the plane, was approximatelytdyn/ǫ, whereǫis the ec-centricity of the potential. For a typical lenticular galaxy
ǫ≈0.2 (M´endez-Abreu et al. 2008), so we therefore assume
tmerge≈5tdyn. The true value oftmerge could also be higher if it takes more than five dynamical times for the gas to settle (van de Voort et al. 2015). Our merger ages are lower than the ages of the last starburst derived byKaviraj et al.(2012) from broadband optical colours. Galaxy 2MASXJ1333 has a lower limit fortmerge, because we found no disturbed gas structures in this object.
3.2 Kennicutt-Schmidt relation
Because we spatially resolve the gas disc in all our dust lane galaxies that recently experienced a gas-rich merger, we can compare them to the observed Kennicutt-Schmidt relation (Kennicutt 1998). Figure5 shows the relation be-tween SFR surface density, ΣSFR, and molecular gas surface
density, Σgasfor our six SFE suppressed ETGs (red symbols
with 1σ error bars) compared to galaxies in the literature. This is calculated by dividing the SFR andMH2 by the area
of the molecular gas disc. The black, solid line and grey shaded region show the average relation for star-forming galaxies and its 1σuncertainty, based on local spiral galaxies (black crosses) and starburst galaxies (black plusses) from
Kennicutt(1998). Relaxed ETGs (black diamonds) from the ATLAS3Dsample fall below the Kennicutt-Schmidt relation,
on average (Davis et al. 2014).
To estimate the surface area of the molecular gas in our targets, we use our kinematic models to estimate the ex-tent of the relaxed gas disc (measured at 3 times the RMS level, which is approximately 7 M⊙pc−2) and assume
ax-Figure 5.Comparison between the molecular gas surface den-sity (Σgas) and SFR surface denden-sity (ΣSFR). The black, solid line and grey shaded region show the average relation for star-forming galaxies and its 1σscatter (Kennicutt 1998). Local spiral galax-ies (black crosses) and starburst galaxgalax-ies (black plusses) fall on this relation, whereas relaxed ETGs (open black diamonds) are slightly offset, on average (Davis et al. 2014). Our six dust lane ETGs are shown as red symbols, with 1σerror bars, for which we take the area of the undisturbed gas that can be modeled as a disc. The cyan symbols (connected to the corresponding red symbols by a dotted line) instead take into account the maximum extent of the disturbed features by assuming this gas is also located in a symmetric disc (note that galaxy 2MASXJ1333 shows no dis-turbed features). This results in the maximum possible surface area of the gas (both disturbed and undisturbed). This overesti-mate of the surface area moves the galaxies slightly closer to the ΣSFR−ΣH2 relation, but not enough to affect our conclusions. Our sample of ETGs that have undergone a recent minor merger have molecular gas surface densities similar to spiral galaxies and relaxed ETGs, but much lower SFR surface densities, falling on overage 2 orders of magnitude below the Kennicutt-Schmidt re-lation.
isymmetry. The resulting surface densities are shown as the red, filled symbols. The 1σ errors are based on the errors in the SFR and MH2 measurements. Since there are
filled symbols (except for galaxy 2MASXJ1333, because its gas disc is not disturbed). Error bars have been omitted, but are the same as for the corresponding undisturbed mea-surements (i.e. the red symbols). The true values will lie in between our two estimates (connected by dotted lines), but will likely be much closer to the one which excludes the disturbed gas (i.e. the red symbols).
Note that Kennicutt (1998) included the atomic gas as well as the molecular gas within the star-forming re-gion, whereas we (andDavis et al. 2014) used only the total molecular gas mass within the molecular gas region (which is likely similar to the star-forming region). Hihas been de-tected in the majority of our dust lane ETGs (Davis et al. 2015), but this emission was unresolved. Adding Hito our Σgas determination, would move our points to the right in
Figure5(by 0.2−0.5 dex), only exacerbating the disagree-ment with the star-forming galaxies.
The Σgas and ΣSFRestimate based on the undisturbed
area as well as the one based on the disturbed area show that these dust lane ETGs have much lower star formation surface densities than spiral galaxies and relaxed ETGs at fixed Σgas. Because our galaxies have molecular gas densities
similar to those in spirals and relaxed ETGs, the suppres-sion is not caused by low gas densities at least in an aver-age sense. It remains possible that the dense molecular gas, traced by molecules such as HCN and closely related to the SFR (Gao & Solomon 2004), has lower surface densities in our objects than in relaxed systems. Also if this is the case, the question remains which physical process is responsible for this.
4 DISCUSSION AND CONCLUSIONS
We studied the morphology and kinematics of cold, molec-ular gas in six dust lane ETGs. These objects were selected to have very low SFEs. These systems were observed previ-ously and are known to exhibit mild disturbances in their stellar distribution, suggesting that they underwent minor mergers in the recent past. It is possible that star formation is suppressed due to the fact that the gas brought in by the minor merger is not dynamically relaxed. If the gas is still streaming in to settle into a disc, the high velocity may have a stabilizing effect on the gas, preventing it from collapsing. We obtained spatially resolved molecular gas measurements in these galaxies with ALMA to test this hypothesis.
We detect edge-on gas discs in all our six targets, as expected. The majority of these show disturbed features, such as detached gas clouds, warps, and other asymmetries, both morphologically and kinematically. Warps are expected when the gas, which was brought in via a minor merger with its angular momentum misaligned from the stars in the host galaxy, is still settling into the stellar potential (e.g.
van de Voort et al. 2015). Even though 5 out of 6 galaxies show some assymetries indicating the gas is not fully relaxed, the majority of the molecular gas is located in the central disc, which exhibits regular rotation.
To better understand the kinematic behaviour of the gas, we fit the data cube with a kinematic model using the KinMS modelling code coupled to an MCMC code. The re-sulting velocity dispersions of the molecular gas are rela-tively high (16−40 km s−1), except in galaxy 2MASXJ1333
(6 km s−1; which also shows no disturbed features). This, in
principle, supports our claim that the gas discs are not dy-namically relaxed. However, due to the fact that we are view-ing the discs edge-on, we are unsure how much these velocity dispersions are biased because of projection effects (caused by non-circular motions). Future observations of more face-on galaxies with low SFEs (with inclinatiface-ons below 60°) will enable improved modelling, especially when paired with high-resolution high resolution optical or near-infrared imag-ing to better constrain the galaxy rotation curve.
We believe our objects have only recently acquired their molecular gas and are therefore in a special phase of their evolution in which the gas is not yet in dynamical equi-librium with the other galaxy components. Based on the observed disturbances in the gas distribution, we derive (minor) merger ages between 39 and 171 Myr. The gas is likely still flowing towards the centre, which potentially affects their stability against fragmentation and star for-mation. This enhanced stability could be provided by in-flowing motions (e.g.Meidt et al. 2013) or by shear (Seigar 2005) or by excess (weak) shocks or (magnetohydrodynamic) turbulence in the molecular gas (e.g. Cluver et al. 2010;
Padoan & Nordlund 2011). Other observations of star for-mation in tidal tails or ram pressure stripped tails have also revealed low SFEs (e.g.Knierman et al. 2013;J´achym et al. 2014). Certain interacting galaxies are observed to have a large fraction of warm molecular gas, likely due to shocks and turbulence induced by gas accretion, and to show sup-pressed SFEs (Alatalo et al. 2014; Appleton et al. 2014). These are consistent with our interpretation that the sup-pression of the SFE is due to dynamical effects.
The SFRs measured are sensitive to star formation in the past≈ 100 Myr. This timescales is similar to our es-timated merger ages. However, the sensitivity increases to-wards more recent star formation and is most sensitive to stars with ages . 5−10 Myr. It is possible that the star formation rate in our objects is increasing with time, which would mean that the instantaneous SFR is higher than the 100 Myr-averaged SFR, in which case we would be underes-timating the SFE in our recently merged galaxies. However, for this to negate the 1−2 orders of magnitude suppression of the SFE, the SFR would have to rise by a similarly large factor over the past 5−10 Myr for all of our objects, which we consider unlikely.
Although the lack of synchrotron emission at 3 mm argues against any active supermassive black holes in our galaxy sample, AGN feedback could eject cold molecular gas and suppress star formation. However, Rosario et al.
(2018) find normal gas fractions and SFEs in the centres of nearby Seyfert galaxies. Additionally, outflows are gener-ally detected away from the disc and emanating from the centre, whereas the kinematically disturbed features we de-tected are located in the plane of the disc. Furthermore, since the molecular gas is very extended, nuclear feedback is unlikely to efficiently couple to it. We therefore disfavour the explanation that AGN feedback (or supernova feedback) could be responsible for the abnormally low SFEs.
be-cause their star formation rates are lower than in the recent past, since they just experienced a starburst, whereas star formation rates in our ETGs are higher than before, since the star-forming gas was recently brought in by a gas-rich merger. The physical reason behind the SFE suppression may be different in these different types of galaxies, but spatially resolved observations of the molecular gas content in post-starbursts may help answer this question.
In summary, we obtained resolved observations of CO emission in six dust lane ETGs with known low SFEs. We find clear morphological and kinematic disturbances, which indicate that the suppression of star formation could in-deed be due to the gas motion stabilizing the molecular gas against collapse. Gas-rich mergers with gas-rich hosts are known to result in starburst events with elevated SFEs, due to the compression of the galaxies’ ISM. The opposite effect is found here, due gas-poor nature of the hosts studied in this work and therefore the absence of strong shocks. Fu-ture studies of these effects in hydrodynamical simulations will be useful to understand the evolution of the SFE during major and minor, gas-rich and gas-poor mergers.
ACKNOWLEDGEMENTS
We would like to thank the referee for their comments that helped clarify the manuscript. We would also like to thank Sugata Kaviraj for helpful suggestions. FvdV is sup-ported by the Klaus Tschira Foundation. TAD acknowl-edges support from a Science and Technology Facilities Council Ernest Rutherford Fellowship. SSS thanks the Aus-tralian Research Council for an Early Career Fellowship, DE130101399. Parts of this research were conducted by the Australian Research Council Centre of Excellence for All Sky Astrophysics in 3 Dimensions (ASTRO 3D), through project number CE170100013. YST is supported by the Carnegie-Princeton Fellowship and the Martin A. and He-len Chooljian Membership from the Institute for Advanced Study in Princeton. This paper makes use of the follow-ing ALMA data: ADS/JAO.ALMA#2015.1.00320.S and we thank all those involved in the proposal. ALMA is a partner-ship of ESO (representing its member states), NSF (USA) and NINS (Japan), together with NRC (Canada), MOST and ASIAA (Taiwan) and KASI (Republic of Korea), in cooperation with the Republic of Chile. The Joint ALMA Observatory is operated by ESO, AUI/NRAO and NAOJ. This research has made use of the NASA/IPAC Extragalac-tic Database (NED) which is operated by the Jet Propul-sion Laboratory, California Institute of Technology, under contract with NASA.
References
Abazajian K. N., Adelman-McCarthy J. K., Ag¨ueros M. A., et al. 2009, ApJS,182, 543
Alatalo K., Appleton P. N., Lisenfeld U., et al. 2014, ApJ,795, 159 Appleton P. N., Mundell C., Bitsakis T., et al. 2014, ApJ,797, 117 Barnes J. E., Hernquist L. E., 1991, ApJ,370, L65
Barth A. J., Darling J., Baker A. J., Boizelle B. D., Buote D. A., Ho L. C., Walsh J. L., 2016, ApJ,823, 51
Bigiel F., Leroy A. K., Walter F., et al. 2011, ApJ,730, L13 Bolatto A. D., Wolfire M., Leroy A. K., 2013, ARA&A,51, 207
Cald´u-Primo A., Schruba A., 2016, AJ,151, 34
Cluver M. E., Appleton P. N., Boulanger F., et al. 2010, ApJ, 710, 248
Colombo D., Kalinova V., Utomo D., et al. 2017, preprint, (arXiv:1712.03591)
da Cunha E., Charlot S., Elbaz D., 2008, MNRAS,388, 1595 Daddi E., Elbaz D., Walter F., et al. 2010, ApJ,714, L118 Dark Energy Survey Collaboration Abbott T., Abdalla F. B., et
al. 2016, MNRAS,460, 1270
Davis T. A., Alatalo K., Sarzi M., et al. 2011, MNRAS,417, 882 Davis T. A., Alatalo K., Bureau M., et al. 2013, MNRAS,429, 534 Davis T. A., Young L. M., Crocker A. F., et al. 2014, MNRAS,
444, 3427
Davis T. A., Rowlands K., Allison J. R., et al. 2015, MNRAS, 449, 3503
French K. D., Yang Y., Zabludoff A., Narayanan D., Shirley Y., Walter F., Smith J.-D., Tremonti C. A., 2015, ApJ,801, 1 Gao Y., Solomon P. M., 2004, ApJ,606, 271
Genzel R., Tacconi L. J., Gracia-Carpio J., et al. 2010, MNRAS, 407, 2091
Hernquist L., 1993, ApJ,409, 548
J´achym P., Combes F., Cortese L., Sun M., Kenney J. D. P., 2014, ApJ,792, 11
Johansson P. H., Naab T., Ostriker J. P., 2009, ApJ,697, L38 Kaviraj S., 2014, MNRAS,440, 2944
Kaviraj S., Peirani S., Khochfar S., Silk J., Kay S., 2009, MNRAS, 394, 1713
Kaviraj S., Ting Y.-S., Bureau M., et al. 2012, MNRAS,423, 49 Kaviraj S., Rowlands K., Alpaslan M., et al. 2013, MNRAS,
435, 1463
Kaviraj S., Shabala S. S., Deller A. T., Middelberg E., 2015, MN-RAS,452, 774
Kennicutt Jr. R. C., 1998, ApJ,498, 541
Kennicutt R. C., Evans N. J., 2012, ARA&A,50, 531
Knierman K. A., Scowen P., Veach T., Groppi C., Mullan B., Konstantopoulos I., Knezek P. M., Charlton J., 2013, ApJ, 774, 125
Kohno K., Tosaki T., Matsushita S., Vila-Vila´o B., Shibatsuka T., Kawabe R., 2002, PASJ,54, 541
Lake G., Norman C., 1983, ApJ,270, 51
Leroy A., Bolatto A., Stanimirovic S., Mizuno N., Israel F., Bot C., 2007, ApJ,658, 1027
Leroy A. K., Walter F., Brinks E., Bigiel F., de Blok W. J. G., Madore B., Thornley M. D., 2008, AJ,136, 2782
Lintott C. J., Schawinski K., Slosar A., et al. 2008, MNRAS, 389, 1179
Martig M., Bournaud F., Teyssier R., Dekel A., 2009, ApJ, 707, 250
Meidt S. E., Schinnerer E., Garc´ıa-Burillo S., et al. 2013, ApJ, 779, 45
M´endez-Abreu J., Aguerri J. A. L., Corsini E. M., Simonneau E., 2008, A&A,478, 353
Mihos J. C., Hernquist L., 1994, ApJ,425, L13 Mihos J. C., Hernquist L., 1996, ApJ,464, 641
Naab T., Johansson P. H., Ostriker J. P., 2009, ApJ,699, L178 Padoan P., Nordlund ˚A., 2011, ApJ,730, 40
Romeo A. B., Mogotsi K. M., 2017, MNRAS,469, 286
Rosario D. J., Burtscher L., Davies R. I., et al. 2018, MNRAS, 473, 5658
Rowlands K., Dunne L., Maddox S., et al. 2012, MNRAS, 419, 2545
Saintonge A., Tacconi L. J., Fabello S., et al. 2012, ApJ,758, 73 Sanders D. B., Soifer B. T., Elias J. H., Madore B. F., Matthews
K., Neugebauer G., Scoville N. Z., 1988, ApJ,325, 74 Seigar M. S., 2005, MNRAS,361, L20
Suess K. A., Bezanson R., Spilker J. S., Kriek M., Greene J. E., Feldmann R., Hunt Q., Narayanan D., 2017, ApJ,846, L14 Swinbank A. M., Sobral D., Smail I., Geach J. E., Best P. N.,
Mc-Carthy I. G., Crain R. A., Theuns T., 2012, MNRAS,426, 935 Tohline J. E., Simonson G. F., Caldwell N., 1982, ApJ,252, 92 Toomre A., 1964, ApJ,139, 1217
van de Voort F., Davis T. A., Kereˇs D., Quataert E., Faucher-Gigu`ere C.-A., Hopkins P. F., 2015, MNRAS,451, 3269 van Dokkum P. G., Whitaker K. E., Brammer G., et al. 2010,
ApJ,709, 1018