Oregon Broadband Adoption
Submitted to:
Oregon Public Utility Commission
Submitted by:
ORC International, Inc.
Contents
Contents ... 3
Study in Brief ... 5
Computer and Internet Use ... 5
Barriers to Broadband Adoption... 5
Objectives ... 6
Methodology ... 6
Major Findings ... 8
Computer Ownership ... 8
Correlates of Computer Ownership ... 9
Wireless Connectivity and Computer Usage ... 11
Other Internet Access Points ... 12
Internet Use ... 15
Internet Nonusers ... 17
Attitudes toward the Internet ... 22
Using the Internet ... 23
Home Broadband Adoption ... 26
Profile of Broadband Users ... 28
Attitudes toward Broadband Connectivity ... 32
Cost of Broadband Service—Broadband Adopters ... 33
Perceived Cost of Service—Broadband Nonadopters ... 36
Satisfaction with Internet Service ... 37
Conclusions ... 39
Appendix ... 40
Response to Topic Questions by Region ... 40
Demographic Profiles by Region ... 56
Detailed Methodology ... 71
Questionnaire ... 78
Study in Brief
Computer and Internet Use
Barriers to Broadband Adoption
• Nearly nine out of ten (88%) adult Oregonians have a computer compared to 78%
nationally.
• Almost all (97%) of those with a computer use the Internet, and more than half
(53%) are "Heavy" or "Power" users of the Internet, having used the Internet for
nine or more activities in the past month.
• The most common Internet activities are checking e-mail, finding local businesses
and events, researching prices or product information, reading or watching the
news, and online banking.
• 97% of Internet users utilize high-speed broadband access rather than a dial-up
connection.
• Computer and Internet use are less common among less educated, lower-income,
and older adults living without children in the household. Oregon's broadband
adoption rate far exceeds the national average
—
82% compared to 68%.
• Although Oregonians' broadband adoption outpaces many other states,
“less-wired” segments, or high percentages of low-adopting segments, occur in some
regions, whereas Portland is the “most wired," pushing the overall adoption rate
up.
Compared to national averages, Oregon has a very high
rate of computer and Internet use.
• Three major factors represent the primary reasons given for not using the Internet:
(1) cost, (2) discomfort with the Internet compounded or manifested by a lack of
perceived need, and (3) access to service elsewhere or perceived lack of residential
Internet Service Providers (ISPs).
• While cost is the primary barrier for all nonadopters, it is a major factor among
those with household incomes below $30,000.
• Activation / installation fees are a greater factor than monthly cost.
• Availablity of service is not generally seen as a barrier, except for those living in
Cost of computer coupled with cost of service are the
primary barriers to broadband adoption.
Objectives
While it is known that a digital divide exists in Oregon, that divide cannot be successfully addressed without understanding the underlying conditions that prevent or deter Oregonians from accessing broadband service and utilizing the array of applications it offers from which they can benefit. It is critical for Oregon to understand those conditions or options that will enable or encourage more individuals to access and use broadband and that will support the expansion of broadband providers' service areas. To address this need, the State of Oregon Public Utility Commission conducted research to provide a reliable estimate of the current use of and demand for broadband Internet access as well as insight on barriers to access. The survey results inform the State of Oregon and the National Telecommunications and Information Administration on key issues related to the affordability, availability, and adoption of broadband technology in all areas of the state. The survey also provides information to the Oregon Broadband Advisory Council necessary to analyze and report on Oregon’s use of broadband technology in accessing specific areas such as health care, education, government, and energy management. Specific objectives of this study are to
Determine the extent of home broadband adoption rates and use across the state of Oregon and the key factors that influence this important measure
Understand how broadband is perceived across various regions and demographics Identify perceived and actual barriers to broadband Internet access and utilization
Methodology
Telephone data collection is still the most reliable methodology to reach a random sample of households. Inclusion of cell-phone sample addresses the increasing prevalence of only and cell-phone-primary households—31% and 15%, respectively, in Oregon.1
Just over 4,000 surveys were completed statewide—3,010 with a random-digit-dial (RDD) sample of landline telephone numbers and 1,012 with a random sample of cell phone numbers—resulting in a margin of error for the entire sample in the Oregon Broadband Penetration Study generally no greater than plus or minus 1.5 percentage points at a 95% confidence level. The size of the sample provides the ability to analyze the differences in responses between different segments.
1
Oregon is a geographically large and diverse state. To quantify differences in key measures in different areas of the state, eight regions were identified and between 400 and 500 interviews were completed in each region. In addition, to better capture the diversity within the Portland metropolitan region, 987 interviews were completed. Interviews were completed with a randomly selected adult in the household 18 years of age or older.
Data were weighted within each region so that the distribution of the sample reflects the target population and acts as a nonresponse correction. Household weighting adjusts for the number of single-person versus multiple-person households, for ethnic background of household members, and for home ownership. Respondent weighting adjusts for distribution of age by gender and by race or ethnicity. The questionnaire was developed based on a review of other relevant research that has been conducted nationwide. Key sources included
Federal Communications Commission, Broadband Adoption and Use in America, OBI Working Paper Series No. 1, February 20102
Pew Research Center, Home Broadband 20103
Other states’ research conducted as part of the Connected Nation program4
Use of key questions from this national research provides the opportunity to benchmark Oregon’s results against the national research. The survey averaged 16 minutes in length and covered the following broad topic areas:
Access to and use of technology Access to and use of the Internet
Broadband adoption and characteristics of service used Attitudes toward the Internet and broadband adoption Respondent and household characteristics (demographics) Interviews were conducted in both English and Spanish.
Data collection was completed in October and November of 2010. Strict dialing protocols were used to maximize response rates and to ensure that the data represents all Oregonians.
Major Findings
Computer Ownership
Nearly nine out of ten (88%) adult Oregonians personally have a computer,
significantly higher than national figures, which have stabilized at 77% to 78% for the past several years5.
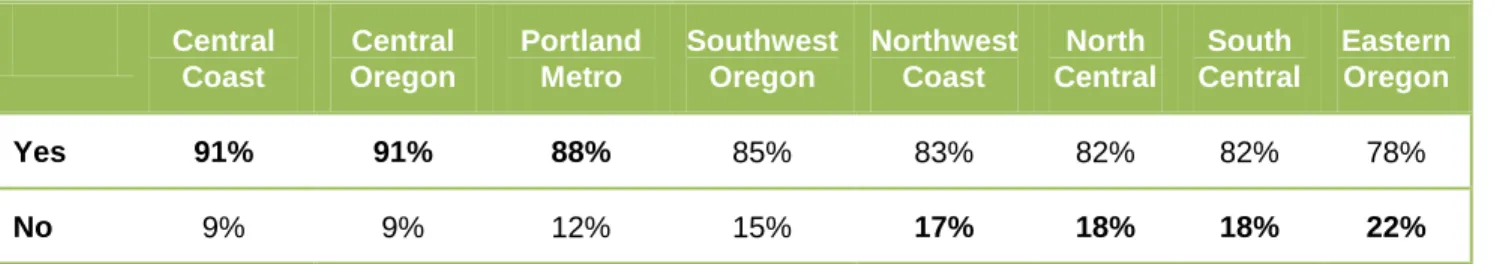
Computer ownership varies across the state. Those living in Eastern Oregon are the
least likely to personally have a computer. Nearly twice as many residents in this region do not have a computer compared to the statewide average. Computer ownership is also well below average in North Central and South Central Oregon and along the Northwest Coast. These are all
geographic areas with large rural areas and a less affluent population base. Those living in the Willamette / Central
Coast, Central Oregon, and Portland Metro regions are the most likely to personally have a computer.
Figure 1: Computer Ownership
Table 1: Computer Ownership by Region
Central Coast Central Oregon Portland Metro Southwest Oregon Northwest Coast North Central South Central Eastern Oregon Yes 91% 91% 88% 85% 83% 82% 82% 78% No 9% 9% 12% 15% 17% 18% 18% 22%
Items in bold represent differences between regions that are statistically significant.
5
U.S. Census Bureau, Current Population Survey School Enrollment and Internet Use Supplement, October 2010, and ESA calculations 88% 77% 12% 23% 0% 20% 40% 60% 80% 100% Oregon National Do Not Have a Computer Have a Computer
Correlates of Computer Ownership
Computer ownership is clearly driven by education and household income, but education is the major factor.
More than one-third of Oregon adults without a high school diploma do not have a computer. Nearly two out of five Oregon adults with household incomes below $20,000 do not have a
computer. However, while two-thirds of those in this income category without a high school diploma do not have a computer, only 26% of those with a high school diploma do not have a computer.
Older adults are also less likely to own a computer.
Nearly one out of four (23%) Oregonians who are 65 and older do not personally have a
computer. Among those who live alone, this figure increases to more than two out of five (41%). Oregon’s Hispanic residents are less likely to own a computer.
Nearly one out of four (24%) do not own a computer. Among those with limited English proficiency (that is, speak English as a second language or do not speak English), this figure increases to 64%.
Figure 2: Computer Ownership by Oregon Adults among Key Socioeconomic and Demographic Segments
65% 78% 91% 96% 68% 86% 94% 93% 89% 90% 91% 78% 71% 88% 92% 89% 85% 76% 0% 20% 40% 60% 80% 100%
Oregon’s rate of computer use compared to the national average is due primarily to higher use among those segments that are typically less likely to have a computer.
Adoption rates in Oregon, as compared with the United States overall, are significantly higher among Those who have not graduated from high school—65% in Oregon compared to 43% nationally Older adults, notably those 65 and older—78% in Oregon compared to 42% nationally
Lower-income households—68% in Oregon compared to 58% nationally English-speaking Hispanics—83% in Oregon compared to 74% nationally
Figure 3: Computer Ownership in Oregon Compared to National Benchmarks6
6 http://www.census.gov/compendia/statab/2012/tables/12s1158.pdf 0% 20% 40% 60% 80% 100% Less Than High School High School Graduate Some College College Graduate Oregon National 0% 20% 40% 60% 80% 100% Less than $30K $30K -$50K $50K -$75K $75K Plus Oregon National 0% 20% 40% 60% 80% 100% 18 - 29 30 - 49 50 - 64 65 Plus Oregon National 0% 20% 40% 60% 80% 100% White (Non-Hispanic) Black (Non-Hispanic) English Speaking Hispanic Oregon National
Wireless Connectivity and Computer Usage
Nearly three out of four Oregonians whoown a computer have a laptop or notebook computer, making them potentially mobile Internet users. More than half have
multiple computers—both a desktop and a laptop. Only 28% of Oregonians who use a computer have a desktop computer only. The type(s) of computer used is related to age and income.
Forty-four percent (44%) of those who are 65 and older rely solely on a desktop computer.
Those with household incomes below $30,000 are more likely (44%) to rely solely on a desktop computer, often still less expensive than a laptop or notebook
computer.
88%
•Use a Computer28%
•Use a Desktop Only72%
•Use a Laptop92%
•Have Wireless Card in Their LaptopOther Internet Access Points
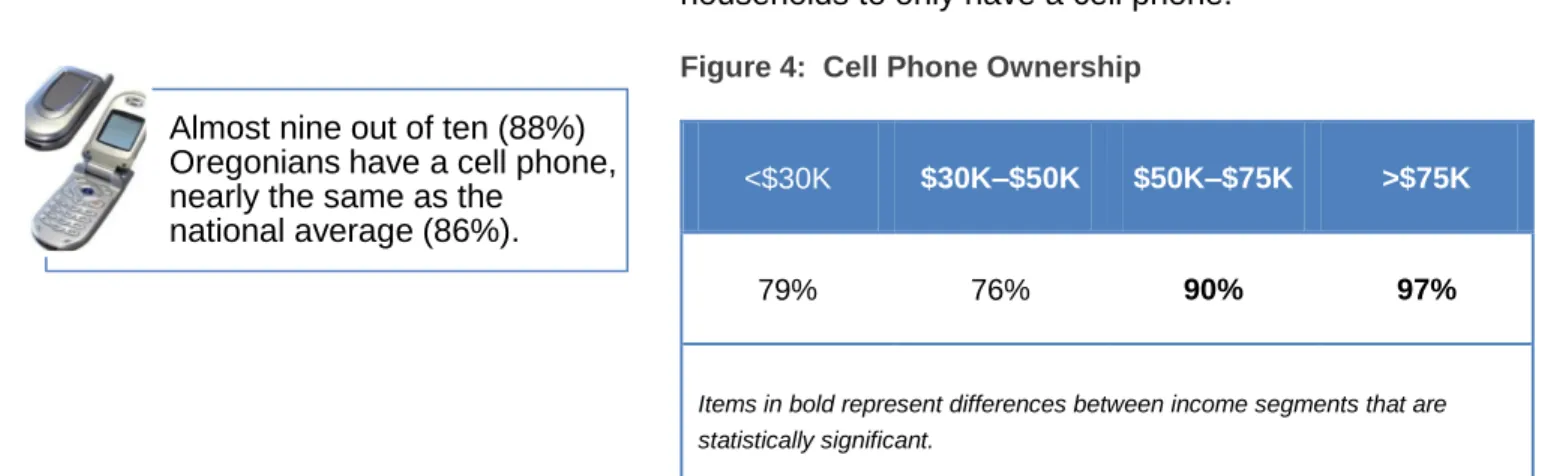
Cell phone penetration is primarily a function of household income. However, low-income households with a cell phone are more than twice as likely as more affluent households to only have a cell phone.
Figure 4: Cell Phone Ownership
<$30K $30K–$50K $50K–$75K >$75K
79% 76% 90% 97%
Items in bold represent differences between income segments that are statistically significant.
Nearly one out of five (18%) Oregon households report that they are cell-phone-only households. This is somewhat lower than national averages—24% wireless-only households.7
An additional 31% say that they primarily use their cell phone rather than their landline.
Prevalence of cell-phone-only households is clearly a function of one or more demographic or socioeconomic factors. Cell-phone-only households in Oregon are most common among
Younger Oregonians, notably those between the ages of 25 and 34
Less affluent households, notably those with household incomes below $20,000 Oregon adults who live alone
Nonwhite and Hispanic Oregonians
Oregonians with high school diplomas or less education
These findings are consistent with national studies that associate cell-phone-only households with lower incomes, as well as younger individuals, renters, and Hispanics.
Over a third of young people aged 18–29 are wireless only.
Over 60% of adults who share a house or apartment with roommates, nearly 40% of all renters, and 25% of Hispanics are wireless only.8
7
Wireless Substitution: State Level Estimates from National Health Interview Survey, National Health Statistics Report, April 20, 2011
8
Stephen J. Blumberg, Ph.D., and Julian V. Luke, Division of Health Interview Statistics, National Center for Health Statistics, Wireless Substitution: Early Release of Estimates From the National Health Interview Survey, July–
December 2008, http://www.cdc.gov/nchs/data/nhis/earlyrelease/wireless200905.htm Almost nine out of ten (88%)
Oregonians have a cell phone, nearly the same as the
Figure 5: Oregon Adults Reporting They Are Cell-Phone-Only Households among Key Socioeconomic and Demographic Segments
Ownership of a web-enabled cell phone is a function of both income and age.
Figure 6: Web-Enabled Cell Phone Ownership
<$30K $30K–$50K $50K–$75K >$75K
42% 39% 56% 75%
18–29 30–49 50–64 65+
66% 66% 55% 30%
Items in bold represent differences between income segments and age groups that are statistically significant.
26% 24% 17% 15% 39% 28% 22% 18% 23% 47% 19% 10% 5% 6% 33% 16% 18% 16% 25% 24% 0% 5% 10% 15% 20% 25% 30% 35% 40% 45% 50% Nearly two-thirds (63%) of those who have a cell phone have a phone that is web enabled. Oregonians' use of web-enabled devices is three times the U.S. average (19%).
Use of web-enabled cell phones is almost exclusively a function of age.
Figure 7: Web-Enabled Cell Phone Use
18—29 30—49 50–64 65+
71% 61% 46% 40%
Items in bold represent differences between age groups that are statistically significant.
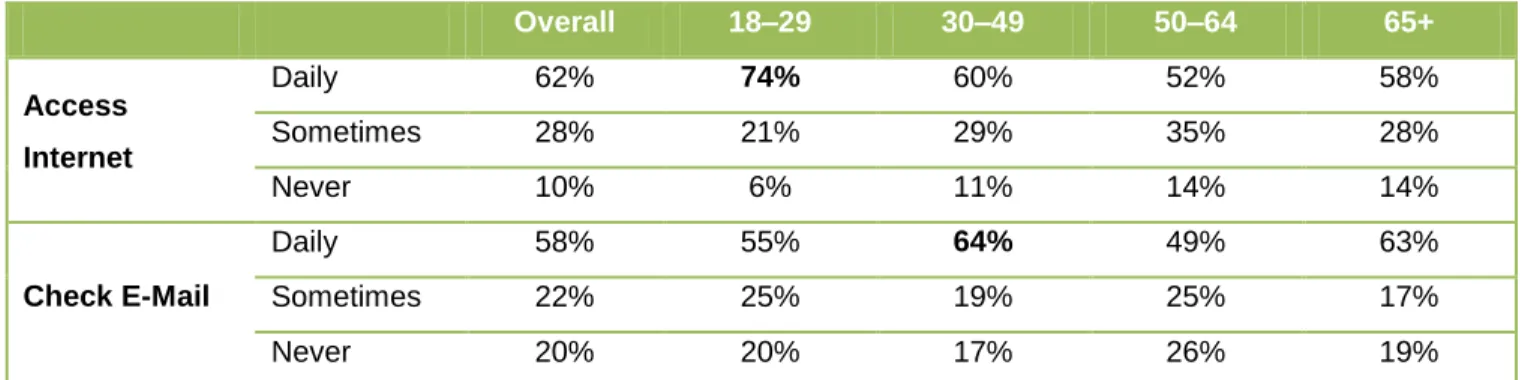
The majority of those using their cell phones to access the Internet use them daily to access the Internet and to check e-mail. As with overall use of their cell phones to access the Internet, frequency of use varies by age. The frequent use of their cell phone to check e-mail among those between 30 and 49 most likely reflects business or work e-mails.
Figure 8: Frequency of Using Web-Enabled Cell Phone to Access Internet or Check E-Mail
Overall 18–29 30–49 50–64 65+ Access Internet Daily 62% 74% 60% 52% 58% Sometimes 28% 21% 29% 35% 28% Never 10% 6% 11% 14% 14% Check E-Mail Daily 58% 55% 64% 49% 63% Sometimes 22% 25% 19% 25% 17% Never 20% 20% 17% 26% 19%
Items in bold represent differences between age groups that are statistically significant.
Ownership of game consoles is a function of age and the presence of children in the household.
Figure 9: Ownership of Game Consoles
18–29 30–49 50–64 65+
73% 56% 36% 14%
Children in Household No Children in Household
67% 33%
Items in bold represent differences between age groups and household types that are statistically significant.
However, only 57% of those with web-enabled cell phones actually use their phone to access the Internet.
Nearly half (47%) of all Oregonians have a game console.
This figure is likely much higher as current U.S. statistics show that ownership of tablet PCs doubled over the most recent holiday period to 19%.9
Ownership of tablet PCs in this 2010 study was strongly correlated with household income. As prices and popularity have changed in the last two years, this may have changed.
Figure 10: Ownership of Table PC
< $30K $30K - $50K $50K - $75K >$75K
4% 6% 8% 10%
Items in bold represent differences between income segments that are statistically significant.
Internet Use
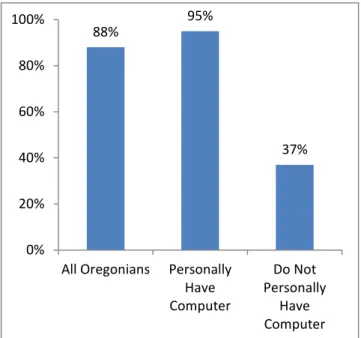
Nearly nine out of ten (88%) Oregonians use the Internet. As with computer usage, Oregon surpasses the national average (79%).10
Internet use and computer ownership are highly correlated, as expected.
Ninety-five percent (95%) of those who personally have a computer (88% of all Oregonians) also use the Internet. Thirty-seven percent (37%) of those who
do not personally have a computer (12% of all Oregonians) use the Internet.
Most (90%) report using the Internet for more than five years.
Figure 11: Internet Use
Fewer than one in ten (8%) Oregonians have a tablet PC, a relatively new and
expensive technology at the time of this study.
88% 95% 37% 0% 20% 40% 60% 80% 100%
All Oregonians Personally Have Computer Do Not Personally Have Computer
Of those using the Internet most (81%) access it from multiple locations. The most common access points are home, school, and work. However, this varies depending on whether an individual owns a computer and the type of computer owned.
Almost all (99%) Oregonians with a computer access the Internet from home. While one-third (34%) of those with only a desktop limit their use of the Internet to a single location, two-thirds access the Internet from multiple physical sites, reflecting a still-growing number of employees who access it from work.
Reflecting their relative mobility, those with a laptop computer are the most likely to access the Internet from multiple locations—only 12% limit their access to a single location. Laptop users typically access the Internet from home as well as at work or school and at mobile locations such as coffee shops or other businesses.
One out of three (34%) Oregonians who do not own computer access the Internet from a single location. While the majority (72%) accesses the Internet from home, suggesting they are using another family member’s computer, 10% use a friend’s or relative’s computer and 15% do so at work.
It is noteworthy that nearly all (93%) students access the Internet at school, regardless of whether they personally have a computer. Far fewer (77%) workers use the Internet at work, reflecting that many workers lack access to an employer-provided computer at work or face policies restricting use of the Internet due to security or other concerns.
Internet Access Locations
All Oregonians Accessing
Internet
Personally Have Computer
Personally Do Not Have Computer All Desktop Only Laptop
Average* Access Points 3.0 3.0 2.0 3.0 2.0
Home 97% 98% 98% 99% 65%
School** 93% 93% 97% 92% 93%
Work** 77% 79% 65% 82% 42%
Someone Else’s House 50% 50% 51% 50% 50%
Public Library 32% 32% 23% 35% 38%
Café or Other Business 31% 33% 38% 55% 9%
Community Center 6% 6% 5% 7% 6%
* Median
Internet Nonusers
Internet nonusers are clearly differentiated from Internet users by their
demographic and socioeconomic characteristics. However, computer access is, unsurprisingly, the primary correlate of Internet use. Today, with consoles, tablets, and smartphones increasingly utilized as access points, we would expect this correlation to have potentially weakened.
Nearly two out of three Internet nonusers lack a personal computer.
The 65-plus age group is significantly less likely than younger Oregonians to own a computer and as a result is less likely to use the Internet. Nine out of ten individuals in this age group who personally have a computer do access the Internet.
Two out of five Internet nonusers have household incomes below $30,000. Nearly three out of ten (28%) Oregonians in this income segment do not use the Internet. Even among those who have a computer, an eighth (12%) does not use the Internet.
More than three out of five Internet nonusers have a high school degree or less education. One-third (34%) of those with some high school do not use the Internet; 23% of those with high school degrees do not use the Internet.
Finally, those who live alone are less likely to access the Internet. This may be a function of their age (single person households are often older adults) and/or their single-income household.
Internet Users Internet Nonusers Personally Have Computer Yes No 95% 5% 35% 65% Age 18–29 30–49 50–65 65+ 24% 33% 26% 17% 6% 25% 25% 43% Income <$30K $30K–$50K $50K–$75K >$75K 14% 18% 19% 49% 40% 22% 9% 30% Education
Some High School High School Degree Some College or AA Degree Bachelor’s Degree or Higher 4% 22% 32% 41% 15% 48% 25% 12% Household Type Single-Person Adults Only Children in HH 8% 52% 41% 20% 59% 21%
Base: All Respondents
Items in bold represent differences between Internet users and nonusers that are statistically significant.
Cost and comfort with the Internet or lack of need are the primary reasons given for not using the Internet.
In addition to the demographic correlates of non-Internet use cited above, nonusers were asked to specify their reasons for not using the Internet. Three major factors surfaced:
1. Cost, including both costs to obtain service and monthly costs
2. Discomfort with the Internet, compounded or manifested by a lack of perceived need
3. Access to service elsewhere (work or public location) or lack of
residential ISPs
Cost is the primary stated reason for not using the Internet, followed closely by lack of need and security concerns. Access to service is not a major factor.
In terms of cost, the activation or installation fees are a greater factor than monthly cost.
However, none of these factors are
reported as particularly important to Internet nonusers, suggesting that there are other factors in play—computer ownership, demographics, socioeconomics, or other factors.
Reason Mean*
Cost 2.95
Activation / installation fee too high 3.01
Monthly cost too high 2.88
Comfort / Perceived Need 2.80
Worried about bad things that could happen if use Internet
2.88
Not comfortable using computer 2.78
Nothing on Internet I want to see 2.75
Access to Service 2.02
Can access at public location 2.31
Have access through cell phone 2.04
Can access Internet at work 2.03
Is not available where live 1.68
Mean is based on a 5-point scale where "1" means ―not a reason at all‖ and "5" means ―a major reason.‖ Base: Internet Nonusers
Reasons for not using the Internet vary by age and income.
Older adults not using the Internet clearly cite lack of need and concerns with security as reasons not to use the Internet.
Among those between the ages of 30 and 49, cost and availability of service are stated major factors.
As would be expected, cost is a major factor for those with household incomes below $30,000. However, both need and availability of service are also minor factors within this segment.
Among those with household incomes between $50,000 and $75,000, access to service is a major factor along with cost as a secondary factor. This may suggest that available service in the area was seen as prohibitive for this income segment. Comfort / Perceived Need Cost Access to Service AGE 18–29 30–49 50–65 65+ INCOME <$30K $30K–$50K $50K–$75K >$75K Major Factor Minor Factor Not a Factor
Cost and lack of access to service as reasons for not using the Internet also vary by region.
Cost and access to service are major factors among nonusers in the Willamette / Central Coast region. Access to service is a major factor along
the Northwest Cost and in Central and South Central Oregon. These regions have large rural areas where service may be spotty or unreliable.
In Eastern Oregon, where Internet use is the lowest, no single factor emerges as a key driver of nonuse.
Region Cost Access to
Service Northwest Coast
Portland Metro
Willamette Valley / Coast
Southwest Oregon
North Central Oregon
Central Oregon
South Central Oregon
Eastern Oregon Major Factor Not a Factor Minor Factor
Among nonusers, future interest in using the Internet is relatively low.
Only one out of three Internet nonusers expresses an interest in going online in the future.
Nearly half (49%) of those interested in using the Internet indicated they would use the Internet for research or information gathering. Other activities include
Buy / sell goods 15%
Movies / gaming / entertainment 14%
School / education 12%
Social networking 10%
Work from home 7%
Keep in touch with friends / family 6%
Interest* is highest among Younger nonusers Low-income households Less educated nonusers Children in household 18–29 30–49 50–64 65+ 61% 42% 31% 15% <$30K $30K– $50K $50K– $75K >$75K 42% 36% 30% 14% Some High School High School Degree Some College / AA College Degree 40% 29% 35% 27% Children in Household No Children in Household 48% 25%
* Interest = combined ―very‖ and ―somewhat interested‖ Items in bold represent differences between segments that are
statistically significant. Not Interested 68% Somewhat Interested 21% Very Interested 11%
Attitudes toward the Internet
Respondents were asked to indicate the degree to which they agree or disagree with a number of statements related to the Internet. Factor analysis was used to determine the extent to which these statements correlated with underlying descriptive dimensions: value, safety, and privacy.
As would be expected, those using the Internet are more likely than Internet nonusers to feel the Internet has value.
The most important value factor that differentiates Internet users from nonusers is the extent to which they feel the Internet is a valuable source of learning.
The extent to which they feel the Internet makes people more productive, followed by the importance of the Internet for children, are of secondary importance.
On the other hand, Internet nonusers are more likely to be concerned about Internet safety, potentially because they have less hands-on experience to help allay this concern.
The biggest concern is the degree of danger for children. Among those households with children who are non-Internet users, 55% strongly agree that the Internet is ―too dangerous‖ for children.
The extent to which Internet users are concerned about identity theft followed by the amount of
pornography and offensive content are of secondary concern.
Finally, Internet users are more likely than nonusers to indicate they are concerned about Internet privacy. This would suggest that users are aware of and rightfully concerned about this issue, yet this is not a barrier to using the Internet to the extent that they are willing to assume risk and to take appropriate steps to protect their privacy.
Reason Internet
User
Internet Nonuser
Internet Value* 3.63 3.22
Internet is a valuable source for information and learning
3.44 2.96
People can be more productive using Internet
3.85 3.48
It is important for children to learn how to use the Internet
3.59 3.21
Internet Safety* 3.01 3.56
The Internet is too dangerous for children
2.61 3.28
There is too much
pornography and offensive material on the Internet
3.37 3.79
It is too easy for my personal information to be stolen online
3.06 3.61
Internet Privacy* 4.65 4.31
Concerned about my or my family’s privacy while on Internet
4.59 4.20
Concerned about protection of personal identity while on Internet
4.71 4.42
* Mean is based on a 5-point scale where ―1‖ means ―strongly disagree‖ and ―5‖ means ―strongly agree.
** Mean based on a 5-point scale where ―1‖ means ―no concern at all‖ and ―5‖ means ―significant concern.‖
Overall categorymean is an average of variables within the category. Items in bold represent differences between Internet users and
Using the Internet
The Internet is used for many different types of activities—communications, information, entertainment, business and economic activities, and so forth. Respondents were asked the frequency with which they participate in 16 online activities. Based on the frequency with which they participate in these activities, four Internet usage segments were created.
More than half (53%) of Internet users in Oregon are Heavy (31%) or Power (22%) users, having used the Internet for nine or more of the following activities in the past month:
1. Buy or sell goods or services 2. Job-related activities
3. Educational or training purposes 4. Entertainment
5. Find local businesses or events 6. Get health care or medical
information
7. Get information about schools 8. Look for a job
9. Online banking / pay bills 10. Read or watch the news 11. Research prices or product
information
12. Get information from Oregon government
13. Monitor energy use at home 14. Control energy systems in home 15. Check e-mail
16. Get public safety information
Figure 12: Internet Users
Number of Activities in the Past Month
12
+
9-11
6-8
1-5
Power user—22%
Heavy user—31%
Moderate user—24%
Light user—23%
The heaviest users of the Internet are Oregonians who live in the Portland Metro and North Central Oregon regions.
Those living in the Portland Metro region also have one of the highest overall rates of broadband adoption—86%.
On the other hand, adoption rates in North Central Oregon are somewhat below average—71%. The lightest users are Oregonians living in South Central Oregon, Southwest Oregon, and on the
Northwest Coast. All of these areas also have somewhat lower rates of broadband adoption.
Table 2: Internet Usage by Region
NW Coast Portland Central Coast SW Oregon North Central Central Oregon South Central Eastern Oregon Power Users 20% 24% 22% 17% 26% 23% 16% 15% Heavy Users 25% 35% 29% 26% 32% 31% 27% 34% Moderate Users 28% 23% 25% 26% 29% 24% 26% 25% Light Users 28% 19% 24% 31% 23% 22% 31% 26%
All Internet users use the Internet to check e-mail.
More than three-quarters of Power and Heavy users have also used the Internet to research prices or product information, read or watch the news, bank or pay bills, and find local businesses or events.
Figure 13: Types of Activities in Past Month by User Segment
Activities in Past Month
Power Users Heavy Users Moderate Users Light Users
(12+ Activities) (9–11 Activities) (6–8 Activities) (1–5 Activities) Check e-mail
Find local businesses or events Research prices or product info Read or watch the news
Online banking / pay bills
Entertainment (TV, music, gaming) Social networking
Get information from gov’t sites Buy or sell goods or services Job-related activities
Health care / medical information Educational or training purposes Get information about schools Get public safety information Look for a job
Monitor energy use at home Control energy systems in home
Home Broadband
11Adoption
More than one out of five (82%) Oregon adults or approximately 2.42 million adult Oregonians have broadband Internet access at home—well above the U.S. average of 68% and higher than other states that have conducted similar studies.
It is likely that Oregon’s adoption of broadband technology is at the stage where nonadopters should be considered ―laggards‖12 and that adoption rates will slow until they reach a peak somewhere below 100%.
Figure 14: Overall Home Broadband Adoption Rates in Oregon
*Other than home includes Internet access at work, school, library, community center, café / business, someone else’s house, etc.
Figure 15: Adoption in Oregon Compared to Benchmarks
Home broadband access varies significantly across the state, with the lowest rates in Eastern Oregon, followed by North Central and South Central Oregon and the Northwest Coast. On the other hand, home broadband access is highest in Central Oregon and Portland.
Central Oregon Portland Central Coast SW Oregon NW Coast South Central North Central Eastern Oregon 87% 86% 82% 77% 74% 72% 71% 66%
Items in bold represent differences between regions that are statistically significant.
11
Broadband Internet is Internet with a high data-transfer rate when compared to outdated technologies like dial-up. Broadband can be cable, DSL, satellite, or a fiber optic connection, all providing high-speed Internet access to a person’s home.
12
Rogers, Everett M. (1962). Diffusion of Innovations. Glencoe: Free Press. ISBN 0-612-62843-4. Broad-band at Home 82% Dial-Up 3% Access Internet Outside Home 3% Internet Non-User 12% 62% 66% 68% 68% 76% 80% 82% 0% 20% 40% 60% 80% 100% California (2009) Minnesota (2010) Iowa (2010) National (2010) Washington DC (2010) Nevada (2010) Oregon (2010) % Broadband at Home
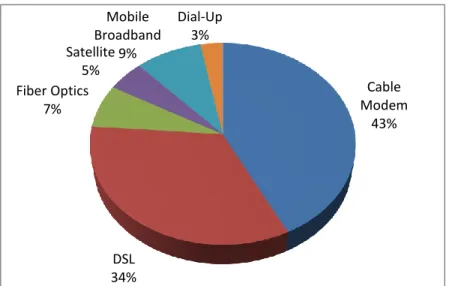
Cable and DSL are the primary connectivity protocols used. Though cable modems are more prevalent than DSL, this varies significantly by region.
Sixteen percent (16%) of those with broadband access were unable to specify the type of service they have, reflecting a significant lack of
understanding that could drive broadband perceptions overall and represents a communications opportunity for the state.
Among those with knowledge of the type of Internet service, only 3% of those with Internet access at home continue to use dial-up services to gain access.
―Other broadband‖ includes fiber optics, satellite, mobile broadband, and fixed wireless. It could also include other high-speed options such as hardwired buildings.
Figure 16: Type of Internet Service at Home
Table 3: Type of Service by Region
Portland North Central Central Oregon NW Coast Central Coast SW Oregon South Central Eastern Oregon Cable Modem 48% 25% 41% 28% 46% 32% 27% 14% DSL 28% 49% 37% 54% 30% 44% 43% 58% Other Broadband 22% 23% 21% 13% 23% 19% 24% 21% Dial-Up 2% 4% 2% 5% 5% 5% 7% 10%
Items in bold represent differences between regions that are statistically significant.
Cable Modem 43% DSL 34% Fiber Optics 7% Satellite 5% Mobile Broadband 9% Dial-Up 3%
Profile of Broadband Users
Broadband adoption varies significantly by demography and socioeconomic status.
The clear dividing lines are education and income.
Only three out of five Oregonians without a high school education and 69% of those with a high school diploma have broadband at home, compared with 84% to 92% of those with college backgrounds or degrees.
Less than two out of three Oregonians with household incomes below $30,000 have broadband Internet at home.
Older adults and those living by themselves are also less likely to have broadband Internet. These
distinctions are similar to those seen with Internet access generally, reflecting less perceived importance. On the other hand, there are no significant differences in broadband adoption by race or ethnicity. To some extent, this reflects Oregon’s relatively homogeneous population even within the different racial and ethnic segments.
Figure 17: Broadband Adoption by Oregon Adults among Key Socioeconomic and Demographic Segments
60% 69% 84% 92% 63% 78% 90% 88% 90% 86% 83% 67% 65% 81% 89% 82% 80% 80% 0% 20% 40% 60% 80% 100%
As seen above, Internet use and broadband adoption rates closely parallel computer ownership. Note that some individuals do not personally have a computer but use the Internet, and in some instances (2% of cases) there is broadband access in their home that is accessed through someone else’s computer.
Oregon’s higher rate of broadband adoption compared to the national average is due to higher adoption rates among several segments:
Those with lower educational achievements: Among those with less than a high school degree, adoption in Oregon is 60% compared to 23% nationally, and among those with a high school degree, adoption in Oregon is 69% compared to 49% nationally.
Less affluent households (household incomes <$30,000): 65% adoption in Oregon compared to 41% nationally.
Older Oregonians (65 years of age and older): 67% adoption in Oregon compared to 29% nationally.
1
Please tell me if you, personally own (a) a working desktop computer or (b) a working laptop or notebook computer.
2
Has computer
1
88%
Uses Internet
2
95%
Has
broadband
Internet at
home
3
91%
No computer
1
12%
Uses Internet
2
37%
Has
broadband
Internet at
home
3
23%
Figure 18: Broadband Adoption in Oregon Compared to National Averages13
The table on the following page provides further details on the characteristics of broadband adopters and nonadopters. 13 http://www.census.gov/compendia/statab/2012/tables/12s1158.pdf 0% 20% 40% 60% 80% 100% Less Than High School High School Graduate Some College College Graduate Oregon National 0% 20% 40% 60% 80% 100% Less than $30K $30K -$50K $50K -$75K $75K Plus Oregon National 0% 20% 40% 60% 80% 100% 18 - 29 30 - 49 50 - 64 65 Plus Oregon National 0% 20% 40% 60% 80% 100% White (Non-Hispanic) Black (Non-Hispanic) English Speaking Hispanic Oregon National
Table 4: Characteristics of Broadband (at home) Adopters and Nonadopters Adopters Nonadopters Broadband at Home (82% of Oregonians 2,419,282 Adults) Dial-up at Home (3% of Oregonians 85,510 Adults) Internet Users (not at home) (3% of Oregonians 85,510 Adults) Non-Internet Users (12% of Oregonians 295,034 Adults) Gender Male 50% 46% 43% 48% Female 50% 54% 57% 52% Age 18–24 13% 7% 37% 4% 25–34 20% 4% 17% 9% 35–44 18% 18% 13% 14% 45–54 19% 17% 13% 18% 55–64 17% 21% 13% 15% 65+ 13% 33% 9% 41% Educational Attainment
Less than High School 4% 4% 8% 15% High School Graduate 21% 27% 43% 48% Some College 32% 35% 29% 16% College 43% 34% 20% 11% Income <$20K 8% 10% 33% 33% $20K–$30K 8% 12% 12% 14% $30K–$40K 10% 26% 16% 14% $40K–$50K 10% 9% 12% 14% $50K–$75K 24% 17% 18% 11% $75K–$100K 18% 14% 3% 5% Over $100K 22% 12% 6% 14% Household Type Single Adult 7% 14% 13% 20% Two+ Adults 52% 62% 46% 59% Family Household 41% 23% 41% 21% Race / Ethnicity White (Non-Hispanic) 80% 95% 67% 79% Nonwhite (Non-Hispanic) Hispanic 10% 4% 12% 14% Disabled 13% 12% 25% 32%
Attitudes toward Broadband Connectivity
Internet users who have broadband accessat home see greater overall Internet value than do non-broadband users. Clearly, a home broadband connection enables the consumption of more content in less time than a dial-up connection and more convenience than a location outside the home, which in turn helps drive perceived value.
Correspondingly, broadband adopters are particularly differentiated from nonusers in characterizing the Internet as
valuable for information and learning. Those with broadband access are also thus more likely to feel that it is important to have broadband access—for themselves (65% characterize this as ―very important‖) and, to a lesser extent, for others.
Reason Internet User / No Broadband Internet / Broadband User Internet Value* 3.45 3.64
Internet is a valuable source for information and learning
3.61 3.86
People can be more productive using Internet
3.25 3.46 It is important for children to
learn how to use the Internet
3.49 3.60
Importance of Having Broadband**
3.17 4.05
Important that all Oregon households have broadband
3.20 3.66
Important that I personally have broadband
3.12 4.43 * Mean is based on a 5-point scale where ―1‖ means ―strongly disagree‖
and ―5‖ means ―strongly agree.‖
** Mean based on a 5-point scale where ―1‖ means ―not at all important‖ and ―5‖ means ―very important.‖
Overall category mean is an average of the variables contained within the category.
Items in bold represent differences between regions that are statistically significant.
Interestingly, there are no significant differences in Oregonians’ perceptions of the value of the Internet across the state.
Oregonians in Central Oregon and Portland are the most likely to feel that it is important to have high-speed Internet access at home. These regions also have the highest adoption rates. On the other hand, Oregonians living in Eastern Oregon and, to a lesser extent, those living in North Central and Central Oregon are less likely to feel that it is important to have broadband at home. These areas have lower-than-average adoption rates. It is clear that these attitudes must change to increase adoption rates.
Table 4: Attitudes toward Broadband Connectivity by Region
Central Oregon Portland NW Coast Central Coast SW Oregon North Central South Central Eastern Oregon Internet Value 3.58 3.58 3.61 3.58 3.55 3.56 3.59 3.52 Broadband Important 3.93 3.90 3.77 3.77 3.64 3.55 3.54 3.27
Base: All Respondents
Cost of Broadband Service—Broadband Adopters
The reported amount that broadband users pay for service at home varies widely—ranging from free to more than $100 per month. Note that those quoting these extremely high figures were likely quoting the cost for a bundle of services including television, phone, and Internet. The popularity of such bundles over the last few years makes the cost for Internet access alone more difficult to estimate, and thus this section is subject to that limitation.
On average, Oregonians with broadband report paying just over $44 per month for high-speed Internet service.
Half (50%) of all current broadband adopters report paying $40 per month or less for service.
This percentage is somewhat higher than national figures—44% paying $40 per month or less— suggesting that costs may be lower in Oregon than in other markets.14
Those with cable modems, in part due to bundles, report monthly costs significantly higher than those using a DSL phone line or other high-speed options. The (less often bundled) cost of DSL service is characterized as significantly lower, with two-thirds of those with DSL service report paying $40 or less per month for Internet access.
Figure 19: Reported Monthly ISP Cost by Type
All DSL Cable Modem Other High Speed
>$60 / Mo 15% 9% 18% 18% $40 - $60 / Mo 36% 26% 44% 35% $20 - $40 / Mo 44% 57% 35% 41% < $20 / Mo 6% 9% 3% 7% Median $44.07 $36.86 $49.45 $43.11 $0.00 $10.00 $20.00 $30.00 $40.00 $50.00 $60.00 0% 10% 20% 30% 40% 50% 60% 70% 80% 90% 100%
Adopters’ reported cost of service varies widely by region—ranging from just under $40 per month in Southwest and Central Oregon to as high as $47 in the Portland Metro region.
Cost of high-speed Internet service in those areas where broadband adoption rates are lower than average (Eastern Oregon, Northwest Coast, and North Central Oregon) does not appear to be a barrier.
Reported monthly costs for service in these three areas are all below the average monthly cost reported for Oregon as a whole.
Figure 20: Reported Monthly Cost for Home Broadband Service (Adopters) by Region
All Oregon NW Coast Portland Central Coast SW Oregon North Central Central South Central Eastern > $60 / Mo 15% 15% 17% 13% 10% 15% 10% 16% 14% $40 - $60 / Mo 36% 30% 39% 35% 32% 36% 30% 37% 37% $20 - $40 / Mo 44% 46% 39% 48% 51% 42% 54% 40% 37% < $20 / Mo 6% 9% 5% 4% 7% 8% 7% 8% 12% Median $44.07 $40.77 $47.01 $41.46 $39.90 $42.59 $39.85 $44.39 $41.58 $0.00 $10.00 $20.00 $30.00 $40.00 $50.00 0% 10% 20% 30% 40% 50% 60% 70% 80% 90% 100%
At the same time, cost of broadband Internet access among adopters is perceived as higher than what most adopters feel is reasonable.
On average, broadband adopters feel that $32.13 would be a reasonable monthly cost for broadband, which is two-thirds of what they are currently paying.
The largest gap between actual and perceived reasonable cost is in the Willamette / Central Coast region, where the difference is $16.97, followed closely by the Portland Metro area where the gap is $16.86. These areas have relatively high rates of broadband adoption, so the monthly expense may have been incurred, on average, for a longer period of time, increasing awareness.
The smallest gap between actual cost and perceived reasonable cost is in Eastern Oregon—where users report the lowest monthly cost for high-speed Internet access in their homes—where the difference is $10.87. This area has the lowest rate of broadband penetration.
Figure 21: Perceived Reasonableness of Cost of Broadband Service (Adopters)
$10.87 $11.30 $12.00 $12.20 $12.95 $14.77 $16.86 $16.97 $15.62 $31.37 $34.60 $31.42 $33.21 $30.47 $33.41 $32.51 $31.91 $32.13 $42.24 $45.90 $43.42 $45.41 $43.42 $48.18 $49.37 $48.88 $47.75 $- $10.00 $20.00 $30.00 $40.00 $50.00 $60.00 Eastern Oregon North Central SW Oregon NW Coast Central Oregon South Central Portland Central Coast All OR Monthly Cost Reasonable Cost Difference
Perceived Cost of Service—Broadband Nonadopters
Broadband nonadopters perceive similar cost ranges as adopters report paying.
However, in several key areas of the state—Eastern and Southwest Oregon—broadband nonadopters perceive that the monthly cost is significantly higher than the actual reported costs by broadband adopters. Eastern Oregon has the lowest rate of broadband adoption in the state, and adoption in
Southwest Oregon is somewhat below the average, suggesting that perceptions of costs could contribute to the lower adoption rates.
In three other areas—North Central and South Central Oregon and the Northwest Coast—broadband nonadopters perceive that the monthly cost is significantly lower than the actual costs reported by
broadband adopters. This difference is significant in North Central Oregon, where broadband adoption is lower than average. In these areas, learning about the actual cost may be a real barrier when and if these nonadopters seek service.
Figure 22: Broadband Users’ and Nonusers’ Actual and Perceived Cost of Service
$8.17 $3.95 $3.32 $(0.07) $(0.96) $(1.37) $(5.02) $(5.12) $(0.33) $37.73 $41.46 $44.86 $48.95 $44.38 $50.74 $48.44 $47.36 $48.08 $45.90 $45.41 $48.18 $48.88 $43.42 $49.37 $43.42 $42.24 $47.75 $(10.00) $- $10.00 $20.00 $30.00 $40.00 $50.00 $60.00 North Central NW Coast South Central Central Coast Central Portland SW Oregon Eastern Oregon All OR Actual Monthly Cost (reported by broadband adopters) Perceived Cost (reported by broadband non-adopters) Difference
Satisfaction with Internet Service
Overall, Oregonians are generally satisfied with their home Internet service—33% very satisfied and 36% satisfied.
Residents are most satisfied with ease of use (84% very satisfied or satisfied) and reliability of
connection (75% very satisfied or satisfied). As expected from findings on the previous page, only two out of five (40%) are satisfied with cost of service.
Figure 23: Overall Satisfaction with Internet Service
Overall
satisfaction
with Internet
service
69%
84% satisfied
with ease of
use
75% satisfied
with reliability
of connection
73% satisfied
with
connection
speed
40% satisfied
with cost of
service
Quality of Internet varies significantly across the state and may contribute to lower adoption rates in some areas.
Overall, residents who have Internet access at home in the Portland Metro, North Central, and Central Oregon regions are the most satisfied. Adoption rates are higher than average in the Portland Metro and Central Oregon regions.
Conversely, satisfaction levels are lowest in Eastern and South Central Oregon, both areas with
relatively low broadband adoption. Connection speed is the greatest area of dissatisfaction in these two areas.
Reliability of connection is also a problem in Eastern Oregon. This may be due to problems with cable modems in this region during the time data was being collected. As this issue has been resolved, this may be less of a problem today.
Figure 24: Satisfaction with Internet Service by Region
All Central Oregon Portland North Central SW Oregon NW Coast Central Coast South Central Eastern Oregon Overall 3.92 4.00 3.96 3.95 3.91 3.88 3.85 3.80 3.71 Ease of Use 4.30 4.32 4.37 4.41 4.29 4.34 4.20 4.13 4.05 Reliability of Connection 4.05 4.09 4.12 3.99 3.99 3.94 3.96 3.98 3.83 Connection Speed 4.02 4.15 4.10 3.94 3.90 3.88 4.01 3.73 3.52 Cost of Service 3.27 3.42 3.22 3.45 3.44 3.32 3.20 3.36 3.44
Mean is based on a 5-point scale where ―1‖ indicates ―Not at all satisfied‖ and ―5‖ indicates ―Very satisfied.‖ Major category mean is an average of means of subcategories.
Conclusions
While Oregon ranks high in broadband service availability and in broadband adoption and utilization compared to other states and to the nation as a whole, it is known that a digital divide continues to exist in Oregon, and that divide cannot be successfully addressed without understanding the underlying conditions that prevent or deter Oregonians from accessing broadband service and utilizing the array of applications it offers from which they can benefit.
The Oregon Public Utility Commission conducted research to establish baseline measures of