2011 State Physician Workforce Data Book
Center for Workforce Studies
November 2011
Acknowledgments
The 2011 State Physician Workforce Data Book was produced with the help of many people. The publication was
pro-duced under the direction of Karen Jones and Sana Danish, the lead analysts responsible for compiling and organizing
the data presented in this report. Other AAMC staff who contributed to this report include Paul Jolly, Franc Slapar,
Collins Mikesell and Lingling Xie. We are grateful to Casey Tilton for his effort in assembling and checking the data
presented here.
We also owe special thanks to the AMA for making the Physician Masterfile available to the AAMC for research
pur-poses, to the AAMC Student and Applicant Studies staff for providing data on students enrolled in medical schools and
physicians training in GME, to AAMC Data Warehouse staff without whom the data analysis would not be possible, and
to the AAMC Creative Services team and the AAMC Business Services team for their design and production work.
The 2011 State Physician Workforce Data Book can be viewed and downloaded on the Internet at
www.aamc.org/workforce.
The Center for Workforce Studies welcomes your comments and suggestions for future editions of this report.
Please send comments, suggestions, or questions to:
Clese Erikson, Director
AAMC Center for Workforce Studies
[email protected]
Introduction ... 1
Key Definitions ... 2
Commonly Used Acronyms ... 3
Acknowledgments ...ii
Section 1 – Physician Supply ... 4
Key Findings ... 4
Active Physicians per 100,000 Population by Degree Type, 2010
Map 1 ... 4
Figure 1 ... 8
Table 1 ... 9
Active Patient Care Physicians per 100,000 Population by Degree Type, 2010
Figure 2 ... 10
Table 2 ... 11
Active Primary Care Physicians per 100,000 Population by Degree Type, 2010
Map 2 ... 5
Figure 3 ... 12
Table 3 ... 13
Active Patient Care Primary Care Physicians per 100,000 Population by
Degree Type, 2010
Figure 4 ... 14
Table 4 ... 15
Active Physicians Who Are Female, 2010
Figure 5 ... 16
Table 5 ... 17
Active Physicians Who Are International Medical Graduates (IMGs), 2010
Map 3 ... 6
Figure 6 ... 18
Table 6 ... 19
Active Physicians by Selected Age Groups, 2010
Figure 7 ... 20
Table 7 ... 21
Section 2 – Medical and Osteopathic School Enrollment
Key Findings ... 22
Students Enrolled in Medical or Osteopathic School for the 2010-2011 Academic Year per
100,000 Population
Map 4 ... 22
Figure 8 ... 24
Table 8 ... 25
Students Enrolled in Public Medical or Osteopathic School for the 2010-2011
Academic Year per 100,000 Population
Map 5 ... 23
Figure 9 ... 26
Table 9 ... 27
Change in Number of Students Enrolled in Medical or Osteopathic Schools, 2000-2010
Figure 10 ... 28
Table 10 ... 29
Table of
In-State Matriculation to Medical School for the 2010-2011 Academic Year
Figure 11 ... 30
Table 11 ... ...31
Section 3 – Graduate Medical Education
Key Findings ... 32
Residents and Fellows on Duty as of December 31, 2010 in ACGME-Accredited
Programs per 100,000 Population by Degree Type
Map 6 ... 32
Figure 12 ... 36
Table 12 ... 37
Residents and Fellows on Duty as of December 31, 2010 in ACGME-Accredited
Primary Care Programs per 100,000 Population by Degree Type
Map 7 ... 33
Figure 13 ... 38
Table 13 ... 39
Residents and Fellows on Duty as December 31, 2010 in ACGME-Accredited
Programs Who Are International Medical Graduates (IMGs)
Figure 14 ... 40
Table 14 ... 41
Ratio of GME to Undergraduate Medical Education (UME), Academic
Year 2009-2010
Figure 15 ... 42
Table 15 ... 43
Change in Number of Residents and Fellows in ACGME-Accredited Programs,
2000-2010
Map 8 ... 34
Map 9 ... 35
Figure 16 ... 44
Table 16 ... 45
Section 4 - Retention
Key Findings ... 46
Physicians Retained from Undergraduate Medical Education (UME)
Map 10 ... 46
Figure 17 ... 48
Table 17 ... 49
Physicians Retained from Public Undergraduate Medical Education (UME)
Figure 18 ... 50
Table 18 ... 51
Physicians Retained from Graduate Medical Education (GME)
Map 11 ... 47
Introduction
The 2011 State Physician Workforce Data Book is an update of the 2009 State Physician Workforce Data Book,
exam-ining current physician supply, medical school enrollment, and graduate medical education in the United States. The
report provides the most current data available for each state and the District of Columbia in a series of figures and
tables, including the U.S. average, state median (excluding DC)
1, and state rank. Additionally, the 2011 edition includes a
summary table that compares the state median for the physician workforce measures in 2008 and 2010.
The Data Book is divided into four sections:
Section 1: Physician Supply. This section includes data on active physicians in each state, including
physician-to-population ratios, percent female, age distribution, and type of medical education. Data by race and ethnicity were
not available.
Section 2: Medical and Osteopathic School Enrollment. This section provides information on enrollment for both
medical and osteopathic schools, as well as data on in-state matriculation. Alaska, Delaware, Idaho, Montana, and
Wyoming do not have medical schools, but four of those states (Alaska, Idaho, Montana, and Wyoming) have an
agreement with the University of Washington to reserve slots for residents of those four states at the University of
Washington School of Medicine. For this report, all students at the University of Washington Medical School are
counted in Washington and not in other states.
Section 3: Graduate Medical Education. This section presents data on physicians in residency and fellowship
posi-tions in each state, including physician-to-population ratios, degree type, and location of medical school. Data in
this section include M.D.s and D.O.s training in programs accredited by the Accreditation Council for Graduate
Medical Education (ACGME). Where possible, data for physicians training in programs accredited by the American
Osteopathic Association (AOA) are also included.
Section 4: In-State Retention. This section presents data on states’ retention of the physicians they educate in
medi-cal or osteopathic schools and train in graduate medimedi-cal education (GME) programs.
The primary data sources for this report are:
The American Medical Association (AMA) Physician Masterfile (December 31, 2010); Population estimates from the
U.S. Census Bureau; The AAMC Student Record System; The American Association of Colleges of Osteopathic Medicine;
The American Osteopathic Association; and The National GME Census, which is jointly conducted by the AAMC and
the AMA.
1 The U.S. average differs from the state median. The U.S. average is calculated by summing
the values for all 50 states and the District of Columbia, and dividing the sum by 51. The
state median, on the other hand, excludes D.C. and is the value directly in the middle of the
50 states, so 25 states are above the state median and 25 states are below the state median.
Key Definitions
Active physicians: Physicians who report working in administration, direct patient care, medical research, medical
teach-ing, or other non-patient care activities are considered active. Physicians whose major professional activity is unclassified
are also considered active. Physicians who are classified as retired, semi-retired, temporarily not in practice, not active for
other reasons, residents, or fellows are excluded.
These data refer to physicians who are active in the 50 states of the United States and the District of
Columbia—regard-less of where they attended medical or osteopathic school. Physicians active in other areas, such as Puerto Rico and other
US territories, are excluded. To determine whether or not an active physician is in the United States, the location of the
physician’s office was used. In cases where the office state was missing, the state from the preferred mailing address was
used. This substitution occurred for approximately 13 percent of cases among all active physicians.
Active patient care physicians: This group is a subset of active physicians. It comprises only those physicians whose
self-reported type of practice is direct patient care.
U.S.M.D.: Physicians who received their Doctor of Medicine (M.D.) degree from a medical school in the United States or
Puerto Rico. Graduates of Canadian medical schools are not counted as U.S.M.D.s.
D.O.: Physicians who received their Doctor of Osteopathy (D.O.) degree from a U.S. osteopathic school accredited by the
American Osteopathic Association.
International medical graduate (IMG): An individual who graduated from a medical school outside of the United States,
Puerto Rico, or Canada is considered an international medical graduate (IMG). This includes U.S. citizens who
complet-ed their mcomplet-edical complet-education outside the Unitcomplet-ed States, Puerto Rico, or Canada.
To be eligible for licensure and practice in the United States, all IMGs must be certified by the Educational Commission
for Foreign Medical Graduates (ECFMG) and complete a residency training program in the United States. Graduates of
Canadian medical schools are not considered IMGs because they do not have to be certified by the ECFMG to enter a
residency training program in the US. Please note that although graduates of Canadian medical schools who are
practic-ing in the US are not considered IMGs or U.S.M.D.s, they are included in the total for active physicians.
Primary care physicians: Physicians are counted as primary care physicians if their self-designated primary specialty
is one of the following: adolescent medicine, family medicine, general practice, geriatric medicine, internal medicine,
internal medicine/pediatrics, or pediatrics. Residents and fellows are counted as primary care residents and fellows if
they are in one of the following programs: adolescent medicine (pediatrics), family medicine, geriatric medicine (family
medicine), geriatric medicine (internal medicine), geriatric medicine/family practice, geriatric medicine/internal
medi-cine, internal medimedi-cine, internal medicine/family practice, internal medicine/pediatrics or pediatrics. In the 2009 State
Physician Workforce Data Book the residency program of internal medicine/preventive medicine was considered primary
care, but it is not in this edition. There are 29 residents in internal medicine/preventive medicine program in 2010.
Residents: Physicians who have completed undergraduate medical education and are at any level of training in an
Medical school: A school that confers the Doctor of Medicine (M.D.) degree and is accredited by the Liaison Committee
on Medical Education.
Osteopathic school: A school that confers the Doctor of Osteopathy (D.O.) degree and is accredited by the American
Osteopathic Association.
Commonly Used Acronyms
AACOM
Association of American Colleges of Osteopathic Medicine
AAMC
Association of American Medical Colleges
ACGME
Accreditation Council for Graduate Medical Education
AMA
American Medical Association
AOA
American Osteopathic Association
DO
Doctor of Osteopathy
GME
Graduate Medical Education
IMG
International Medical Graduate
MD
Doctor of Medicine
OGME
Osteopathic Graduate Medical Education
UME
Undergraduate Medical Education
Section 1 – Physician Supply
Key Findings – Physician Supply
• In 2010, there were 258.7 active physicians per 100,000 population in the United States, ranging from a high of
415.5 in Massachusetts to a low of 176.4 in Mississippi. The states with the highest number of physicians per
100,000 population were concentrated in the northeast (see Map 1, Figure 1, and Table 1).
Map 1. Total Active Physicians per 100,000 Population, 2010
Source: July 1, 2010 population estimates are from the U.S. Census Bureau (Release date: February, 2011). Physician data are from
the AMA Physician Masterfile (December 31, 2010).
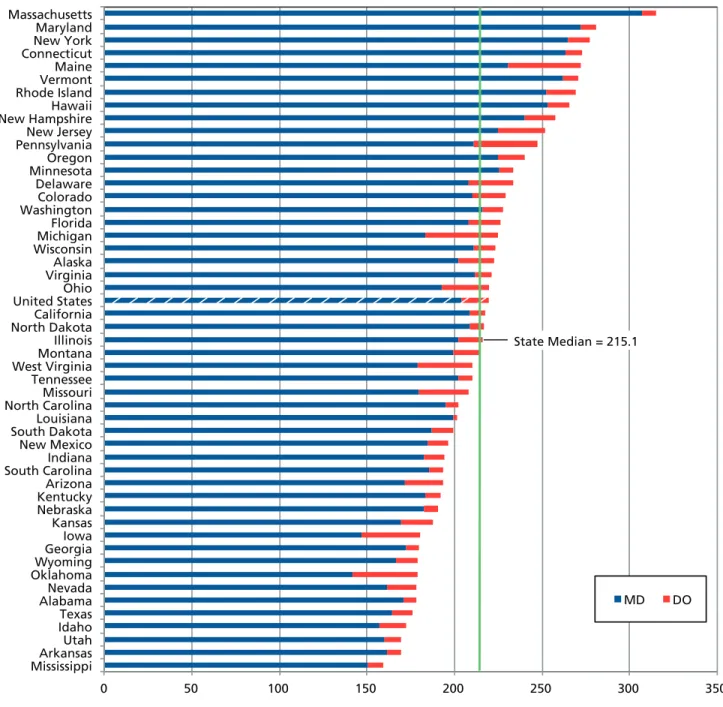
• Nationally in 2010, there were 219.5 physicians active in patient care
2per 100,000 population. Massachusetts had the
highest number of patient care physicians per 100,000 population (314.8), while Mississippi had the lowest (159.4) (see
Figure 2 and Table 2).
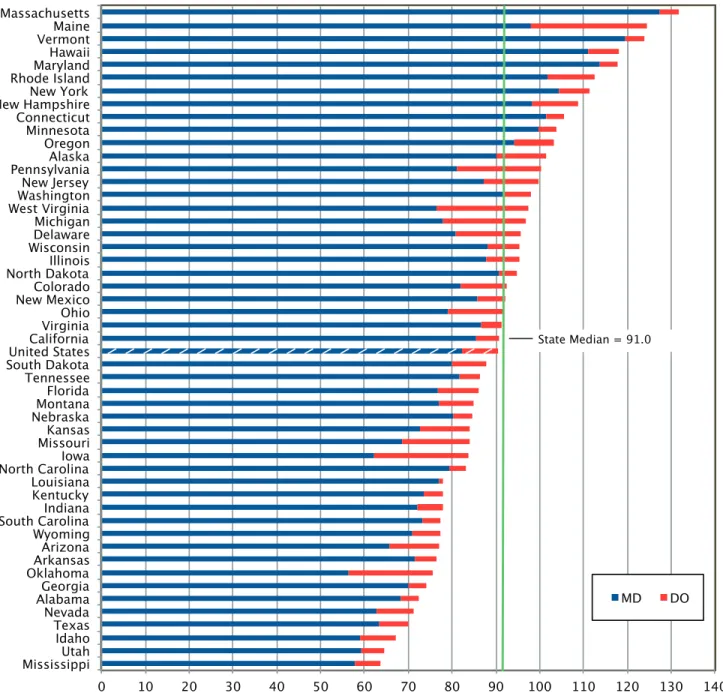
• There were 90.5 primary care physicians per 100,000 population in the United States in 2010. Once again,
Massachusetts ranked highest with 132.0 while Mississippi had the lowest number of primary care physicians per
100,000 population (63.6). The distribution of primary care physicians per 100,000 population was very similar to the
distribution of all physicians per 100,000 population (see Map 2, Figure 3, and Table 3).
Map 2. Primary Care Physicians per 100,000 Population, 2010
Source: July 1, 2010 population estimates are from the U.S. Census Bureau (Release date: February, 2011). Physician data are from
the AMA Physician Masterfile (December 31, 2010).
2 This refers to physicians whose type of practice is categorized as patient care. Physicians whose type of practice is administration, medical research, medical teaching, or other non-patient care activities are not included here.
Section 1 – Physician Supply
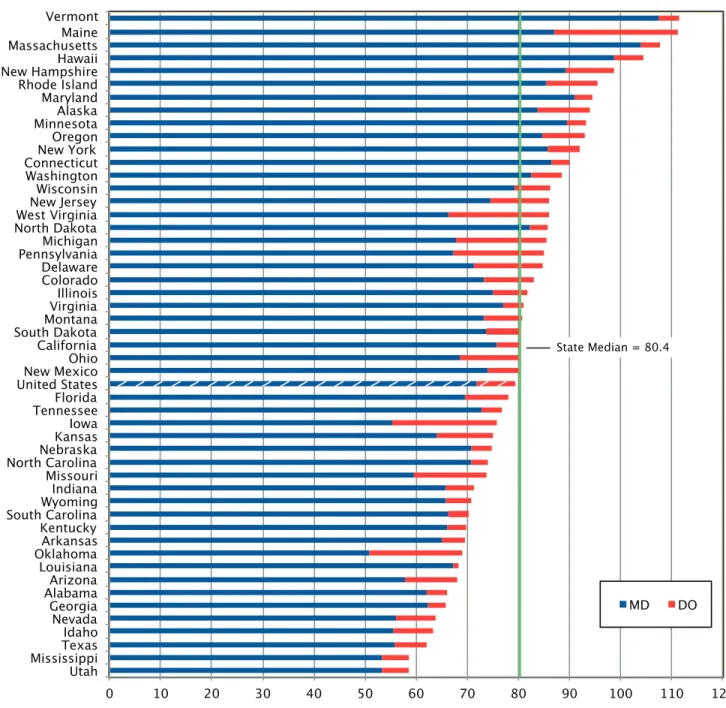
• In 2010, there were 79.4 primary care physicians active in patient care per 100,000 population in the United States,
ranging from a low of 58.4 in Utah to a high of 111.5 in Vermont. In Oklahoma and Iowa, D.O.s represented more
than one quarter of the patient care primary care physicians. Nationally, D.O.s comprised approximately 10 percent of
active patient care primary care physicians (see Figure 4 and Table 4).
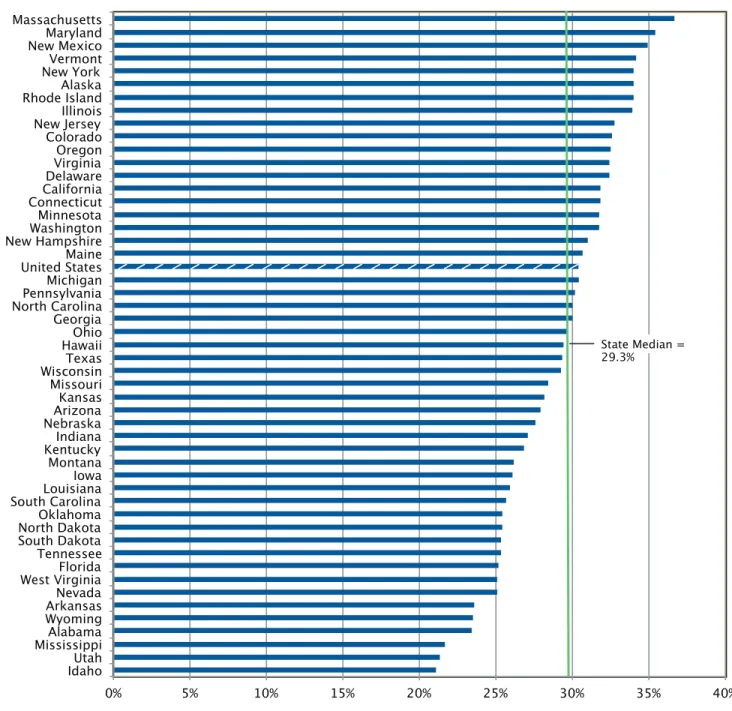
• In 2010, more than one third (36.6 percent) of active physicians in Massachusetts were female. Idaho had the
low-est percentage of female physicians (21.0). Nationally, 30.4 percent of active physicians were female (see Figure 5 and
Table 5).
• In 2010, states varied widely in the percentage of their physician workforce that graduated from an international
medi-cal school
3(see Map 3, Figure 6, and Table 6). Nationally, 24.0 percent of the physician workforce was IMGs. New
Jersey and New York had the highest percentages (39.1 and 38.3 percent, respectively), while Montana and Idaho had
the lowest (4.6 and 4.0 percent, respectively).
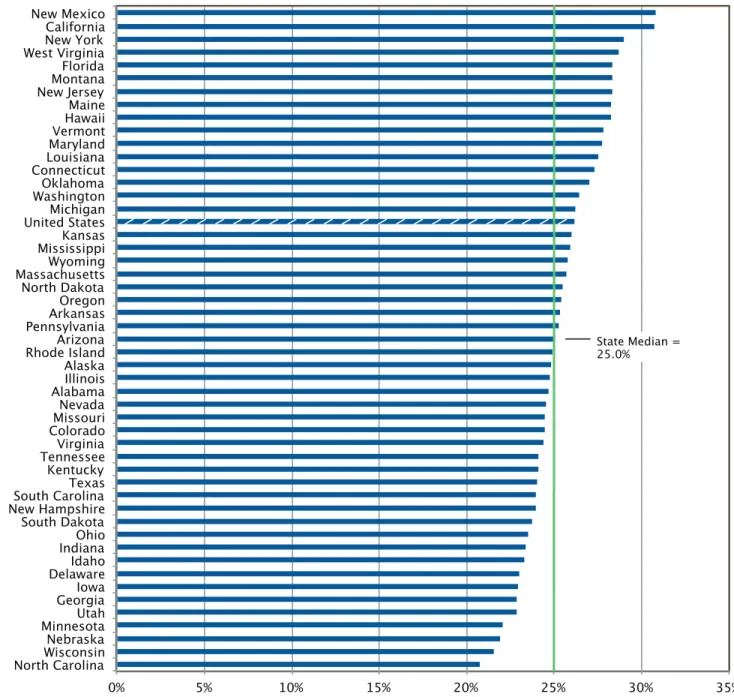
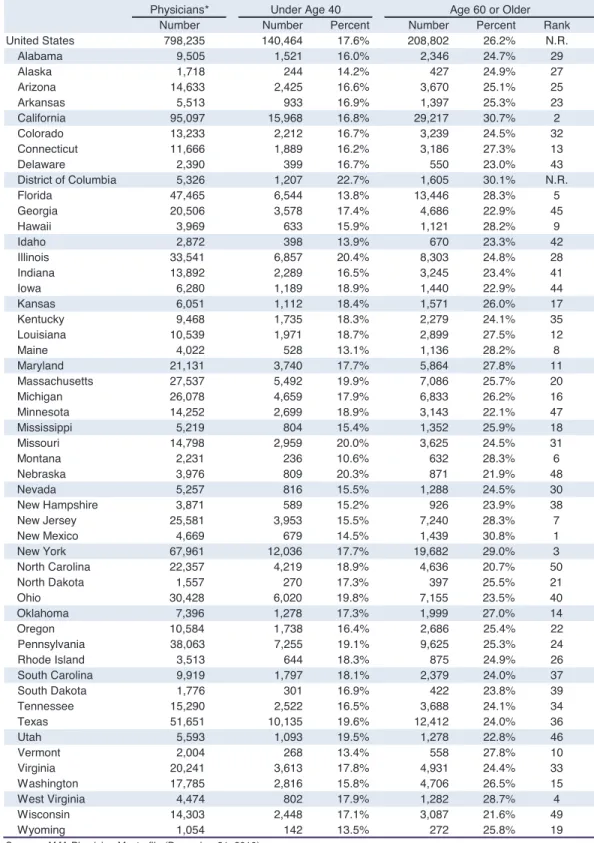
• Nationally, over one fourth (26.3 percent) of the active physician workforce was age 60 or older. There was some
varia-tion among the states in the percentage of physicians who were age 60 or older in 2010. New Mexico had the highest
percentage (30.8), while North Carolina had the lowest percentage (20.8) (see Figure 7 and Table 7).
Section 1 – Physician Supply
Figure 1. Active Physicians per 100,000 Population by Degree Type, 2010
Sources: July 1, 2010 population estimates are from the U.S. Census Bureau (Release date: February 2011). Physician data are
from the 2011 AMA Physician Masterfile (December 31, 2010). Physicians whose medical school type was not available are excluded (n=67).
0 50 100 150 200 250 300 350 400 450
MississippiIdaho Arkansas WyomingUtah Nevada OklahomaAlabama Texas GeorgiaIowa Kansas Indiana South CarolinaSouth Dakota Kentucky NebraskaArizona Montana New MexicoLouisiana North CarolinaNorth Dakota TennesseeAlaska West VirginiaMissouri WisconsinFlorida Virginia California United StatesIllinois Colorado WashingtonOhio Michigan Delaware MinnesotaOregon New HampshireNew Jersey PennsylvaniaHawaii Maine Vermont Connecticut Rhode IslandNew York Maryland Massachusetts
MD DO
State Median = 244.2
Figure 1. Active Physicians per 100,000 Population by Degree Type, 2010
Table 1. Active Physicians per 100,000 Population by Degree Type, 2010
Total Rate per Rate per Rate per
Population Number 100,000 Rank Number 100,000 Number 100,000 United States 309,050,816 799,509 258.7 N.R. 744,224 240.8 55,218 17.9
Alabama 4,729,656 9,508 201.0 43 9,126 193.0 382 8.1
Alaska 708,862 1,721 242.8 26 1,565 220.8 156 22.0
Arizona 6,676,627 14,694 220.1 33 13,027 195.1 1,665 24.9
Arkansas 2,910,236 5,518 189.6 48 5,265 180.9 253 8.7
California 37,266,600 95,198 255.5 20 91,497 245.5 3,697 9.9 Colorado 5,095,309 13,243 259.9 18 12,202 239.5 1,041 20.4 Connecticut 3,526,937 11,678 331.1 5 11,282 319.9 396 11.2
Delaware 891,464 2,393 268.4 14 2,124 238.3 269 30.2
District of Columbia 610,589 5,327 872.4 N.R. 5,211 853.4 116 19.0 Florida 18,678,049 47,590 254.8 22 43,651 233.7 3,933 21.1 Georgia 9,908,357 20,511 207.0 41 19,674 198.6 836 8.4
Hawaii 1,300,086 3,970 305.4 8 3,782 290.9 188 14.5
Idaho 1,559,796 2,873 184.2 49 2,610 167.3 263 16.9
Illinois 12,944,410 33,594 259.5 19 31,421 242.7 2,170 16.8 Indiana 6,445,295 13,900 215.7 38 13,052 202.5 847 13.1
Iowa 3,023,081 6,294 208.2 40 5,204 172.1 1,090 36.1
Kansas 2,841,121 6,058 213.2 39 5,467 192.4 591 20.8
Kentucky 4,339,435 9,479 218.4 35 9,039 208.3 439 10.1 Louisiana 4,529,426 10,541 232.7 30 10,425 230.2 116 2.6
Maine 1,312,939 4,031 307.0 7 3,420 260.5 611 46.5
Maryland 5,737,274 21,153 368.7 2 20,511 357.5 641 11.2 Massachusetts 6,631,280 27,550 415.5 1 26,912 405.8 627 9.5 Michigan 9,931,235 26,325 265.1 15 21,595 217.4 4,727 47.6 Minnesota 5,290,447 14,262 269.6 13 13,791 260.7 470 8.9 Mississippi 2,960,467 5,221 176.4 50 4,916 166.1 304 10.3 Missouri 6,011,741 14,825 246.6 24 12,932 215.1 1,892 31.5
Montana 980,152 2,232 227.7 32 2,077 211.9 155 15.8
Nebraska 1,811,072 3,981 219.8 34 3,829 211.4 150 8.3
Nevada 2,654,751 5,264 198.3 45 4,771 179.7 493 18.6
New Hampshire 1,323,531 3,872 292.6 11 3,613 273.0 257 19.4 New Jersey 8,732,811 25,629 293.5 10 23,000 263.4 2,629 30.1 New Mexico 2,033,875 4,673 229.8 31 4,418 217.2 255 12.5 New York 19,577,730 68,042 347.5 3 64,943 331.7 3,093 15.8 North Carolina 9,458,888 22,367 236.5 29 21,561 227.9 806 8.5 North Dakota 653,778 1,558 238.3 28 1,499 229.3 59 9.0 Ohio 11,532,111 30,485 264.3 16 26,819 232.6 3,665 31.8 Oklahoma 3,724,447 7,406 198.8 44 5,873 157.7 1,532 41.1
Oregon 3,855,536 10,594 274.8 12 9,967 258.5 627 16.3
Pennsylvania 12,632,780 38,207 302.4 9 32,857 260.1 5,348 42.3 Rhode Island 1,056,870 3,515 332.6 4 3,303 312.5 210 19.9 South Carolina 4,596,958 9,922 215.8 37 9,485 206.3 437 9.5 South Dakota 820,077 1,779 216.9 36 1,662 202.7 117 14.3 Tennessee 6,338,112 15,302 241.4 27 14,720 232.2 581 9.2 Texas 25,213,445 51,691 205.0 42 48,255 191.4 3,435 13.6
Utah 2,830,753 5,598 197.8 46 5,288 186.8 310 11.0
Vermont 622,433 2,008 322.6 6 1,945 312.5 63 10.1
Virginia 7,952,119 20,270 254.9 21 19,426 244.3 842 10.6 Washington 6,746,199 17,796 263.8 17 16,910 250.7 878 13.0 West Virginia 1,825,513 4,485 245.7 25 3,815 209.0 670 36.7 Wisconsin 5,668,519 14,319 252.6 23 13,512 238.4 804 14.2
Wyoming 547,637 1,057 193.0 47 975 178.0 82 15.0
N.R. = Not Ranked
* Physicians whose medical school type was unavailable (n=67) are included in the total.
Total Active Physicians* Active M.D.s Active D.O.s
Sources: July 1, 2010 population estimates are from the U.S. Census Bureau (Release date: February 2011). Physician data are from the 2011 AMA Physician Masterfile (December 31, 2010).
Section 1 – Physician Supply
Figure 2. Active Patient Care Physicians per 100,000 Population by Degree Type, 2010
Sources: July 1, 2010 population estimates are from the U.S. Census Bureau (Release date: February 2011). Physician data are
from the 2011 AMA Physician Masterfile (December 31, 2010). Physicians whose medical school type was not available are excluded (n=29).
0 50 100 150 200 250 300 350
MississippiArkansas Utah IdahoTexas AlabamaNevada OklahomaWyoming GeorgiaIowa Kansas Nebraska KentuckyArizona South CarolinaIndiana New Mexico South DakotaLouisiana North CarolinaMissouri Tennessee West VirginiaMontana Illinois North DakotaCalifornia United StatesOhio VirginiaAlaska WisconsinMichigan Florida WashingtonColorado Delaware MinnesotaOregon PennsylvaniaNew Jersey New HampshireHawaii Rhode IslandVermont Maine ConnecticutNew York Maryland Massachusetts
MD DO State Median = 215.1
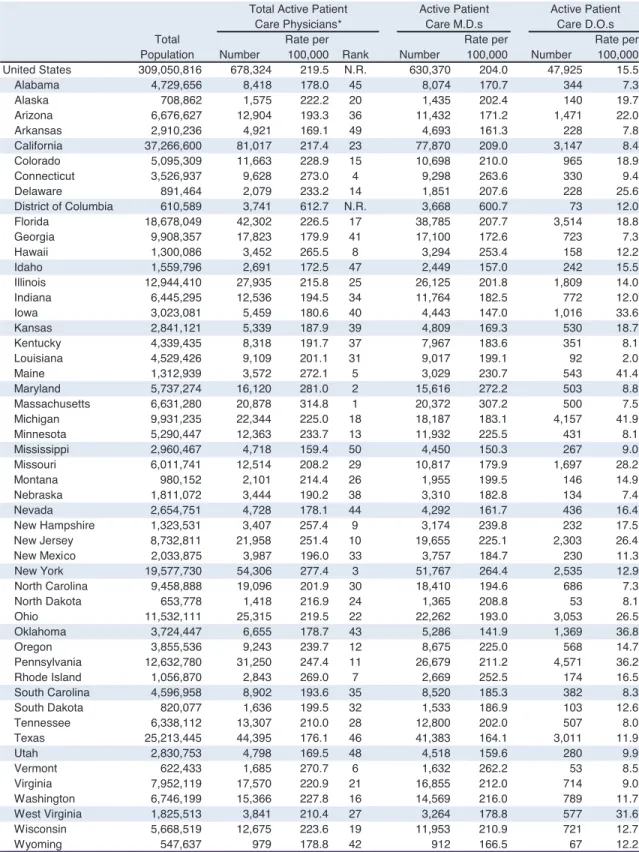
Table 2. Active Patient Care Physicians per 100,000 Popluation by Degree Type, 2010
Table 2. Active Patient Care Physicians per 100,000 Population by Degree Type, 2010Total Rate per Rate per Rate per
Population Number 100,000 Rank Number 100,000 Number 100,000 United States 309,050,816 678,324 219.5 N.R. 630,370 204.0 47,925 15.5
Alabama 4,729,656 8,418 178.0 45 8,074 170.7 344 7.3
Alaska 708,862 1,575 222.2 20 1,435 202.4 140 19.7
Arizona 6,676,627 12,904 193.3 36 11,432 171.2 1,471 22.0
Arkansas 2,910,236 4,921 169.1 49 4,693 161.3 228 7.8
California 37,266,600 81,017 217.4 23 77,870 209.0 3,147 8.4 Colorado 5,095,309 11,663 228.9 15 10,698 210.0 965 18.9
Connecticut 3,526,937 9,628 273.0 4 9,298 263.6 330 9.4
Delaware 891,464 2,079 233.2 14 1,851 207.6 228 25.6
District of Columbia 610,589 3,741 612.7 N.R. 3,668 600.7 73 12.0 Florida 18,678,049 42,302 226.5 17 38,785 207.7 3,514 18.8
Georgia 9,908,357 17,823 179.9 41 17,100 172.6 723 7.3
Hawaii 1,300,086 3,452 265.5 8 3,294 253.4 158 12.2
Idaho 1,559,796 2,691 172.5 47 2,449 157.0 242 15.5
Illinois 12,944,410 27,935 215.8 25 26,125 201.8 1,809 14.0
Indiana 6,445,295 12,536 194.5 34 11,764 182.5 772 12.0
Iowa 3,023,081 5,459 180.6 40 4,443 147.0 1,016 33.6
Kansas 2,841,121 5,339 187.9 39 4,809 169.3 530 18.7
Kentucky 4,339,435 8,318 191.7 37 7,967 183.6 351 8.1
Louisiana 4,529,426 9,109 201.1 31 9,017 199.1 92 2.0
Maine 1,312,939 3,572 272.1 5 3,029 230.7 543 41.4
Maryland 5,737,274 16,120 281.0 2 15,616 272.2 503 8.8
Massachusetts 6,631,280 20,878 314.8 1 20,372 307.2 500 7.5 Michigan 9,931,235 22,344 225.0 18 18,187 183.1 4,157 41.9 Minnesota 5,290,447 12,363 233.7 13 11,932 225.5 431 8.1 Mississippi 2,960,467 4,718 159.4 50 4,450 150.3 267 9.0 Missouri 6,011,741 12,514 208.2 29 10,817 179.9 1,697 28.2
Montana 980,152 2,101 214.4 26 1,955 199.5 146 14.9
Nebraska 1,811,072 3,444 190.2 38 3,310 182.8 134 7.4
Nevada 2,654,751 4,728 178.1 44 4,292 161.7 436 16.4
New Hampshire 1,323,531 3,407 257.4 9 3,174 239.8 232 17.5 New Jersey 8,732,811 21,958 251.4 10 19,655 225.1 2,303 26.4 New Mexico 2,033,875 3,987 196.0 33 3,757 184.7 230 11.3 New York 19,577,730 54,306 277.4 3 51,767 264.4 2,535 12.9 North Carolina 9,458,888 19,096 201.9 30 18,410 194.6 686 7.3
North Dakota 653,778 1,418 216.9 24 1,365 208.8 53 8.1
Ohio 11,532,111 25,315 219.5 22 22,262 193.0 3,053 26.5
Oklahoma 3,724,447 6,655 178.7 43 5,286 141.9 1,369 36.8
Oregon 3,855,536 9,243 239.7 12 8,675 225.0 568 14.7
Pennsylvania 12,632,780 31,250 247.4 11 26,679 211.2 4,571 36.2 Rhode Island 1,056,870 2,843 269.0 7 2,669 252.5 174 16.5 South Carolina 4,596,958 8,902 193.6 35 8,520 185.3 382 8.3 South Dakota 820,077 1,636 199.5 32 1,533 186.9 103 12.6
Tennessee 6,338,112 13,307 210.0 28 12,800 202.0 507 8.0
Texas 25,213,445 44,395 176.1 46 41,383 164.1 3,011 11.9
Utah 2,830,753 4,798 169.5 48 4,518 159.6 280 9.9
Vermont 622,433 1,685 270.7 6 1,632 262.2 53 8.5
Virginia 7,952,119 17,570 220.9 21 16,855 212.0 714 9.0
Washington 6,746,199 15,366 227.8 16 14,569 216.0 789 11.7 West Virginia 1,825,513 3,841 210.4 27 3,264 178.8 577 31.6 Wisconsin 5,668,519 12,675 223.6 19 11,953 210.9 721 12.7
Wyoming 547,637 979 178.8 42 912 166.5 67 12.2
N.R. = Not Ranked
Sources: July 1, 2010 population estimates are from the U.S. Census Bureau (Release date: February 2011). Physician data are from the AMA Physician Masterfile (December 31, 2010).
Care M.D.s Care D.O.s Active Patient Active Patient Total Active Patient
Care Physicians*
Section 1 – Physician Supply
Figure 3. Active
Primary Care
Physicians per 100,000 Population by Degree Type, 2010Sources: July 1, 2010 population estimates are from the U.S. Census Bureau (Release date: February 2011). Physician data are
from the 2011 AMA Physician Masterfile (December 31, 2010). Physicians whose medical school type was unavailable are excluded (n=29).
0 10 20 30 40 50 60 70 80 90 100 110 120 130 140
MississippiUtah Idaho Texas Nevada AlabamaGeorgia OklahomaArkansas Arizona Wyoming South CarolinaIndiana Kentucky Louisiana North CarolinaIowa MissouriKansas NebraskaMontana Florida Tennessee South DakotaUnited States CaliforniaVirginia Ohio New MexicoColorado North DakotaIllinois WisconsinDelaware Michigan West VirginiaWashington New Jersey PennsylvaniaAlaska Oregon Minnesota Connecticut New HampshireNew York Rhode IslandMaryland Hawaii VermontMaine Massachusetts
MD DO
State Median = 91.0
Figure 3. Active Primary Care Physicians per 100,000 Population by Degree Type, 2010
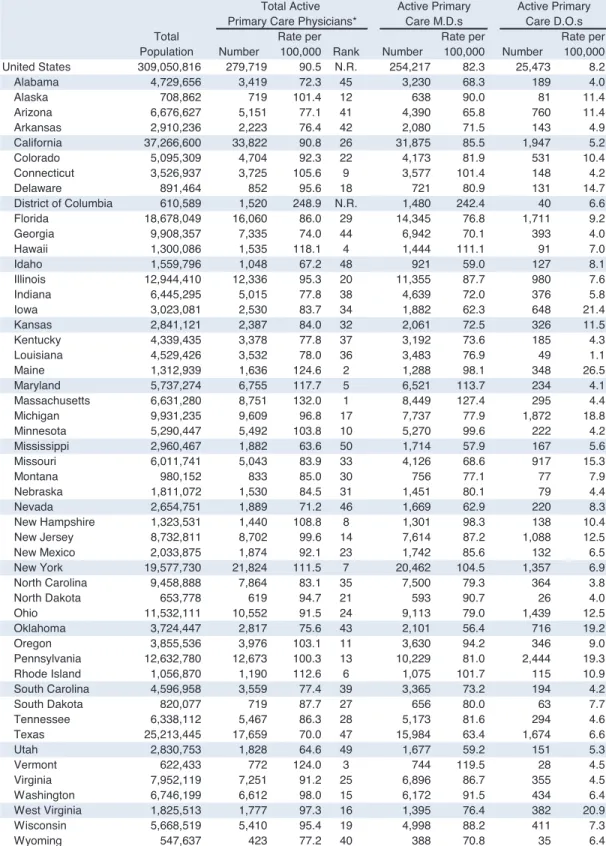
Table 3. Active Primary Care Physicians per 100,000 Population by Degree Type, 2010
Table 3. Active Primary Care Physicians per 100,000 Population by Degree Type, 2010Total Rate per Rate per Rate per
Population Number 100,000 Rank Number 100,000 Number 100,000 United States 309,050,816 279,719 90.5 N.R. 254,217 82.3 25,473 8.2
Alabama 4,729,656 3,419 72.3 45 3,230 68.3 189 4.0
Alaska 708,862 719 101.4 12 638 90.0 81 11.4
Arizona 6,676,627 5,151 77.1 41 4,390 65.8 760 11.4
Arkansas 2,910,236 2,223 76.4 42 2,080 71.5 143 4.9
California 37,266,600 33,822 90.8 26 31,875 85.5 1,947 5.2
Colorado 5,095,309 4,704 92.3 22 4,173 81.9 531 10.4
Connecticut 3,526,937 3,725 105.6 9 3,577 101.4 148 4.2
Delaware 891,464 852 95.6 18 721 80.9 131 14.7
District of Columbia 610,589 1,520 248.9 N.R. 1,480 242.4 40 6.6 Florida 18,678,049 16,060 86.0 29 14,345 76.8 1,711 9.2
Georgia 9,908,357 7,335 74.0 44 6,942 70.1 393 4.0
Hawaii 1,300,086 1,535 118.1 4 1,444 111.1 91 7.0
Idaho 1,559,796 1,048 67.2 48 921 59.0 127 8.1
Illinois 12,944,410 12,336 95.3 20 11,355 87.7 980 7.6
Indiana 6,445,295 5,015 77.8 38 4,639 72.0 376 5.8
Iowa 3,023,081 2,530 83.7 34 1,882 62.3 648 21.4
Kansas 2,841,121 2,387 84.0 32 2,061 72.5 326 11.5
Kentucky 4,339,435 3,378 77.8 37 3,192 73.6 185 4.3
Louisiana 4,529,426 3,532 78.0 36 3,483 76.9 49 1.1
Maine 1,312,939 1,636 124.6 2 1,288 98.1 348 26.5
Maryland 5,737,274 6,755 117.7 5 6,521 113.7 234 4.1
Massachusetts 6,631,280 8,751 132.0 1 8,449 127.4 295 4.4 Michigan 9,931,235 9,609 96.8 17 7,737 77.9 1,872 18.8
Minnesota 5,290,447 5,492 103.8 10 5,270 99.6 222 4.2
Mississippi 2,960,467 1,882 63.6 50 1,714 57.9 167 5.6
Missouri 6,011,741 5,043 83.9 33 4,126 68.6 917 15.3
Montana 980,152 833 85.0 30 756 77.1 77 7.9
Nebraska 1,811,072 1,530 84.5 31 1,451 80.1 79 4.4
Nevada 2,654,751 1,889 71.2 46 1,669 62.9 220 8.3
New Hampshire 1,323,531 1,440 108.8 8 1,301 98.3 138 10.4 New Jersey 8,732,811 8,702 99.6 14 7,614 87.2 1,088 12.5
New Mexico 2,033,875 1,874 92.1 23 1,742 85.6 132 6.5
New York 19,577,730 21,824 111.5 7 20,462 104.5 1,357 6.9 North Carolina 9,458,888 7,864 83.1 35 7,500 79.3 364 3.8
North Dakota 653,778 619 94.7 21 593 90.7 26 4.0
Ohio 11,532,111 10,552 91.5 24 9,113 79.0 1,439 12.5
Oklahoma 3,724,447 2,817 75.6 43 2,101 56.4 716 19.2
Oregon 3,855,536 3,976 103.1 11 3,630 94.2 346 9.0
Pennsylvania 12,632,780 12,673 100.3 13 10,229 81.0 2,444 19.3 Rhode Island 1,056,870 1,190 112.6 6 1,075 101.7 115 10.9 South Carolina 4,596,958 3,559 77.4 39 3,365 73.2 194 4.2
South Dakota 820,077 719 87.7 27 656 80.0 63 7.7
Tennessee 6,338,112 5,467 86.3 28 5,173 81.6 294 4.6
Texas 25,213,445 17,659 70.0 47 15,984 63.4 1,674 6.6
Utah 2,830,753 1,828 64.6 49 1,677 59.2 151 5.3
Vermont 622,433 772 124.0 3 744 119.5 28 4.5
Virginia 7,952,119 7,251 91.2 25 6,896 86.7 355 4.5
Washington 6,746,199 6,612 98.0 15 6,172 91.5 434 6.4
West Virginia 1,825,513 1,777 97.3 16 1,395 76.4 382 20.9
Wisconsin 5,668,519 5,410 95.4 19 4,998 88.2 411 7.3
Wyoming 547,637 423 77.2 40 388 70.8 35 6.4
N.R. = Not Ranked
Sources: July 1, 2010 population estimates are from the U.S. Census Bureau (Release date: February 2011). Physician data are from the AMA Physician Masterfile (December 31, 2010).
Primary Care Physicians*Total Active Active PrimaryCare M.D.s Active PrimaryCare D.O.s
Section 1 – Physician Supply
Figure 4. Active Patient Care Primary Care Physicians per 100,000 Population by Degree Type, 2010
Sources: July 1, 2010 population estimates are from the U.S. Census Bureau (Release date: February 2011). Physician data are
from the 2011 AMA Physician Masterfile (December 31, 2010). Physicians whose medical school type was unavailable are excluded (n=22).
0 10 20 30 40 50 60 70 80 90 100 110 120
Utah MississippiTexas Idaho Nevada Georgia AlabamaArizona Louisiana OklahomaArkansas Kentucky South CarolinaWyoming Indiana Missouri North CarolinaNebraska KansasIowa TennesseeFlorida United StatesNew Mexico Ohio California South DakotaMontana VirginiaIllinois Colorado Delaware PennsylvaniaMichigan North DakotaWest Virginia New JerseyWisconsin Washington ConnecticutNew York Oregon MinnesotaAlaska Maryland Rhode Island New HampshireHawaii MassachusettsMaine
MD DO
State Median = 80.4 Vermont
Table 4. Active Patient Care Primary Care Physicians 100,000 Population by Degree Type, 2010
Table 4. Active Patient Care Primary Care Physicians 100,000 Population by Degree Type, 2010Total Rate per Rate per Rate per
Population Number 100,000 Rank Number 100,000 Number 100,000 United States 309,050,816 245,367 79.4 N.R. 221,999 71.8 23,346 7.6
Alabama 4,729,656 3,120 66.0 44 2,940 62.2 180 3.8
Alaska 708,862 667 94.1 8 594 83.8 73 10.3
Arizona 6,676,627 4,544 68.1 43 3,857 57.8 686 10.3
Arkansas 2,910,236 2,026 69.6 40 1,892 65.0 134 4.6
California 37,266,600 29,968 80.4 26 28,240 75.8 1,728 4.6
Colorado 5,095,309 4,229 83.0 21 3,727 73.1 502 9.9
Connecticut 3,526,937 3,172 89.9 12 3,049 86.4 123 3.5
Delaware 891,464 755 84.7 20 636 71.3 119 13.3
District of Columbia 610,589 1,110 181.8 N.R. 1,084 177.5 26 4.3 Florida 18,678,049 14,582 78.1 29 12,986 69.5 1,594 8.5
Georgia 9,908,357 6,516 65.8 45 6,167 62.2 349 3.5
Hawaii 1,300,086 1,358 104.5 4 1,282 98.6 76 5.8
Idaho 1,559,796 987 63.3 47 865 55.5 122 7.8
Illinois 12,944,410 10,591 81.8 22 9,717 75.1 873 6.7
Indiana 6,445,295 4,588 71.2 36 4,238 65.8 350 5.4
Iowa 3,023,081 2,288 75.7 31 1,672 55.3 616 20.4
Kansas 2,841,121 2,128 74.9 32 1,822 64.1 306 10.8
Kentucky 4,339,435 3,028 69.8 39 2,863 66.0 165 3.8
Louisiana 4,529,426 3,094 68.3 42 3,051 67.4 43 0.9
Maine 1,312,939 1,459 111.1 2 1,143 87.1 316 24.1
Maryland 5,737,274 5,427 94.6 7 5,220 91.0 207 3.6
Massachusetts 6,631,280 7,144 107.7 3 6,891 103.9 249 3.8 Michigan 9,931,235 8,487 85.5 18 6,729 67.8 1,758 17.7
Minnesota 5,290,447 4,938 93.3 9 4,734 89.5 204 3.9
Mississippi 2,960,467 1,732 58.5 49 1,575 53.2 156 5.3
Missouri 6,011,741 4,441 73.9 35 3,581 59.6 860 14.3
Montana 980,152 792 80.8 24 717 73.2 75 7.7
Nebraska 1,811,072 1,356 74.9 33 1,284 70.9 72 4.0
Nevada 2,654,751 1,691 63.7 46 1,486 56.0 205 7.7
New Hampshire 1,323,531 1,308 98.8 5 1,182 89.3 125 9.4 New Jersey 8,732,811 7,506 86.0 15 6,500 74.4 1,006 11.5
New Mexico 2,033,875 1,626 79.9 28 1,503 73.9 123 6.0
New York 19,577,730 17,989 91.9 11 16,782 85.7 1,203 6.1 North Carolina 9,458,888 7,011 74.1 34 6,684 70.7 327 3.5
North Dakota 653,778 561 85.8 17 537 82.1 24 3.7
Ohio 11,532,111 9,227 80.0 27 7,900 68.5 1,327 11.5
Oklahoma 3,724,447 2,571 69.0 41 1,892 50.8 679 18.2
Oregon 3,855,536 3,589 93.1 10 3,268 84.8 321 8.3
Pennsylvania 12,632,780 10,749 85.1 19 8,515 67.4 2,234 17.7
Rhode Island 1,056,870 1,009 95.5 6 904 85.5 105 9.9
South Carolina 4,596,958 3,231 70.3 38 3,052 66.4 179 3.9
South Dakota 820,077 660 80.5 25 604 73.7 56 6.8
Tennessee 6,338,112 4,872 76.9 30 4,605 72.7 267 4.2
Texas 25,213,445 15,633 62.0 48 14,097 55.9 1,535 6.1
Utah 2,830,753 1,654 58.4 50 1,510 53.3 144 5.1
Vermont 622,433 694 111.5 1 668 107.3 26 4.2
Virginia 7,952,119 6,446 81.1 23 6,128 77.1 318 4.0
Washington 6,746,199 5,971 88.5 13 5,561 82.4 404 6.0
West Virginia 1,825,513 1,568 85.9 16 1,208 66.2 360 19.7
Wisconsin 5,668,519 4,887 86.2 14 4,497 79.3 389 6.9
Wyoming 547,637 387 70.7 37 360 65.7 27 4.9
N.R. = Not Ranked
* Physicians whose medical school type was unavailable (n=22) are included in the total.
Sources: July 1, 2010 population estimates are from the U.S. Census Bureau (Release date: February 2011). Physician data are from the AMA Physician Masterfile (December 31, 2010).
Care Physicians* Care M.D.s Care D.O.s Total Active Active Patient Active Patient Patient Care Primary Care Primary Care Primary
Section 1 – Physician Supply
Figure 5. Percentage of Active Physicians Who Are Female, 2010
Source: AMA Physician Masterfile (December 31, 2010). Physicians whose sex was unavailable (n=1,104) are excluded.
0% 5% 10% 15% 20% 25% 30% 35% 40%
IdahoUtah MississippiAlabama Wyoming ArkansasNevada West VirginiaFlorida Tennessee South Dakota North DakotaOklahoma South CarolinaLouisiana Iowa Montana KentuckyIndiana NebraskaArizona Kansas Missouri WisconsinTexas HawaiiOhio Georgia North CarolinaPennsylvania Michigan United StatesMaine New HampshireWashington Minnesota ConnecticutCalifornia DelawareVirginia Oregon Colorado New JerseyIllinois Rhode IslandAlaska New YorkVermont New MexicoMaryland Massachusetts
State Median = 29.3%
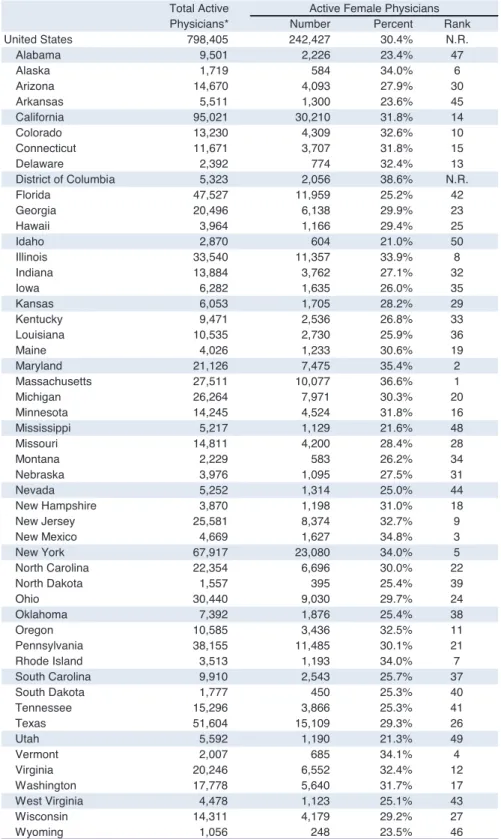
Table 5. Active Female Physicians, 2010
Table 5. Active Female Physicians, 2010Total Active
Physicians* Number Percent Rank
United States 798,405 242,427 30.4% N.R.
Alabama 9,501 2,226 23.4% 47
Alaska 1,719 584 34.0% 6
Arizona 14,670 4,093 27.9% 30
Arkansas 5,511 1,300 23.6% 45
California 95,021 30,210 31.8% 14
Colorado 13,230 4,309 32.6% 10
Connecticut 11,671 3,707 31.8% 15
Delaware 2,392 774 32.4% 13
District of Columbia 5,323 2,056 38.6% N.R.
Florida 47,527 11,959 25.2% 42
Georgia 20,496 6,138 29.9% 23
Hawaii 3,964 1,166 29.4% 25
Idaho 2,870 604 21.0% 50
Illinois 33,540 11,357 33.9% 8
Indiana 13,884 3,762 27.1% 32
Iowa 6,282 1,635 26.0% 35
Kansas 6,053 1,705 28.2% 29
Kentucky 9,471 2,536 26.8% 33
Louisiana 10,535 2,730 25.9% 36
Maine 4,026 1,233 30.6% 19
Maryland 21,126 7,475 35.4% 2
Massachusetts 27,511 10,077 36.6% 1
Michigan 26,264 7,971 30.3% 20
Minnesota 14,245 4,524 31.8% 16
Mississippi 5,217 1,129 21.6% 48
Missouri 14,811 4,200 28.4% 28
Montana 2,229 583 26.2% 34
Nebraska 3,976 1,095 27.5% 31
Nevada 5,252 1,314 25.0% 44
New Hampshire 3,870 1,198 31.0% 18
New Jersey 25,581 8,374 32.7% 9
New Mexico 4,669 1,627 34.8% 3
New York 67,917 23,080 34.0% 5
North Carolina 22,354 6,696 30.0% 22
North Dakota 1,557 395 25.4% 39
Ohio 30,440 9,030 29.7% 24
Oklahoma 7,392 1,876 25.4% 38
Oregon 10,585 3,436 32.5% 11
Pennsylvania 38,155 11,485 30.1% 21
Rhode Island 3,513 1,193 34.0% 7
South Carolina 9,910 2,543 25.7% 37
South Dakota 1,777 450 25.3% 40
Tennessee 15,296 3,866 25.3% 41
Texas 51,604 15,109 29.3% 26
Utah 5,592 1,190 21.3% 49
Vermont 2,007 685 34.1% 4
Virginia 20,246 6,552 32.4% 12
Washington 17,778 5,640 31.7% 17
West Virginia 4,478 1,123 25.1% 43
Wisconsin 14,311 4,179 29.2% 27
Wyoming 1,056 248 23.5% 46
Source: AMA Physician Masterfile (December 31, 2010) N.R. = Not Ranked
* Physicians whose sex was missing (n=1,104) are excluded.
Section 1 – Physician Supply
Figure 6. Percentage of Active Physicians Who Are International Medical Graduates (IMGs), 2010
Source: AMA Physician Masterfile (December 31, 2010). Physicians whose medical school type was unavailable are excluded (n=67). Physicians who are graduates of Canadian medical schools are not included (n=9,700).
0% 10% 20% 30% 40% 50%
Idaho MontanaAlaska ColoradoVermont Utah Oregon WyomingMaine Washington South DakotaNebraska South CarolinaMississippi Hawaii North CarolinaMinnesota New HampshireArkansas Alabama TennesseeOklahoma New MexicoIowa Kansas WisconsinLouisiana MissouriGeorgia VirginiaIndiana KentuckyArizona MassachusettsPennsylvania Texas United StatesCalifornia Ohio North DakotaRhode Island Maryland Delaware ConnecticutNevada Michigan West VirginiaIllinois Florida New York New Jersey
State Median = 17.8%
Table 6. Active Physicians by Medical School Type, 2010
Table 6. Active Physicians by Medical School Type, 2010Number Percent Number Percent Number Percent Rank United States 799,442 542,321 67.8% 55,218 6.9% 192,203 24.0% N.R.
Alabama 9,508 7,450 78.4% 382 4.0% 1,568 16.5% 31
Alaska 1,721 1,452 84.4% 156 9.1% 102 5.9% 48
Arizona 14,692 9,555 65.0% 1,665 11.3% 3,209 21.8% 18
Arkansas 5,518 4,367 79.1% 253 4.6% 860 15.6% 32
California 95,194 66,909 70.3% 3,697 3.9% 23,122 24.3% 14
Colorado 13,243 11,114 83.9% 1,041 7.9% 939 7.1% 47
Connecticut 11,678 7,939 68.0% 396 3.4% 3,215 27.5% 8
Delaware 2,393 1,474 61.6% 269 11.2% 635 26.5% 9
District of Columbia 5,327 3,989 74.9% 116 2.2% 1,166 21.9% N.R. Florida 47,584 26,379 55.4% 3,933 8.3% 16,823 35.4% 3
Georgia 20,510 15,425 75.2% 836 4.1% 4,073 19.9% 22
Hawaii 3,970 3,167 79.8% 188 4.7% 552 13.9% 36
Idaho 2,873 2,452 85.3% 263 9.2% 115 4.0% 50
Illinois 33,591 20,328 60.5% 2,170 6.5% 10,807 32.2% 4
Indiana 13,899 10,010 72.0% 847 6.1% 2,889 20.8% 20
Iowa 6,294 4,044 64.3% 1,090 17.3% 1,093 17.4% 27
Kansas 6,058 4,359 72.0% 591 9.8% 1,059 17.5% 26
Kentucky 9,478 6,935 73.2% 439 4.6% 1,989 21.0% 19
Louisiana 10,541 8,353 79.2% 116 1.1% 1,997 18.9% 24
Maine 4,031 2,814 69.8% 611 15.2% 501 12.4% 42
Maryland 21,152 14,709 69.5% 641 3.0% 5,589 26.4% 10
Massachusetts 27,539 20,016 72.7% 627 2.3% 6,182 22.4% 17 Michigan 26,322 13,811 52.5% 4,727 18.0% 7,517 28.6% 6
Minnesota 14,261 11,274 79.1% 470 3.3% 2,145 15.0% 34
Mississippi 5,220 4,158 79.7% 304 5.8% 721 13.8% 37
Missouri 14,824 9,938 67.0% 1,892 12.8% 2,907 19.6% 23
Montana 2,232 1,959 87.8% 155 6.9% 102 4.6% 49
Nebraska 3,979 3,250 81.7% 150 3.8% 541 13.6% 39
Nevada 5,264 3,246 61.7% 493 9.4% 1,471 27.9% 7
New Hampshire 3,870 2,908 75.1% 257 6.6% 585 15.1% 33
New Jersey 25,629 12,863 50.2% 2,629 10.3% 10,021 39.1% 1
New Mexico 4,673 3,569 76.4% 255 5.5% 806 17.2% 28
New York 68,036 38,002 55.9% 3,093 4.5% 26,090 38.3% 2 North Carolina 22,367 18,205 81.4% 806 3.6% 3,144 14.1% 35
North Dakota 1,558 1,037 66.6% 59 3.8% 396 25.4% 12
Ohio 30,484 18,762 61.5% 3,665 12.0% 7,704 25.3% 13
Oklahoma 7,405 4,597 62.1% 1,532 20.7% 1,229 16.6% 29
Oregon 10,594 8,789 83.0% 627 5.9% 978 9.2% 44
Pennsylvania 38,205 23,774 62.2% 5,348 14.0% 8,761 22.9% 16
Rhode Island 3,513 2,332 66.4% 210 6.0% 908 25.8% 11
South Carolina 9,922 8,076 81.4% 437 4.4% 1,362 13.7% 38
South Dakota 1,779 1,416 79.6% 117 6.6% 233 13.1% 40
Tennessee 15,301 12,021 78.6% 581 3.8% 2,538 16.6% 30
Texas 51,690 35,329 68.3% 3,435 6.6% 12,354 23.9% 15
Utah 5,598 4,743 84.7% 310 5.5% 485 8.7% 45
Vermont 2,008 1,705 84.9% 63 3.1% 160 8.0% 46
Virginia 20,268 15,044 74.2% 842 4.2% 4,207 20.8% 21
Washington 17,788 14,186 79.8% 878 4.9% 2,301 12.9% 41 West Virginia 4,485 2,429 54.2% 670 14.9% 1,358 30.3% 5
Wisconsin 14,316 10,800 75.4% 804 5.6% 2,582 18.0% 25
Wyoming 1,057 858 81.2% 82 7.8% 112 10.6% 43
Source: AMA Physician Masterfile (December 31, 2010) N.R. = Not Ranked
* The total excludes active physicians whose medical school type was unavailable (n=67). Physicians who are graduates of Canadian medical schools are included in the total (n=9,700).
Total Active
U.S.M.D. D.O. IMG
Number Physicians*
Section 1 – Physician Supply
Figure 7. Percentage of Active Physicians Who are Age 60 or Older, 2010
Source: AMA Physician Masterfile (December 31, 2010). Physicians whose age was unavailable are excluded (n=1,274).
0% 5% 10% 15% 20% 25% 30% 35%
North CarolinaWisconsin Nebraska MinnesotaUtah GeorgiaIowa DelawareIdaho IndianaOhio South Dakota New HampshireSouth Carolina Texas Kentucky TennesseeVirginia ColoradoMissouri Nevada AlabamaIllinois Alaska Rhode IslandArizona PennsylvaniaArkansas Oregon North Dakota MassachusettsWyoming MississippiKansas United StatesMichigan WashingtonOklahoma ConnecticutLouisiana MarylandVermont HawaiiMaine New JerseyMontana Florida West VirginiaNew York California New Mexico
State Median = 25.0%
Table 7. Active Physicians by Selected Age Groups, 2010
Table 7. Active Physicians by Selected Age Groups, 2010Number Percent Number Percent Rank United States 798,235 140,464 17.6% 208,802 26.2% N.R.
Alabama 9,505 1,521 16.0% 2,346 24.7% 29
Alaska 1,718 244 14.2% 427 24.9% 27
Arizona 14,633 2,425 16.6% 3,670 25.1% 25
Arkansas 5,513 933 16.9% 1,397 25.3% 23
California 95,097 15,968 16.8% 29,217 30.7% 2
Colorado 13,233 2,212 16.7% 3,239 24.5% 32
Connecticut 11,666 1,889 16.2% 3,186 27.3% 13
Delaware 2,390 399 16.7% 550 23.0% 43
District of Columbia 5,326 1,207 22.7% 1,605 30.1% N.R.
Florida 47,465 6,544 13.8% 13,446 28.3% 5
Georgia 20,506 3,578 17.4% 4,686 22.9% 45
Hawaii 3,969 633 15.9% 1,121 28.2% 9
Idaho 2,872 398 13.9% 670 23.3% 42
Illinois 33,541 6,857 20.4% 8,303 24.8% 28
Indiana 13,892 2,289 16.5% 3,245 23.4% 41
Iowa 6,280 1,189 18.9% 1,440 22.9% 44
Kansas 6,051 1,112 18.4% 1,571 26.0% 17
Kentucky 9,468 1,735 18.3% 2,279 24.1% 35
Louisiana 10,539 1,971 18.7% 2,899 27.5% 12
Maine 4,022 528 13.1% 1,136 28.2% 8
Maryland 21,131 3,740 17.7% 5,864 27.8% 11
Massachusetts 27,537 5,492 19.9% 7,086 25.7% 20
Michigan 26,078 4,659 17.9% 6,833 26.2% 16
Minnesota 14,252 2,699 18.9% 3,143 22.1% 47
Mississippi 5,219 804 15.4% 1,352 25.9% 18
Missouri 14,798 2,959 20.0% 3,625 24.5% 31
Montana 2,231 236 10.6% 632 28.3% 6
Nebraska 3,976 809 20.3% 871 21.9% 48
Nevada 5,257 816 15.5% 1,288 24.5% 30
New Hampshire 3,871 589 15.2% 926 23.9% 38
New Jersey 25,581 3,953 15.5% 7,240 28.3% 7
New Mexico 4,669 679 14.5% 1,439 30.8% 1
New York 67,961 12,036 17.7% 19,682 29.0% 3
North Carolina 22,357 4,219 18.9% 4,636 20.7% 50
North Dakota 1,557 270 17.3% 397 25.5% 21
Ohio 30,428 6,020 19.8% 7,155 23.5% 40
Oklahoma 7,396 1,278 17.3% 1,999 27.0% 14
Oregon 10,584 1,738 16.4% 2,686 25.4% 22
Pennsylvania 38,063 7,255 19.1% 9,625 25.3% 24
Rhode Island 3,513 644 18.3% 875 24.9% 26
South Carolina 9,919 1,797 18.1% 2,379 24.0% 37
South Dakota 1,776 301 16.9% 422 23.8% 39
Tennessee 15,290 2,522 16.5% 3,688 24.1% 34
Texas 51,651 10,135 19.6% 12,412 24.0% 36
Utah 5,593 1,093 19.5% 1,278 22.8% 46
Vermont 2,004 268 13.4% 558 27.8% 10
Virginia 20,241 3,613 17.8% 4,931 24.4% 33
Washington 17,785 2,816 15.8% 4,706 26.5% 15
West Virginia 4,474 802 17.9% 1,282 28.7% 4
Wisconsin 14,303 2,448 17.1% 3,087 21.6% 49
Wyoming 1,054 142 13.5% 272 25.8% 19
Source: AMA Physician Masterfile (December 31, 2010) N.R. = Not Ranked
* Physicians whose age was unavailable (n=1,274) are excluded. ActiveTotal
Under Age 40 Age 60 or Older Number
Section 2 – Medical and Osteopathic School Enrollment
Section 2 – Medical and Osteopathic School Enrollment
Key Findings – Medical and Osteopathic School Enrollment
• During the 2010-2011 academic year, there were 31.4 students per 100,000 population enrolled in medical and
osteo-pathic schools
1in the United States. The states with the highest student to population ratio were concentrated in the
Northeast and the Midwest (see Map 4, Figure 8, and Table 8).
Map 4. Medical and Osteopathic Students per 100,000 Population, 2010-2011 Academic Year
Source: Medical enrollment data are from the AAMC Data Warehouse STUDENT file as of October 26, 2010, accessed online
at http://www.aamc.org/data/facts. Osteopathic enrollment data are from Osteopathic Medical College Information Book: 2012
Entering Class, accessed online at http://www.aacom.org/resources/bookstore/cib/Pages/default.aspx (August 04, 2011). July 1, 2010
population estimates are from the U.S. Census Bureau (Release date: February 2011).
• More than half (59.8%) of the students enrolled in medical schools in the United States were enrolled in public
schools, while only one fifth of students enrolled in osteopathic schools (20.3%) were enrolled in public schools. The
Source: Medical enrollment data are from the AAMC Data Warehouse STUDENT file, accessed online at http://www.
aamc.org/data/facts. Osteopathic enrollment data are from Osteopathic Medical College Information Book: 2012 Entering
Class, accessed online at http://www.aacom.org/resources/bookstore/cib/ Pages/default.aspx (August 24, 2011). July 1,
2010 population estimates are from the U.S. Census Bureau (Release date: February 2011).
Map 5. Public Medical and Osteopathic Students per 100,000 Population, 2010-2011 Academic Year
• Between the 2000-2001 and 2010-2011 academic years, the total number of students enrolled in medical or osteopathic
schools increased by 22.9 percent in the US. The growth was driven by a somewhat greater increase in the total number
of students enrolled in medical schools (9,510) compared to osteopathic schools (8,610). This represents a 13.9 percent
increase in M.D. enrollment and a 79.6 percent increase in D.O. enrollment during the ten year period. Every state
experienced an increase in enrollment, except Utah, which had a 3.0 percent decrease in enrollment. Nineteen states
had enrollment increases of 20 percent or more (see Figure 10 and Table 10).
• For the 2010-2011 academic year, 62.7 percent of first-year students in M.D. schools matriculated in their home state.
Louisiana had the highest in-state matriculation rate–89.6 percent of the new medical students from Louisiana
matric-ulated to a school in Louisiana. In contrast, New Hampshire had the lowest rate of states with a medical school–only
20.9 percent of the new medical students from New Hampshire matriculated in-state (see Figure 11 and Table 11).
Section 2 – Medical and Osteopathic School Enrollment
Figure 8. Students Enrolled in Medical or Osteopathic School for the 2010-2011 Academic Year Per 100,000 Population
Sources: Medical enrollment data are from the AAMC Data Warehouse STUDENT file as of October 26, 2010 accessed online at
https://www.aamc.org/data/facts. Osteopathic enrollment data are from Osteopathic Medical College Information Book: 2012 Entering Class, accessed online at http://www.aacom.org/resources/bookstore/cib/Pages/default.aspx (August 04, 2011). July 1, 2010 population estimates are from the U.S. Census
Bureau (Release date: February, 2011).
0 10 20 30 40 50 60 70 80 90
WyomingMontana Idaho DelawareAlaska OregonUtah New MexicoWashington CaliforniaHawaii Indiana Mississippi North CarolinaFlorida ArkansasAlabama New JerseyColorado South CarolinaMinnesota Georgia ConnecticutKansas Texas Wisconsin South DakotaOklahoma New HampshireNevada Arizona United StatesKentucky Virginia MarylandMichigan North DakotaMaine TennesseeOhio Rhode IslandIllinois Louisiana MassachusettsNew York Iowa Nebraska PennsylvaniaMissouri Vermont West Virginia
MD DO
State Median =27.9
Figure 8. Students Enrolled in Medical or Osteopathic School for the 2010-2011 Academic Year
Per 100,000 Population
Table 8. Students Enrolled in Medical or Osteopathic Schools for the 2010-2011 Academic Year
Rate per Rate per Rate per
Number 100,000 Rank Number 100,000 Number 100,000 United States 309,050,816 97,188 31.4 N.R. 77,761 25.2 19,427 6.3
Alabama 4,729,656 1,052 22.2 34 1,052 22.2 ---
---Alaska 708,862 --- --- --- --- --- ---
---Arizona 6,676,627 1,972 29.5 20 650 9.7 1,322 19.8
Arkansas 2,910,236 645 22.2 35 645 22.2 ---
---California 37,266,600 6,460 17.3 41 5,034 13.5 1,426 4
Colorado 5,095,309 1,155 22.7 32 691 13.6 464 9.1
Connecticut 3,526,937 882 25.0 28 882 25.0 ---
---Delaware 891,464 --- --- --- --- --- ---
---District of Columbia 610,589 2,051 335.9 N.R. 2,051 335.9 ---
---Florida 18,678,049 4,037 21.6 36 2,457 13.2 1,580 8.5
Georgia 9,908,357 2,341 23.6 29 1,998 20.2 343 3.5
Hawaii 1,300,086 256 19.7 40 256 19.7
Idaho 1,559,796 --- --- --- --- --- ---
---Illinois 12,944,410 5,640 43.6 10 4,886 37.7 754 5.8
Indiana 6,445,295 1,300 20.2 39 1,300 20.2 ---
---Iowa 3,023,081 1,525 50.4 6 654 21.6 871 28.8
Kansas 2,841,121 740 26.0 27 740 26.0 ---
---Kentucky 4,339,435 1,433 33.0 19 1,129 26.0 304 7.0
Louisiana 4,529,426 2,027 44.8 9 2,027 44.8 ---
---Maine 1,312,939 508 38.7 14 --- --- 508 38.7
Maryland 5,737,274 1,938 33.8 17 1,938 33.8 ---
---Massachusetts 6,631,280 2,983 45.0 8 2,983 45.0 ---
---Michigan 9,931,235 3,807 38.3 16 2,739 27.6 1,068 10.8
Minnesota 5,290,447 1,233 23.3 30 1,233 23.3 ---
---Mississippi 2,960,467 599 20.2 38 489 16.5 110 4
Missouri 6,011,741 3,832 63.7 3 2,146 35.7 1,686 28.0
Montana 980,152 --- --- --- --- --- ---
---Nebraska 1,811,072 1,037 57.3 5 1,037 57.3 ---
---Nevada 2,654,751 781 29.4 21 250 9.4 531 20
New Hampshire 1,323,531 374 28.3 22 374 28.3 ---
---New Jersey 8,732,811 1,952 22.4 33 1,442 16.5 510 5.8
New Mexico 2,033,875 347 17.1 43 347 17.1 ---
---New York 19,577,730 9,667 49.4 7 7,979 40.8 1,688 9
North Carolina 9,458,888 2,029 21.5 37 2,029 21.5 ---
---North Dakota 653,778 252 38.5 15 252 38.5 ---
---Ohio 11,532,111 4,648 40.3 12 4,183 36.3 465 4.0
Oklahoma 3,724,447 1,040 27.9 23 681 18.3 359 10
Oregon 3,855,536 516 13.4 45 516 13.4 ---
---Pennsylvania 12,632,780 7,496 59.3 4 5,160 40.8 2,336 18.5
Rhode Island 1,056,870 426 40.3 11 426 40.3 ---
---South Carolina 4,596,958 1,060 23.1 31 1,060 23.1 ---
---South Dakota 820,077 227 27.7 24 227 27.7 ---
---Tennessee 6,338,112 2,481 39.1 13 1,861 29.4 620 9.8
Texas 25,213,445 6,613 26.2 26 5,885 23.3 728 2.9
Utah 2,830,753 398 14.1 44 398 14.1 ---
---Vermont 622,433 480 77.1 2 480 77.1 ---
---Virginia 7,952,119 2,668 33.6 18 1,949 24.5 719 9.0
Washington 6,746,199 1,165 17.3 42 941 13.9 224 3.3
West Virginia 1,825,513 1,553 85.1 1 742 40.6 811 44
Wisconsin 5,668,519 1,562 27.6 25 1,562 27.6 ---
---Wyoming 547,637 --- --- --- --- --- ---
---N.R. = Not Ranked
--- Indicates that the data are not applicable. Some states do not have a medical or osteopathic school.
Sources: Medical enrollment data are from the AAMC Data Warehouse STUDENT file as of October 26, 2010 accessed online at https://www.aamc.org/data/facts. Osteopathic enrollment data are from Osteopathic Medical College Information Book: 2012 Entering Class , accessed online at http://www.aacom.org/resources/bookstore/cib/Pages/default.aspx (August 04, 2011). July 1, 2010 population estimates are from the U.S. Census Bureau (Release date: February, 2011).
PopulationTotal
Total Students Enrolled in Students Enrolled in Students Enrolled in Medical or Osteopathic Schools Medical Schools Osteopathic Schools
Section 2 – Medical and Osteopathic School Enrollment
Figure 9. Students Enrolled in
Public
Medical or Osteopathic School for the 2010-2011 Academic Year Per 100,000 PopulationSources: Medical enrollment data are from the AAMC Data Warehouse STUDENT file as of October 26, 2010 accessed online at
https://www.aamc.org/data/facts. Osteopathic enrollment data are from Osteopathic Medical College Information Book: 2012 Entering Class, accessed online at http://www.aacom.org/resources/bookstore/cib/Pages/default.aspx (August 04, 2011). July 1, 2010 population estimates are from the U.S. Census Bureau (Release date: February, 2011).
0 10 20 30 40 50 60 70 80 90
Wyoming Rhode Island Pennsylvania New HampshireMontana MaineIdaho DelawareAlaska MassachusettsGeorgia CaliforniaFlorida Nevada Arizona Connecticut North CarolinaWisconsin Illinois MissouriOregon New YorkColorado WashingtonUtah Tennessee United StatesMississippi New MexicoMinnesota Hawaii IndianaIowa ArkansasAlabama New JerseyTexas South CarolinaMaryland Virginia KentuckyKansas South DakotaOklahoma LouisianaNebraska Ohio Michigan North DakotaVermont West Virginia
MD DO
State Median =19.7
Figure 9. Students Enrolled in Public Medical or Osteopathic School for the 2010-2011 Academic Year
Per 100,000 Population
Table 9. Students Enrolled in Public Medical or Osteopathic Schools for the 2010-2011 Academic Year
Rate per Rate per Rate per
Number 100,000 Rank Number 100,000 Number 100,000 United States 309,050,816 50,415 16.3 N.R. 46,474 15.0 3,941 1.3
Alabama 4,729,656 1,052 22.2 17 1,052 22.2 ---
---Alaska 708,862 --- --- --- --- --- ---
---Arizona 6,676,627 650 9.7 36 650 9.7 ---
---Arkansas 2,910,236 645 22.2 18 645 22.2 ---
---California 37,266,600 3,139 8.4 39 3,139 8.4 ---
---Colorado 5,095,309 691 13.6 28 691 13.6 ---
---Connecticut 3,526,937 381 10.8 35 381 10.8 ---
---Delaware 891,464 --- --- --- --- --- ---
---District of Columbia 610,589 --- --- N.R. --- --- ---
---Florida 18,678,049 1,690 9.0 38 1,690 9.0 ---
---Georgia 9,908,357 819 8.3 40 819 8.3 ---
---Hawaii 1,300,086 256 19.7 21 256 19.7 ---
---Idaho 1,559,796 --- --- --- --- --- ---
---Illinois 12,944,410 1,709 13.2 32 1,709 13.2 ---
---Indiana 6,445,295 1,300 20.2 20 1,300 20.2 ---
---Iowa 3,023,081 654 21.6 19 654 21.6 ---
---Kansas 2,841,121 740 26.0 10 740 26.0 ---
---Kentucky 4,339,435 1,129 26.0 11 1,129 26.0 ---
---Louisiana 4,529,426 1,268 28.0 7 1,268 28.0 ---
---Maine 1,312,939 --- --- --- --- --- ---
---Maryland 5,737,274 1,369 23.9 13 1,369 23.9 ---
---Massachusetts 6,631,280 524 7.9 41 524 7.9 ---
---Michigan 9,931,235 3,807 38.3 4 2,739 27.6 1,068 10.8
Minnesota 5,290,447 1,001 18.9 22 1,001 18.9 ---
---Mississippi 2,960,467 489 16.5 24 489 16.5 ---
---Missouri 6,011,741 794 13.2 31 794 13.2 ---
---Montana 980,152 --- --- --- --- --- ---
---Nebraska 1,811,072 508 28.0 6 508 28.0 ---
---Nevada 2,654,751 250 9.4 37 250 9.4 ---
---New Hampshire 1,323,531 --- --- --- --- --- ---
---New Jersey 8,732,811 1,952 22.4 16 1,442 16.5 510 5.8
New Mexico 2,033,875 347 17.1 23 347 17.1 ---
---New York 19,577,730 2,629 13.4 29 2,629 13.4 ---
---North Carolina 9,458,888 1,071 11.3 34 1,071 11.3 ---
---North Dakota 653,778 252 38.5 3 252 38.5 ---
---Ohio 11,532,111 3,745 32.5 5 3,280 28.4 465 4.0
Oklahoma 3,724,447 1,040 27.9 8 681 18.3 359 10
Oregon 3,855,536 516 13.4 30 516 13.4 ---
---Pennsylvania 12,632,780 --- --- --- --- --- ---
---Rhode Island 1,056,870 --- --- --- --- --- ---
---South Carolina 4,596,958 1,060 23.1 14 1,060 23.1 ---
---South Dakota 820,077 227 27.7 9 227 27.7 ---
---Tennessee 6,338,112 909 14.3 25 909 14.3 ---
---Texas 25,213,445 5,811 23.0 15 5,083 20.2 728 2.9
Utah 2,830,753 398 14.1 26 398 14.1 ---
---Vermont 622,433 480 77.1 2 480 77.1 ---
---Virginia 7,952,119 1,907 24.0 12 1,907 24.0 ---
---Washington 6,746,199 941 13.9 27 941 13.9 ---
---West Virginia 1,825,513 1,553 85.1 1 742 40.6 811 44
Wisconsin 5,668,519 712 12.6 33 712 12.6 ---
---Wyoming 547,637 --- --- --- --- --- ---
---N.R. = Not Ranked
--- Indicates that the data are not applicable. Some states do not have a public medical or osteopathic school.
Students Enrolled Students Enrolled
Sources: Medical enrollment data are from the AAMC Data Warehouse STUDENT file as of October 26, 2010 accessed online at https://www.aamc.org/data/facts. Osteopathic enrollment data are from Osteopathic Medical College Information Book: 2012 Entering Class , accessed online at http://www.aacom.org/resources/bookstore/cib/Pages/default.aspx (August 04, 2011). July 1, 2010 population estimates are from the U.S. Census Bureau (Release date: February, 2011).
PopulationTotal
Total Students Enrolled in Public in Public in Public Medical or Osteopathic Schools Medical Schools Osteopathic Schools
Section 2 – Medical and Osteopathic School Enrollment
Figure 10. Percentage Change in Students Enrolled in Medical or Osteopathic Schools, 2000-2010
Sources: 2010 Medical enrollment data are from the AAMC Data Warehouse STUDENT file as of October 26, 2010 accessed online at
https://www.aamc.org/data/facts. 2000 Medical enrollment data retrieved frm the AAMC Data Warehouse STUDENT file as of August 11, 2011. 2010 Osteopathic enrollment data are from Osteopathic Medical College Information Book: 2012 Entering Class, accessed online at
http://www.aacom.org/resources/bookstore/cib/Pages/default.aspx (August 04, 2011). 2000 Osteopathic enrollment data are from JAOA. November
-10% 10% 30% 50% 70% 90% 110%
WyomingMontana MaineIdaho DelawareAlaska Utah Iowa Kansas ConnecticutIllinois Hawaii Maryland North CarolinaNebraska South DakotaWisconsin Alabama Oklahoma Minnesota North DakotaMissouri Arkansas New Mexico MassachusettsCalifornia New YorkIndiana New JerseyOhio LouisianaKentucky South CarolinaPennsylvania Oregon United StatesTexas Vermont New HampshireRhode Island Michigan Tennessee WashingtonGeorgia MississippiVirginia West VirginiaFlorida ColoradoArizona Nevada
280% State Median =15.9%
Table 10. Change in Number of Students Enrolled in Medical or Osteopathic Schools, 2000-2010
2000 2010 Rank 2000 2010 2000 2010
United States 79,068 97,188 22.9% N.R. 68,251 77,761 10,817 19,427
Alabama 955 1,052 10.2% 33 955 1,052 ---
---Alaska --- --- --- --- --- --- ---
---Arizona 909 1,972 116.9% 2 427 650 482 1,322
Arkansas 578 645 11.6% 28 578 645 ---
---California 5,695 6,460 13.4% 25 4,657 5,034 1,038 1,426
Colorado 554 1,155 108.5% 3 554 691 --- 464
Connecticut 838 882 5.3% 41 838 882 ---
---Delaware --- --- --- --- --- --- ---
---District of Columbia 1,803 2,051 13.8% N.R. 1,803 2,051 ---
---Florida 2,159 4,037 87.0% 4 1,479 2,457 680 1,580
Georgia 1,577 2,341 48.4% 8 1,577 1,998 --- 343
Hawaii 239 256 7.1% 39 239 256 ---
---Idaho --- --- --- --- --- --- ---
---Illinois 5,283 5,640 6.8% 40 4,643 4,886 640 754
Indiana 1,123 1,300 15.8% 23 1,123 1,300 ---
---Iowa 1,511 1,525 0.9% 43 706 654 805 871
Kansas 720 740 2.8% 42 720 740 ---
---Kentucky 1,217 1,433 17.7% 19 978 1,129 239 304
Louisiana 1,733 2,027 17.0% 20 1,733 2,027 ---
---Maine --- --- --- --- --- --- ---
---Maryland 1,794 1,938 8.0% 38 1,794 1,938 ---
---Massachusetts 2,653 2,983 12.4% 26 2,653 2,983 ---
---Michigan 2,772 3,807 37.3% 11 2,249 2,739 523 1,068
Minnesota 1,114 1,233 10.7% 31 1,114 1,233 ---
---Mississippi 400 599 49.8% 7 400 489 --- 110
Missouri 3,447 3,832 11.2% 29 1,960 2,146 1,487 1,686
Montana --- --- --- --- --- --- ---
---Nebraska 953 1,037 8.8% 36 953 1,037 ---
---Nevada 209 781 273.7% 1 209 250 --- 531
New Hampshire 294 374 27.2% 13 294 374 ---
---New Jersey 1,682 1,952 16.1% 22 1,373 1,442 309 510
New Mexico 310 347 11.9% 27 310 347 ---
---New York 8,429 9,667 14.7% 24 7,364 7,979 1,065 1,688
North Carolina 1,877 2,029 8.1% 37 1,877 2,029 ---
---North Dakota 227 252 11.0% 30 227 252 ---
---Ohio 3,980 4,648 16.8% 21 3,564 4,183 416 465
Oklahoma 940 1,040 10.6% 32 588 681 352 359
Oregon 421 516 22.6% 16 421 516 ---
---Pennsylvania 6,123 7,496 22.4% 17 4,545 5,160 1,578 2,336
Rhode Island 329 426 29.5% 12 329 426 ---
---South Carolina 879 1,060 20.6% 18 879 1,060 ---
---South Dakota 208 227 9.1% 35 208 227 ---
---Tennessee 1,758 2,481 41.1% 10 1,758 1,861 --- 620
Texas 5,352 6,613 23.6% 15 4,897 5,885 455 728
Utah 410 398 -2.9% 44 410 398 ---
---Vermont 386 480 24.4% 14 386 480 ---
---Virginia 1,684 2,668 58.4% 6 1,684 1,949 --- 719
Washington 789 1,165 47.7% 9 789 941 --- 224
West Virginia 863 1,553 80.0% 5 578 742 285 811
Wisconsin 1,428 1,562 9.4% 34 1,428 1,562 ---
---Wyoming --- --- --- --- --- --- ---
---N.R. = Not Ranked
--- Indicates that the data are not applicable. Some states do not have a medical or osteopathic school.
Sources: 2010 Medical enrollment data are from the AAMC Data Warehouse STUDENT file as of October 26, 2010 accessed online at https://www.aamc.org/data/facts. 2000 Medical enrollment data retrieved frm the AAMC Data Warehouse STUDENT file as of August 11, 2011. 2010 Osteopathic enrollment data are from Osteopathic Medical College Information Book: 2012 Entering Class , accessed online at http://www.aacom.org/resources/bookstore/cib/Pages/default.aspx (August 04, 2011). 2000 Osteopathic enrollment data are from JAOA. November 2001:101(11). July 1, 2010 population estimates are from the U.S. Census Bureau (Release date: February, 2011).
Total Students Enrolled in UME Students Enrolled in
Medical School Students Enrolled inOsteopathic School Percent
Change
Section 2 – Medical and Osteopathic School Enrollment
Figure 11. In-State Matriculation to Medical School for the 2010-2011 Academic Year
Source: AAMC Data Warehouse Applicant Matriculant File as of October 19, 2010, accessed online at http://www.aamc.org/data/facts (August14, 2011).
0% 10% 20% 30% 40% 50% 60% 70% 80% 90% 100%
WyomingMontana MaineIdaho DelawareAlaska New HampshireRhode Island District of ColumbiaConnecticut MarylandUtah WashingtonCalifornia New Jersey MassachusettsColorado Oregon MinnesotaArizona Florida Virginia WisconsinHawaii United States North CarolinaIowa New York PennsylvaniaMissouri North DakotaNevada Kansas MichiganVermont GeorgiaIllinois South DakotaIndiana TennesseeOhio Kentucky New MexicoAlabama Nebraska OklahomaArkansas West VirginiaTexas Mississippi South CarolinaLouisiana
State Median = 67.1%
Figure 11. In-State Matriculation to Medical School for the 2010-2011 Academic Year
Table 11. In-State Matriculation to Medical School for the 2010-2011 Academic Year*
Number Number Percent Rank
United States 18,466 11,586 62.7% N.R.
Alabama 253 210 83.0% 9
Alaska 29 --- ---
---Arizona 244 140 57.4% 32
Arkansas 169 145 85.8% 6
California 2,154 856 39.7% 38
Colorado 251 123 49.0% 35
Connecticut 246 81 32.9% 42
Delaware 36 --- ---
---District of Columbia 41 13 31.7% N.R.
Florida 915 537 58.7% 31
Georgia 565 407 72.0% 17
Hawaii 80 50 62.5% 28
Idaho 55 --- ---
---Illinois 898 647 72.0% 16
Indiana 361 271 75.1% 14
Iowa 145 95 65.5% 26
Kansas 226 157 69.5% 20
Kentucky 249 202 81.1% 11
Louisiana 364 326 89.6% 1
Maine 38 --- ---
---Maryland 496 165 33.3% 41
Massachusetts 526 229 43.5% 36
Michigan 667 470 70.5% 19
Minnesota 384 212 55.2% 33
Mississippi 153 135 88.2% 3
Missouri 280 186 66.4% 23
Montana 56 --- ---
---Nebraska 156 132 84.6% 8
Nevada 79 54 68.4% 21
New Hampshire 43 9 20.9% 44
New Jersey 702 283 40.3% 37
New Mexico 113 93 82.3% 10
New York 1,335 877 65.7% 25
North Carolina 443 282 63.7% 27
North Dakota 62 42 67.7% 22
Ohio 721 574 79.6% 12
Oklahoma 172 146 84.9% 7
Oregon 174 95 54.6% 34
Pennsylvania 758 500 66.0% 24
Rhode Island 34 9 26.5% 43
South Carolina 239 212 88.7% 2
South Dakota 61 44 72.1% 15
Tennessee 300 238 79.3% 13
Texas 1,481 1,306 88.2% 4
Utah 181 61 33.7% 40
Vermont 39 28 71.8% 18
Virginia 431 254 58.9% 30
Washington 319 122 38.2% 39
West Virginia 128 112 87.5% 5
Wisconsin 315 194 61.6% 29
Wyoming 22 --- ---
---N.R. = Not Ranked
--- Indicates that the data are not applicable, as those states do not hav e a medical school.
* The data shown here are for students in medical schools only. Students attending osteopathic schools are excluded. Source: AAMC Data Warehouse Applicant Matriculant File as of October 19, 2010, accessed online at
http://www.aamc.org/data/facts (August14, 2011).
Matriculants to First-Year Medical Students Who Medical School by Matriculated to a Medical School in State of Legal Residence Their Legal State of Residence
Section 3 – Graduate Medical Education
Key Findings – Graduate Medical Education
• In 2010, every state in the United States had at least one ACGME-accredited GME program. The number of residents
and fellows in ACGME-accredited training programs per 100,000 population varied widely across the US from a low of
1.9 in Montana to a high of 83.2 in Massachusetts (see Map 6, Figure 12, and Table 12). The national average was 35.8
residents and fellows per 100,000 population.
Map 6. Residents and Fellows in ACGME-Accredited Training Programs per 100,000 Population, 2010
Source: July 1, 2010 population estimates are from the U.S. Census Bureau (Release date: February, 2011). Physicians in
ACGME-accredited programs are from the 2010 AAMC/AMA National GME Census.
• There were 13.4 residents and fellows in primary care programs
1accredited by the ACGME per 100,000 population in
the United States in 2010. There was a wide range among the states; the highest number of residents and fellows in
pri-mary care GME programs per 100,000 population were in the Northeast (see Map 7, Figure 13, and Table 13).
Map 7. Residents and Fellows in Primary Care Programs per 100,000 Population, 2010
Source: July 1, 2010 population estimates are from the U.S. Census Bureau (Release date February, 2011). Physicians in
ACGME-accredited primary care programs are from the 2010 AAMC/AMA National GME Census.
Section 3 – Graduate Medical Education
• Nationally, more than one quarter (27.4 percent) of the residents and fellows in ACGME training programs were IMGs
in 2010. The percentage varied widely across the states. In Idaho, only 1.6 percent of the residents and fellows were
IMGs. At the other end of the spectrum, in Wyoming nearly two thirds (64.1 percent) were IMGs (see Figure 14 and
Table 14).
• In 2010, there were more residents and fellows in ACGME and OGME programs than there were students in medical
and osteopathic schools in the US, due in part to the inflow of IMGs to GME. The ratio of total GME to total UME was
1.21. However, many states that had medical and osteopathic schools had fewer residents and fellows than students.
Nevada had the lowest ratio of GME to UME (0.42) (see Figure 15 and Table 15).
• Between 2000 and 2010, the number of residents and fellows in ACGME programs increased by 14,720 (15.3
per-cent). Although most states saw an increase over that time period, Hawaii (-58, -13.5 percent), and Montana (-1, -5.0
percent) both had decreases in the number of residents and fellows (see Map 8, Figure 16, and Table 16). The rate of
change varied widely by state, as can be seen in Map 9, Figure 16, and Table 16.
Map 9. Percent Change in Residents and Fellows in ACGME Programs, 2000-2010
Section 3 – Graduate Medical Education
Figure 12. Residents and Fellows on Duty as of August 1, 2010 in ACGME-Accredited Programs per 100,000 Population by Degree Type
Sources: July 1, 2010 population estimates are from the U.S. Census Bureau (Release date: February 2011). Physicians in ACGME-accredited programs are from the 2010 AAMC/AMA National GME Census. Excludes residents whose degree type was unavailable (n=2).
0 10 20 30 40 50 60 70 80 90
MontanaIdaho Alaska WyomingNevada South Dakota North DakotaMississippi Florida Georgia OklahomaIndiana Oregon ArizonaKansas ColoradoMaine Kentucky ArkansasUtah South CarolinaAlabama California WashingtonIowa New MexicoVirginia Texas Hawaii New HampshireNew Jersey Wisconsin North CarolinaTennessee United States West VirginiaNebraska Delaware Louisiana MinnesotaMissouri Illinois Vermont MarylandMichigan Ohio PennsylvaniaConnecticut Rhode IslandNew York Massachusetts
MD DO
State Median = 26.2