THE MATHEMATICAL STRUCTURE OF THE GENETIC CODE:
A TOOL FOR INQUIRING ON THE ORIGIN OF LIFE
Diego Luis Gonzalez
CNR-IMM, Bologna Section, Via Gobetti 101, I-40129, Bologna, Italia
Department of Statistical Sciences, University of Bologna, Via delle Belle Arti 41, I-40126, Bologna, Italia
Simone Giannerini
Department of Statistical Sciences, University of Bologna, Via delle Belle Arti 41, I-40126, Bologna, Italia
Rodolfo Rosa
Department of Statistical Sciences, University of Bologna, Via delle Belle Arti 41, I-40126, Bologna, Italia
CNR-IMM, Bologna Section, Via Gobetti 101, I-40129, Bologna, Italia
1. INTRODUCTION
have shaped the presently observed background radiation.
As we have already pointed out, the situation regarding the origin of life appears similar. Of course, in this context, the problem resides in the identification of what is the analogous of the background radiation and of its relics. To this aim, it is important to remind that the more universal is a trait, the more ancient should be its origin. In this article we present a review of our work on the (recently found) mathematical structure of the nuclear genetic code. We will show how such structure can be seen as a good candidate for this scope. We apply the Cosmology analogy regarding the background radiation and study the organization of the genetic code accordingly: hypotheses on origins are verified by comparing theoretical predictions against the empirical evidence of the existing organization. We cannot reproduce the origin of life but we can propose verifiable theories. We might even hope to find “mathematical relics” that go back close to the life “Big Bang”. Perhaps it is not a simple coincidence that the theoretical physicist George Gamow, which first proposed the Big Bang theory for the origin of the universe, was also the first to propose a mathematical organization (turned out to be wrong) for the coding of amino acids along the double helix of DNA, the so called Gamow’s diamond code. Quoting Knight and Landweber (2000):
“. . . In the absence of evidence, many of the most interesting questions about the genetic code have fallen into a twilight zone of speculation and controversy. Although it is generally accepted that the modern code evolved from a simpler form, there has not been consensus about when the initial code evolved or what is was like, how and when particular amino acids were added, how and when the modern tRNA/synthetase system arose, or the processes by which the code could have expanded. . . ”
thus, the authors appeal to the necessity of using and/or developing extraordinary tools for tackling these formidable problems. As many say, “absence of evidence is evidence of absence”; hence, the main aim of this paper is to contribute to fill in the gap from a theoretical “first principles” point of view. The basic methods involved are rooted in some key properties pertaining to the fields of number theory, i.e., non-power po-sitional integer representations, and group theory. The new theoretical approach pre-sented allows a deep insight onto the difficult problem of the origin and evolution of the genetic code and, consequently, on the origin and evolution of life. The model has both descriptive and predictive power; description is very accurate as it allows hypothe-ses testing on the basis of actual structures; predictions are very intriguing and suggest biological candidates as mathematical remnants of life origins. In particular, the model allows the uncovering of several hidden symmetries and the definition of new mathe-matical objects that are natural extensions of the well known Rumer’s dichotomic class. Moreover, on the basis of such new classes, we implement appropriate statistical tech-niques that allow to share new light on the informational structure of protein coding DNA sequences.
T C A G
TTT Phe TCT Ser TAT Tyr TGT Cys T
TTC Phe TCC Ser TAC Tyr TGC Cys C
T TTA Leu TCA Ser TAA Stop TGA Cys A
TTG Leu TCG Ser TAG Stop TGG Trp G
CTT Leu CCT Pro CAT His CGT Arg T
CTC Leu CCC Pro CAT His CGC Arg C
C CTA Leu CCA Pro CAA Gln CGA Arg A
CTG Leu CCG Pro CAG Gln CGG Arg G
ATT Ile ACT Thr AAT Asn AGT Ser T
ATC Ile ACC Thr AAC Asn AGC Ser C
A ATA Ile ACA Thr AAA Lys AGA Arg A
ATG Met ACG Thr AAG Lys AGG Arg G
GTT Val GCT Ala GAT Asp GGT Gly T
GTC Val GCC Ala GAC Asp GGC Gly C
G GTA Val GCA Ala GAA Glu GGA Gly A
GTG Val GCG Ala GAG Glu GGG Gly G
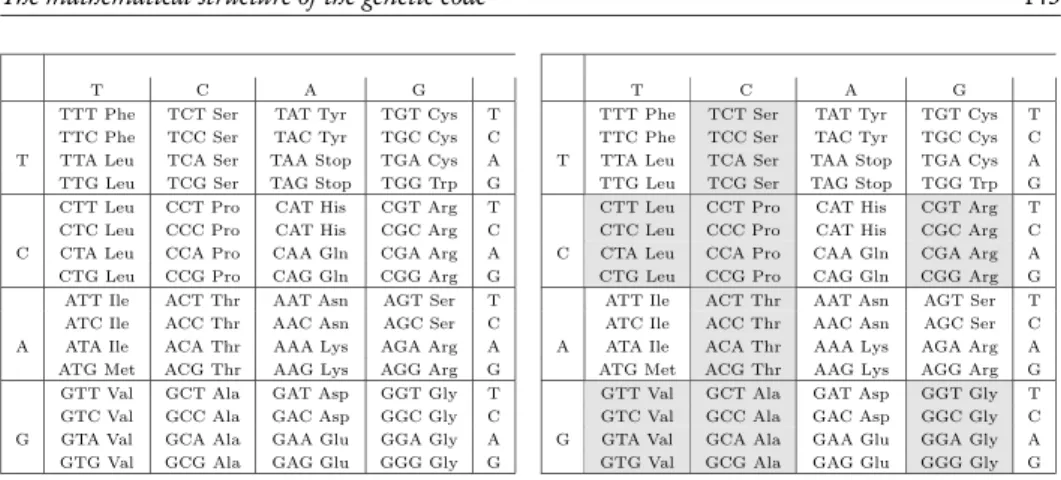
Figure 1 –(left) representation of the standard nuclear genetic code; (right) graphical representa-tion of the classificarepresenta-tion of triplets in Rumer’s classes. White boxes indicate triplets belonging to the class{4}, grey boxes indicate triplets belonging to the class{1, 2, 3}.
DNA sequences which is presented and discussed in Section 3. Conclusions and per-spectives are outlined in section 4.
2. THE THEORETICAL MODEL
The genetic code is a translation table that connects two different biochemical worlds: that of nucleic acids, where biological information is stored, and the world of proteins, the chemical bricks of cellular metabolism. The genetic information is stored in double helix DNA molecules. The protein coding part of such molecules is converted into the single helix messenger RNA (mRNA) through a process calledtranscription. In this process, the Thymine (T) one of the four bases Thymine (T), Cytosine (C), Adenine (A), and Guanine (G) that compose the DNA is replaced by Uracil (U). Counting from thestartsignal, every group of three contiguous bases in mRNA forms acodon. The genetic code assigns an amino acid to every possible codon; this determines the linear assembling order of such amino acids that form a polymeric chain of a specific protein. Such process is calledtranslation. In Fig 1 (left) we show the standard nuclear genetic codei.e.the assignment of amino acids to codons.
# 8 7 4 2 1 1 8 7 4 2 1 1 8 7 4 2 1 1 8 7 4 2 1 1 D Amino acids pairs 8 7 4 2 1 1 8 7 4 2 1 1 8 7 4 2 1 1 8 7 4 2 1 1 # 0 0 0 0 0 0 0 1 W Trp M Met 1 1 1 1 1 1 23 1 0 0 0 0 1 0 0 0 0 0 0 1 2 S Ser 2 F Phe 1 1 1 1 1 0 1 1 1 1 0 1 22 2 0 0 0 1 0 0 0 0 0 0 1 1 2 Ter K Lys 1 1 1 1 0 0 1 1 1 0 1 1 21 3 0 0 0 1 1 0 0 0 0 1 0 1 2 Y Tyr N Asn 1 1 1 0 1 0 1 1 1 0 0 1 20 4 0 0 1 0 0 0 0 0 0 1 1 1 2 L Leu 2 R Arg 2 1 1 1 0 0 0 1 1 0 1 1 1 19 5 0 0 1 0 1 0 0 0 1 0 0 1 2 H His D Asp 1 1 0 1 1 0 1 1 0 1 0 1 18 6 0 0 1 1 0 0 0 0 1 0 1 1 2 Q Gln E Glu 1 1 0 1 0 0 1 1 0 0 1 1 17 7 0 0 1 1 1 0 0 0 1 1 0 1 0 1 0 0 0 0 3 C Cys I Ile 1 0 1 1 1 1 1 1 0 0 1 0 1 1 0 0 0 1 16 8 1 0 0 0 0 0 0 1 0 0 1 0 0 1 0 0 0 1 0 0 1 1 1 1 4 S Ser 4 T Thr 1 1 0 0 0 0 1 0 1 1 1 0 1 0 1 1 0 1 0 1 1 1 1 1 15 9 1 0 0 0 1 0 1 0 0 0 0 1 0 1 0 1 0 0 0 1 0 0 1 1 4 P Pro A Ala 1 0 1 1 0 0 1 0 1 0 1 1 0 1 1 1 1 0 0 1 1 1 0 1 14 10 1 0 0 1 0 0 0 1 0 1 1 0 0 1 0 1 0 1 1 0 0 0 1 1 4 V Val G Gly 0 1 1 1 0 0 1 0 1 0 0 1 1 0 1 0 1 0 0 1 1 0 1 1 13 11 1 0 0 1 1 0 1 0 0 1 0 1 0 1 1 0 0 0 0 1 0 1 1 1 4 L Leu 4 R Arg 4 1 0 1 0 0 0 1 0 0 1 1 1 0 1 1 0 1 0 0 1 1 0 0 1 12
Figure 2 –Representation of the first 24 whole numbers (outer columns) in the non power repre-sentation defined by the positional weights[1 1 2 4 7 8](length-6 binary strings, horizontal rows). The degeneracy number (D), number of binary strings that represent the same whole number, and the corresponding amino acids are shown in the centre of the table. The colors indicate the parity of each string (white=odd, gray=even), see section 2.1.
the first two letters, as for example,[UUx] = [UUU, UUC, UUA, UUG]) specifies amino acids with degeneracy 4, while the other half specifies amino acids with non-4 degeneracy (i.e. 1, 2 or 3). Rumer’s key observation was that a global transformation acting on the bases, i.e., U,C,A,G↔G,A,C,U, transforms a codon of class 4 into a codon of class 1,2 or 3, and viceversa. In this respect, Rumer’s transformation reveals the existence of an intrinsic anti-symmetric property of the genetic code.
In a series of works (Gonzalez, 2004; Gonzalezet al., 2006, 2008) we have proposed a mathematical theory capable of explaining many structural properties of the degen-eracy distribution in the genetic code. The model is based on the so callednon-power representation of integer numbers (Wolfram, 2002). In this model, a length-6 binary string is assigned to every codon of the genetic code and a whole number, from 0 to 23, to the corresponding amino acid (including thestopsignals).
In usual representations every number is additively decomposed in a linear com-bination that involves the powers of a number b called thebasis of the numeration system. For example, in the decimal system (b = 10) the number 1365, means that 1365=1·103+3·102+6·101+5·100. Clearly, since such systems are bijective they cannot describe the genetic code assignments. Hence, we resorted to non-power num-ber representations. In non-power numnum-ber representations the positional values grow more slowly than the powers of the system basisb. In Gonzalez (2004) one of us proved that a unique set of non-power bases, i.e., 1, 1, 2, 4, 7, 8 describes exactly the degeneracy of the genetic code. Figure 2 describes the main features of the model (see caption); for more details see Gonzalezet al.(2008).
2.1. Dichotomic classes
find-ings led us to the definition of thedichotomic classes. The first and most straightforward dichotomic class is theparityof a codon, defined as the parity of the number of ones of the associated binary string. A question arises naturally: a codon is made up of three letters (bases); hence, how can we relate a mathematical operation on a binary string to the chemical properties of a codon? The answer is surprising. Biology tells us that each base — T,C,A, and G — can be classified according to chemical classes as follows:
{Purine; Pyrimidine} {R; Y} {A, G; C, T} {Keto; Amino} {K; Am} {T, G; A, C} {Strong; Weak} {S; W} {C, G; A, T}
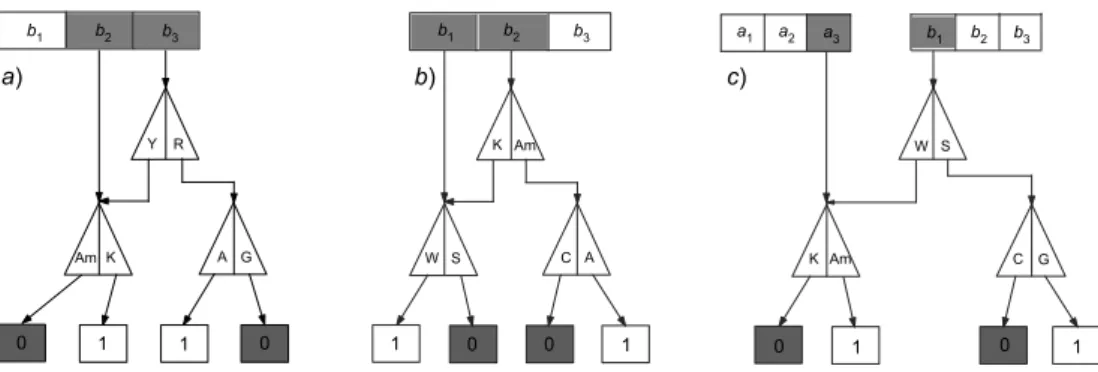
Now, it can be shown that the parity of the binary string can be obtained from the chemical classes of the last two bases of the codon. The algorithmic representation of the parity is shown in Fig. 3a. In words, the rule can be described as follows. If the last letter of the codon is a purine (R=A, G), the parity of the binary string is obtained immediately: an A corresponds to an odd string and a G to an even string. If the last letter is a pyrimidine (Y=U, C), in order to determine the parity we need to observe the chemical character of the previous base in the codon, that is, the second or middle base. However in such a case we have to consider a different chemical dichotomy: if the second base belongs to the Amino class (Am=C, A), the corresponding string is even; if, instead, it belongs to the Keto class (K=U, G), the corresponding string is odd.
In Gonzalezet al.(2008) we have shown that a similar rule holds also for the de-termination of the second dichotomic class, the Rumer’s degeneracy class (see Fig. 1 (right)). In order to achieve this: i)shift the analysis window to the first two bases of the codon, i i)consider the Amino-Keto dichotomy for the middle base, as suggested by the parity algorithm (see Fig. 3b),i i i)use the dichotomy class Strong (S=C, G) or Weak (W=U, A) for the first base. Again, it can be shown that the Rumer class can be obtained from the parity of the associated string (work in progress). A third dichotomic class, thehiddenclass, can be obtained by a further shift to the left of the window. The algorithmic representation of the hidden class is shown in Fig. 3c.
K
0 1 1 0
Am A G
R Y c) b) a) b 3 b 2 Am 1 0 1 1 K A C W S b 1 a 3 a 2 a 1 W Am b 3 b 2
0 1 0 1
S G C K b 1 0 b 3 b 2 b 1
Figure 3 –Algorithmic representation of the dichotomic classes:a) parity class,b) Rumer’s class,
c) hidden class.
natu-rally to the definitions of dichotomic classes associated to codons. Such classes possess a manifold nature; in fact, from the biology side, they can be obtained from the chemical classes of the bases. On the mathematics side, they are related to the parity of the as-sociated binary string and can be seen as nonlinear matrix operators (not shown here). Furthermore, the dichotomic classes are associated to a set of global transformations of the bases. In Gonzalezet al.(2008), we have proved that such transformations define a Klein V commutative group.
The mathematical structure uncovered raises important questions from many dif-ferent point of views and suggests new directions of research. First, from a foundational perspective, it is crucial to investigate how such structure relates to the origin and evo-lution of life. Is it afrozen accidentor did it undergo evolution? Is the same structure present in other codes found in nature? If not, can we put in relation all these structures from an evolutionary perspective?
A second class of questions regards the impact of the newly found structure on the understanding of the genetic machinery. In fact, the introduction of dichotomic classes provides a new way of interpreting the informational structure of DNA sequences. Also, we have shown that the genetic information contained in a codon is not simply that of the corresponding amino acid; indeed, there exists a complex structure that cor-relates the information content of a given codon with that of neighboring ones. This finding implies some surprising consequences from both chemical and informational points of view. Such properties seem to be associated with the possibility of error de-tection/correction mechanisms.
The answer to such questions is not easy but we can get some insights from the statistical analysis presented in the following sections.
3. STATISTICAL METHODS
The study of the dependence structure of DNA sequences has revealed very important in many fields, from theoretical biology to the most applied disciplines such as com-putational biology, phylogenetics and bioinformatics. In this section we discuss and motivate the use of statistical methods for dependent sequences in the context of the mathematical model proposed. We are able to uncover the existence of a complex de-pendence structure in protein coding DNA. Such structure implies that each base plays a different role in the organization of genetic information. First, we describe the meth-ods used, that is the Moving Block Bootstrap (hereafter MBB) and an entropy based dependence metric. Second, we show the results of the application of such methods to binary sequences of dichotomic classes derived from protein coding portions of DNA.
3.1. The moving block bootstrap for stationary sequences
Consider the discrete parameter stationary time series Xt = (X1,X2, . . . ,Xn,). Let µ,σ2
0,γk, andρk (k =0, . . . ,n−1)be the mean, variance, covariance and
autocorre-lation function ofXt, respectively. Note thatγ0=σ2
the estimator ¯X ofµ, is given by
σ2=Var¯ X=σ
2 0
n +2
n−1
X
k=1
(n−k)
n2 γk
=σ
2 0
n
1+2
n−1
X
k=1
(n−k)
n ρk
(1)
This equation is well known in the time series literature. For the general problem of es-timating the standard errorσone can see, e.g., Ripley (1987), where various approaches are discussed and where it is stressed out that it is not always a simple matter to find a reliable estimator forσ2. Especially in statistical mechanics it is introduced the
“inte-grated correlation time”:
τ= Z∞
0
ρ(t)d t
and the variance ofXtis usually written as:
σ2=σ2 0
1+2τ
δt
(2)
where δt is the time interval between two successive observations. This is a quite important parameter giving the whole information on the correlation structure of the observed data. However, in general, the decay law with time for correlation functions is not known, so that we have to rely on an estimate ofτ. It is known that the estimate of τthrough standard methods presents a number of difficulties and necessarily sometimes rather arbitrary approximations are involved. There are also further important points to stress. First, even though one succeeds in estimating the autocorrelation through standard methods based on linear relationships, such an estimate may be misleading if the time series is not linear. Second, if the series is in the form of a binary series generated via a discretisation of some other sequence, the autocorrelation estimated by standard methods depends on the coding procedure. We have shown (see Gonzalez et al.(2006)) that with the MBB it is possible to estimate directlyσ2and from it derive
an estimate ofτ. The method has shown to overcome the issues mentioned above. In the statistical literature (see, e.g., Bühlmann (2002),Politis (2003)), the break-through of the MBB is rightly ascribed to Künsch (1989), moreover the related work by Liu and Singh (1992) is also cited. Some precursory ideas of blocking methods for estimation in time series are referred to Hall (1985) and back to Bartlett (1946). Curi-ously enough, people seem to ignore that the idea of the MBB as a extension of the i.i.d. bootstrap for dependent data appeared in a paper in the field of high energies physics by Gottliebet al.(1986). These authors, applied the jackknife procedure to Monte Carlo calculations in lattice gauge theory. Further, referring explicitly to Efron (1979), they explained the advantages in bootstrapping blocks to handling dependent data.
all possible contiguous blocks of lengthlare considered. In this way,q“moving blocks” Q1,Q2, . . . ,Qq,(q=n−l+1)are obtained. Thei-th blockQ
iwith starting pointxi
containsl elements, i.e.:
Qi≡(xi,xi+1, . . . ,xi+l −1)
with 1≤i≤q.
From these q blocksQi (i = 1, . . . ,q) we draw at random with replacement h (h×l=n)blocks. The starting point of each block is selected from a uniform distribu-tion of integer(1, . . . ,q), so that allQi’s are equally likely to be drawn. Thehselected blocks, placed one after the other, form the new full size seriesQ∗= (Q∗
1,Q ∗ 2, . . . ,Q
∗
h).
Analogously to the “classical” i.i.d.-bootstrap, we can form a suitable number of MBB replicationsQ∗
from each of which the statistic of interest is computed and the MBB estimateσˆ∗
ofσis derived. A crucial point is the choice ofl with respect to the total length of the chain, since we require that the correlation between observations belong-ing to different blocks has to “die out”. So, with increasbelong-ing l, the data belonging to different blocks become more and more independent of one another, until the blocks are actually i.i.d. random variables under the MBB scheme, and at the same time, inside each block the correlation is retained. In practice, by plottingσˆ∗
as a function ofl, it appears that, in presence of a positive (negative) correlation in the series the plot ofσˆ∗
vs l shows an increase (decrease) ofσˆ∗
until, forl larger than a certainl′
, it reaches a region (plateau), in which it remains nearly constant, signalling that the mutual inde-pendence of the blocks has been achieved and the value found forσˆ∗
may be assumed as an estimation of the standard error. Moreover the “strength” of the correlation may be derived from (2).For a review of variants of this method see Politis (2003)
3.2. An entropy based dependence metric
In this section we describe briefly and motivate the use of an entropy based dependence metric for the analysis of binary sequences. In literature, many different dependence measures have been proposed. Each of these measures has specific features and different motivations; an important class of such indices is based on entropy functionals (see e.g. Crutchfield and Feldman (2003) and ref. therein) that underwent a great diffusion in the context of nonlinear dynamics as well as time series analysis (Grangeret al., 2004). In this work we have implemented the metric entropy measureSρ, a normalized version of the Bhattacharya-Hellinger-Matusita distance, defined as follows:
Sρ(k) =1 2
Z Z q f(X
t,Xt+k)(x1,x2) −
q fX
t(x1)fXt+k(x2) 2
d x1d x2
where fX t(
·)and f (Xt,Xt+k)(
·,·)denote the probability density function ofX
t and of the
normalized and takes the value 0 ifXt andXt+kare independent and 1 if there is a mea-surable exact (nonlinear) relationship between the variables,i i i)it reduces to the linear autocorrelation function in the case of gaussian variables and, notably,i v)it is invariant with respect to continuous, strictly increasing transformations. Among other things, Grangeret al.(2004) address the issues of nonparametric kernel estimation ofSρ(k)and of its utilization in the context of hypothesis testing of serial dependence. The measure has been proven to have robust power for characterizing nonlinear processes (see e.g. Gianneriniet al.(2007)). In the case of binary series the measure becomes
Sρ(k) =1 2
1
X
i=0 1
X
j=0
Æ P r
Xt=i,Xt+k=j −
Æ
P r{Xt=i}P r{Xt+k=j}
2
Here the probabilities have been estimated in a nonparametric fashion by means of relative frequencies.
In the following we will how how the measureSρ(k)can be used for studying the dependence structure of DNA sequences. The null hypothesis we test is that of indepen-dence, that is, the absence of an informational organization between codons. Clearly, such test has to take into account the different proportions of bases across DNA se-quences, i.e., the possible correlations found does not have to depend either from the proportion of bases of from the definition of the classes. The above requirements can be satisfied by resorting to a permutation scheme. The original DNA base sequence is randomly permuted. On this new sequence, we compute the dichotomic classes and estimate the measureSρ(k)on them. The procedure is repeatedBtimes (sayB=5000) as to obtain the bootstrap distribution ofSρ(k)under the null hypothesis. Clearly, each permutation of the original data preserves the original proportion of bases. Also, the computation of the measure Sρ(k)on two binary sequences obtained from the same random permutation of DNA bases automatically accounts for correlations induced by the mathematical definition.
4. RESULTS AND DISCUSSION
In this section we present some results of the application of the methods presented in the previous section to several protein coding DNA sequences. Each sequence can be considered as is or be complemented, that is, consider the complementary sequence (anticodon sequence) in the Watson-Crick sense. Furthermore, together with the usual reading frame, there are the two sequences derived from the frame shifts. In fact, as redundant information can be codified along the sequences in unknown ways, it is also interesting to study the out of frame versions of both codon and anticodon sequences.
Recall that, for independent data, i.e. realizations of i.i.d. binomial variables, the standard error of the estimator of the proportion pof 0s in the sequences is given by
ˆ
0 20 40 60 80 100 0.010
0.015 0.020 0.025
block length
ap0 ap0_perm
ah0 ah0_perm
^
*
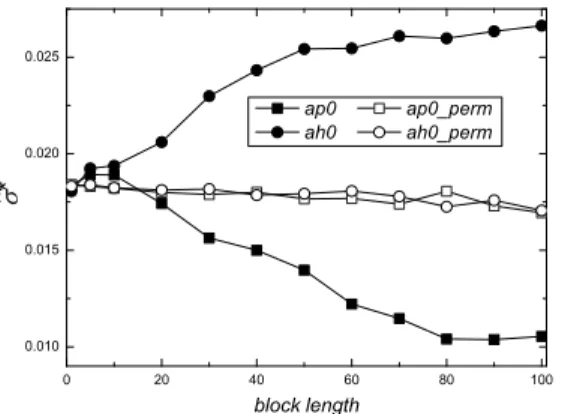
Figure 4 –Moving Block Bootstrap estimatesσˆ∗
of the standard error of pas a function of the block lengthl, for the parity (ap0, full squares) and hidden (ah0, full circles) codon classes, both computed with no frame shift for the anticodon sequence U53218 (coding region), withn=739. Results obtained by applying the MBB to the same codon classes, but with the original DNA base sequence randomly permuted are reported in empty symbols (ap0_permandah0_perm).
A representative example of the MBB application is shown in Figure 4. The figure reports the behavior of the MBB estimatesσˆ∗
of the standard errors of the estimator of p as a function of the block length l for the parity (ap0, full squares) and hidden (ah0, full circles) codon classes, both computed with no frame shift for the anticodon sequence U53218 (house mouse muscle glycogen synthase mRNA), with length of the codon sequencen=739. We also report the results obtained by applying the MBB to the same codon classes, but with the original DNA base sequence is randomly permuted (ap0_permandah0_perm, empty symbols). The bootstrap replicationsBare 2000 in all cases. Notice that, the length of the sequencenrefers to the codon sequence. The length of the base sequence inn×3.
If the data were independent there would be no statistical difference in the standard errors estimates between observed and i.i.d.-sequences. The values of ˆp are 0.472 and 0.447 forap0andah0, respectively. The values ofσˆ0are 0.018 for bothap0andah0.
First, let us follow the trend referring toah0(full circles). At the beginningσˆ∗
is very close toσˆ0, as expected. With increasing l,σˆ∗
grows. Around, say, l ≈70,σˆ∗ reaches a plateau. On the plateau, the actual dependence structure of data is captured, and the value found for σˆ∗
may be retained as an estimate for the standard errorσ. Here, it resultsσˆ∗=
0.026. By replacingσˆ0andσˆ∗
in (2), withδt =1, it follows that the integrated correlation time isτˆ=0.51.
The parity codon class (ap0, full squares) displays a decrease of σˆ∗
asl increases The decrease ofσˆ∗
up to the plateau aroundl ≈80 indicates that in this instance the correlation is negative. Here, it resultsσˆ∗ =
0.010,τ is negative and equal to−0.35. Note that for the both original DNA base permuted sequence (empty symbols), σˆ∗
remains always close toσˆ0.
0 20 40 60 80 100 0.020
0.025
ah0 ah0_perm1
ah0_perm ah0_perm3
block length
^
*
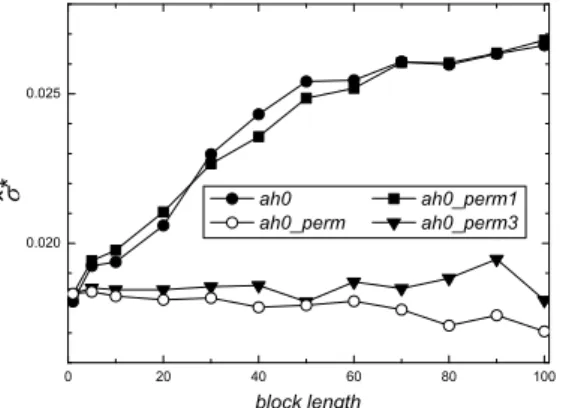
Figure 5 –Moving Block Bootstrap estimatesσˆ∗
of the standard error ofp as a function of the block lengthl, for the hidden (ah0, full circles) codon classes, computed with no frame shift for the anticodon sequence U53218 (coding region), withn=739. Results obtained by applying the MBB to the same codon class, but with the original DNA base sequence randomly permuted are reported in empty circles (ah0_perm), as in Figure 4. Results with only the first base permuted (ah0_perm1, full squares), with only the third base permuted (ah0_perm3, full triangles) are also reported.
original DNA sequence. As far as the hidden class is concerned, the second base is not involved by the non linear rule which determines this class (even for the reverse complementarity sequence), so we permuted only the first or the second base. Figure 5 shows the behavior of the MBB estimatesσˆ∗
as a function of the block lengthl: i) for the hidden codon class (ah0, full circles), i i)with the original DNA base sequence randomly permuted (ah0_perm, empty circles), both as in Figure 4,i i i)with only the first base permuted (ah0_perm1, full squares), i v)with only the third base permuted (ah0_perm3, full triangles). It appears that the permutation of the first base does not alter the dependence structure of the resampled sequences, while such a dependence is destroyed when the third base is permuted; indeed, in this case the trend ofσˆ∗
(full triangles) remains always close to that ofσˆ∗
with all the bases permuted (empty circles).
With regard to the parity class, we observe an analogous behavior, of course with a different role played by each base. The parity class is determined by the first and second base, but in this case the sequence is read in reverse sense, so that it is the third base that plays no role. From Figure 5, it appears that now the dependence structure is destroyed by the permutation of the first base (full triangles), while when only the second base is permuted, a negative correlation is still apparent.
Further different DNA sequences have been studied; preliminary results seems to corroborate the above findings, i.e., that only one base is responsible of the dependence structure of the binary sequences, whereas the permutation of other bases has a minimal influence over the correlation of resampled sequences w.r.t. to the original one.
0 20 40 60 80 100 0.010
0.015 0.020
block length ap0 ap0_perm1
ap0_perm ap0_perm2
^
*
Figure 6 –Moving Block Bootstrap estimatesσˆ∗
of the standard error of pas a function of the block lengthl, for the parity (ap0, full squares) codon classes, computed with no frame shift for the anticodon sequence U53218 (coding region), withn=739. Results obtained by applying the MBB to the same codon class, but with the original DNA base sequence randomly permuted are reported in empty squares (ap0_perm), as in Figure 4. Results with only the first base permuted (ap0_perm1, full triangles), with only the second base permuted (ap0_perm2, full circles) are also reported.
Sρ
(
k
)
lag
Sρ
(
k
)
lag
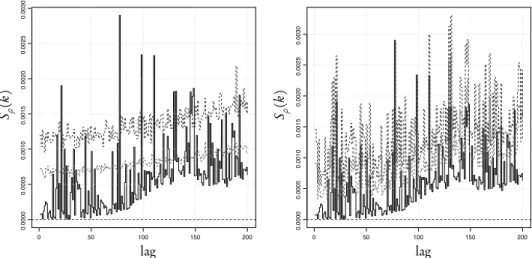
Figure 7 – Sρ(k),k=1, . . . , 200 for the hidden class of the anticodon sequence in frame U53218. The confidence bands at 95% and 99% are indicated with (light and dark) gray dotted lines. The bands are obtained by permuting: (left) the whole sequence; (right) the first bases.
0 50 100 150 200 0 50 100 150 200
0.0000
0.0005
0.0010
0.0015
0.0020
0.0025
0.0030
0.0000
0.0005
0.0010
0.0015
0.0020
0.0025
hidden class of the anticodon sequence U53218. The black solid line indicates Sρ(k) computed on the original sequence. The confidence bands of the two panels reflect two different hypotheses: in the left panel the bands are obtained by permuting the whole sequence; this corresponds to testing against a i.i.d. Bernoulli process having the same global proportion of bases as the original sequences. Clearly, there are many lags at which the test rejects the hypothesis (15 lags at 99%). This confirms the complex nature of the structure underlying protein coding sequences. A step towards the explanation of these correlations is put forward with the test depicted in Figure 7 (right). In this case, we have hypothesized that the probability distribution of the bases plays a different role according to its position in the codon. In other words, we take into account the position of the bases in the codon so that we permute just the first bases. The results are in agreement with those from the MBB. In fact, we observe that the significant lags at 99% drop from 15 to 5 (see how the confidence bands change). Notice that if we permute bases in position one and two the results do not change as long as we do not change the third bases. This means that the third base is responsible for most of the (auto)correlation found in the sequence.
5. CONCLUSIONS
In this contribution we have shown that the organization of genetic information can be studied from first principles, mainly, by using an abstract mathematical description of the Euplotes nuclear genetic code. The main result we found using different methods for studying the dependence structure of protein coding sequences is that there exist a strong correlation related to the mathematical structure of the code. Our hypothesis is that such correlation structure is related to the possibility of error detection/correction. In previous works, we have proposed that the structure of the nuclear genetic code is related to the necessity of maintaining protein synthesis accuracy. Due to the discrete character of the genetic information this endeavour is very similar to the problem of transmitting digital information along transmission channels in man made technologi-cal applications. Thus, in the case of the genetic code, we hypothesize that its structure is related to the existence of error detection/correction means based on such structure and directed to ensure the accuracy of protein translation.
REFERENCES
M. S. BARTLETT(1946). On the theoretical specification and sampling properties of autocorrelated time-series. Supplement to the Journal of the Royal Statistical Society, 8, no. 1, pp. 27–41. P. BÜHLMANN(2002).Bootstraps for time series. Statistical Science, 17, pp. 52–72.
J. P. CRUTCHFIELD, D. P. FELDMAN(2003). Regularities unseen, randomness observed: levels of entropy convergence. Chaos, 13, no. 1, pp. 25–54.
B. EFRON(1979). Bootstrap methods: Another look at the jackknife. The Annals of Statistics, 7, pp. 1–26.
S. GIANNERINI, E. MAASOUMI, E. BEEDAGUM(2007).Entropy testing for nonlinearity in time series. InBulletin of the International Statistical Institute, 56th session. ISI.
D. L. GONZALEZ(2004). Can the genetic code be mathematically described. Medical Science Monitor, 10, no. 4, pp. 11–17.
D. L. GONZALEZ, S. GIANNERINI, R. ROSA(2006). Detecting structure in parity binary se-quences: Error correction and detection in dna. IEEE Engineering in Medicine and Biology Magazine, 25, pp. 69–81.
D. L. GONZALEZ, S. GIANNERINI, R. ROSA(2008). Strong short-range correlations and di-chotomic codon classes in coding dna sequences. Physical Review E, 78, no. 5, p. 051918. S. GOTTLIEB, P. B. MACKENZIE, H. B. THACKER, D. WEINGARTEN(1986).Hadronic coupling
constants in lattice gauge theory. Nuclear Physics B, 263, pp. 704–730.
C. W. J. GRANGER, E. MAASOUMI, J. RACINE(2004).A dependence metric for possibly nonlinear processes. Journal of Time Series Analysis, 25, no. 5, pp. 649–669.
P. HALL(1985). Resampling a coverage pattern. Stochastic Processes and their Applications, 20, pp. 231–246.
R. D. KNIGHT, L. F. LANDWEBER(2000).The early evolution of the genetic code. Cell, 101, no. 6, pp. 569 – 572.
H. K. KÜNSCH(1989). The jackknife and the bootstrap for general stationary observations. The
Annals of Statistics, 17, pp. 1217–1241.
R. Y. LIU, K. SINGH(1992). Moving blocks jackknife and bootstrap capture weak dependence. In R. LEPAGE, L. BILLARD(eds.),Exploring the Limits of Bootstrap, Wiley, New York, pp. 225– 248.
D. N. POLITIS(2003). The impact of bootstrap methods on time series analysis. Statistical Science, 18, pp. 219–230.
B. D. RIPLEY(1987).Stochastic Simulation. Wiley, New York.
S. WOLFRAM(2002).A new kind of science. Wolfram Media, Inc., Champaign, IL.
SUMMARY
The mathematical structure of the genetic code: a tool for inquiring on the origin of life
![Figure 2 – Representation of the first 24 whole numbers (outer columns) in the non power repre- repre-sentation defined by the positional weights [1 1 2 4 7 8] (length-6 binary strings, horizontal rows)](https://thumb-us.123doks.com/thumbv2/123dok_us/8083725.2141864/4.833.141.740.156.297/figure-representation-sentation-defined-positional-weights-strings-horizontal.webp)