*Corresponding Author: Akila Chandra Sekhar,
Assistant Professor,
Molecular Genetics and Functional Genomics Laboratory, Department of Biotechnology, School of Life Sciences,
Yogi Vemana University, Kadapa - 516002, Andhra Pradesh, INDIA.
E-mail: [email protected] Reaseach Article
Comprehensive phenotypic and statistical based analysis of
Foxtail Millet (Setaria italica L.) lines for parental line
selection
Palakurthi Ramesh1, Gurulakshmi Kola1, Mallikarjuna Gunti1, Puli Chandra Obul Reddy2,
Jayanna Naik Banavath2 and Akila Chandra Sekhar*1
1Molecular Genetics and Functional Genomics Laboratory, Department of Biotechnology, School of Life Sciences,
Yogi Vemana University, Kadapa - 516002, Andhra Pradesh, India.
2Plant Molecular Biology Laboratory, Department of Botany, School of Life Sciences, Yogi Vemana University,
Kadapa - 516002, Andhra Pradesh, India.
Received: 9/19/2017; Accepted: 9/25/2017
Abstract: Minor millets are the small-grained cereals that belong to family Poaceae, with local importance as a food source but are often called as underutilized plant species. Foxtail millet is one among the oldest cultivated small diploid, C4 Panicoid, with short life cycle, and inbreeding nature. The genetic diversity of the foxtail millet is important for breeding systems, geographical distribution studies, and assist in conservation of genetic resources for high yielding varietal development in breeding programs, expansion of the genetic base and for identification of genes for various phenotypic traits. Keeping in view of this an attempt has made to develop pure lines from local farmers preserved populations and phenotypically characterize them along with four released cultivars. A total of eleven farmer’s varieties and four released cultivars were evaluated for seven quantitative traits in complete random block desing at net house conditions. The maximum coefficient of variation was observed for panicle exertion, followed by number of tillers/plant and panicle weight. High positive significant correlations was observed for Plant height, panicle length, panicle weight and total seed weight with other traits under study. Panicle exertion exhibit negative correlations with panicle length, panicle weight and no of tillers. The results of principal component analysis (PCA) explains variability of 95.43% in the fifteen genotypes for the traits under study that corresponds to first 4 Eigen values with greater than 0.60. The proportions of the total variance explained by the first 4 principal components (PCs) were 42.98%, 71.02%, 85.43% and 95.43% respectively. Wards method based genetic similarity or dissimilarity clustering based on seven morphological traits among the fifteen foxtail millet genotypes was able to separate and grouped them into 2 major clusters I and II. The genetic and phenotypic variability present in the foxtail millet genotypes give opportunity for plant breeders for effective selection of specific donor lines for foxtail millet improvement.
Keywords: Setaria italica, Foxtail Millet, Farmer lines, Diversity
Introduction
Minor millets or small millets are the cereals with small-grains belonging to the family Poaceae, and often termed as underutilized crops with local importance as a source of food. These are called underutilized plant species, by the fact that they are locally abundant in developing countries but globally rare with less or scanty scientific information with limited economic potential (Gruère et al., 2006). Setaria italica (L.) P. Beauv. Commonly known as Italian millet or German millet or Chinese millet or foxtail millet, and it is one of the oldest domesticated small diploid C4 Panicoid cereal grains in Eurasia (Sakamoto., 1987; de Wet., 1995). Small plant stature, comparatively small genome (1 C ~ 515 Mb; 2n = 2x = 18), low amount of repetitive DNA, short life cycle, and inbreeding nature has made it a good experimental model crop to investigate differnt plant architectural traits, physiological attributes of the C4 Panicoid grass crops and comparative genetics
with other cereals and millets (Doust et al., 2009; Li and Brutnell 2011; Zhao et al., 2013).
implications for agriculture and for food security. Keeping in view, there is a urgent need for conservation of genetic resources as a) Genetic resources are crucial to cope with climate change. b) As the future needs are unknown, maximum available genetic resources have to be conserved with an appropriate strategy to rely primarily on insitu conservation with exsitu gene banks being complementary. Insitu may not be less costly, but the costs are mainly borne by farmers, whereas the benefits are private and public. Farmer varieties / landraces are evolved under local environmental conditions or selection was done in low input farming systems by framers (Terzopoulos and Bebeli, 2008). The characteristics of landraces were identified based on historical origin, lack of formal genetic improvement, recognizable identity, local adaptation, and high genetic variation. Morphological and phenotypic based description is the first step for crop germplasm characterization (Smith & Smith 1989), and understanding of these characters aid the selection of desirable lines with traits for development of new cultivars (Santalla et al., 2001).
Statistical based multivariate tools form the basis for simultaneous analysis of multiple sets of phenotypic and genotypic data and subsequently, classify genotypes into groups on the basis of dissimilarity basis and is widely used for genetic
diversity analysis. Principal component analysis (PCA) was used to identify redundancy of the genotypes with similar characters and their elimination (Adams, 1995) while two-way cluster analysis for identification and separation of core subset of genotypes with distinct phenotypic traits. Principal component analysis (PCA) and two-way cluster analysis are two important statistical programs that aid in selecting elite germplasm lines for breeding program that meet the goal of a breeder for the development of improved varieties (Mohammadi and Prasanna, 2003). Clustering of genotypes based on morphological and physiological information of crops is effectively used to understand relationship of diverse germplasm. Multivariate analysis was effectively used for genetic diversity studies in many crops such as foxtail millet (Upadhyaya et al., 2015).
The important objective of any plant breeding program is to identify a variety or line that explain maximum phenotypic and genotypic variability in a plant from its vegetative to harvest stage. The present study was undertaken with an objective of identification of elite germplasm line(s) by means of morphological and yield traits to understand the association of various secondary traits, PCA and two-way cluster analysis which would enable to classify them into distinct phenotypic groups based on their genetic variability
Table 1. Foxtail millet genotypes
S. No Name of the VarietyType Source
1 S1G1 Farmer Variety Eipperu ATP
2 S1G2 Farmer Variety Eipperu ATP
3 S1G4 Farmer Variety Eipperu ATP
4 S2G1 Farmer Variety Korrapadu KDP
5 S2G2 Farmer Variety Korrapadu KDP
6 S3G2 Farmer Variety Duddala, KDP
7 S3G4 Farmer Variety Duddala, KDP
8 S1C1 Farmer Variety Eipperu ATP
9 S1C2 Farmer Variety Rakatla ATP
10 S2C1 Farmer Variety Korrapadu KDP
11 S2C2 Farmer Variety Korrapadu KDP
12 Narasimharaya Released Cultivar RARS, Nandyal, AP., India
13 Srilaxmi Released Cultivar RARS, Nandyal, AP., India
14 Prasad Released Cultivar RARS, Nandyal, AP., India
15 Krishnadevaraya Released Cultivar RARS, Nandyal, AP., India
Materials and Methods
Plant Materials:
A subset of eleven foxtail millet farmer varieties along with four released cultivars were used for the study (Table 1).
Experimental Design and Data Collection:
These fifteen foxtail millet genotypes for evaluation and characterization carried out in green house were grown in randomized complete block design during kharif, 2012. Each genotype was grown in 3 rows in a 3 m length plots each with 20 cm x 10 cm spacing between plants respectively. Observations were collected and tabulated from randomly selected five plants in each genotype for seven quantitative characters viz., plant height,
panicle exertion, panicle length, panicle weight, total seed weight, days to maturity and number of tillers and were subjected to analysis of variance.
Statistical Analysis:
multivariate hierarchical cluster analysis (Wards method) using JMP software package (version 13, SAS Institute Inc., 2016).
Results and Discussion
The analysis of variance explained significantly high phenotypic variation among the genotypes for all traits under study. This indicates the lines studied were genetically diverse and exhibit statistically significant variability with in the genotypes, with an opportunity to utilize them for breeding activities like varietal development, conventional genetic hybridization etc., Substantial variations in foxtail millet have been reported in previous studies by Rao et al., (1994) and Reddy et al., (2015). The range, mean, standard deviation and coefficient of variation for 7 quantitative traits among fifteen foxtail millet genotypes are represented in Table 2 & 3.
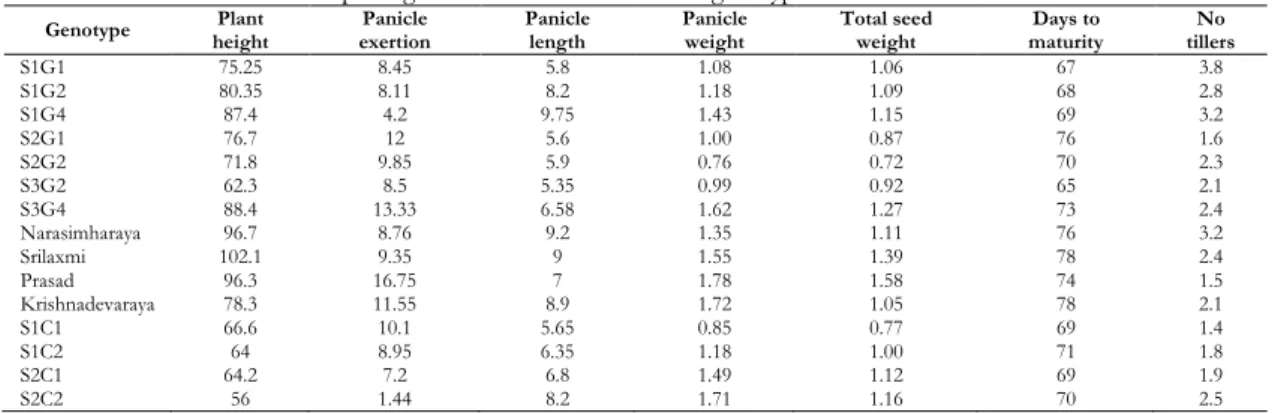
Plant height among the genotypes shows a wide range of 46.1 cms with Sirlaxmi being tallest with 102.1 cms when compared to S2C2 genotype with small stature of 56 cms respectively. Phenotypic variability among the genotypes for the trait number of tillers is 3.2 with S1G1 being the line with more number of tillers 3.8 number of tillers while Prasad showed 1.5 tillers per plant. Similarly, panicle exertion among the genotypes studied has a difference of 15.31 cms across the genotypes with genotype PRASAD (16.75 cm) having highest values and S2C2 (1.44 cm) having lowest values respectively. Genotypes S1G4 and S3G2 are with bigger and smaller panicle length of 19.75 cms and 5.35 cms with an range of 4.4 cms respectively while, for the trait days to maturity S3G2 is a shortest duration with 65 days compared to Srilaxmi and Krishnadevaraya of the longest duration with 78 days respectively. Genotypes S2G2 is showing less panicle weight (0.78 g) while, Prasad is the one with highest panicle weight of 1.78 grams and same pattern of the highest and lowest seed weight per panicle was observed with the lines S2G2 and Prasad being recorded lowest (0.72 g) and highest (1.58 g) of total seed weight per panicle respectively.
In the earlier studies, similar results on wide range of phenotypic variation for the traits plant height and grain yield per plant (Rao and Parathasarathi, 1968), panicle length (Jiaju, 1986) and plant height and productive tillers (Rao et al., 1994) was observed in foxtail millet and other small millets. Such diversity within the foxtail millet genotypes tested would provide wide range of parental line selection for its genetic improvement through direct selection from the germplasm lines or by conventional intraspecific hybridization programs to get a wide range of segregating mapping populations for desirable traits. The coefficient of variation was found high for the traits, panicle
exertion (38.83%), followed by number of tillers/plant (35.36) and panicle weight (28.47) which hints a scope for selecting lines with high yielding potential with in the foxtail millet genotypes for its further improvement.
Grain yield is one of the important but a complex character that is influenced by number of other secondary associated traits of compound and complex nature. Knowledge on the association between yield and other association traits and within other complex phenotypic traits helps in improving the efficiency of parental line selection. The correlation between traits may exist due to such as pleiotropy, linked with quantitative trait loci or genetic segments with linked genes governing variability for different traits located on same chromosome. It has been generally accepted that correlation between different traits represents a coordination of physiological processes which governed by linked genes or genetic segments. The association of all 7 morphological traits was estimated by correlation analysis (Table 4). Plant height, panicle length, panicle weight and total seed weight had significant positive correlations with all other traits. Panicle exertion exhibit negative correlations with panicle length, panicle weight and number of tillers. Days to maturity exhibit negative correlations with number of tillers. Earlier studies showed significant positive association of grain yield per plant with days to flowering, panicle length (Chakraborty et al., 2001; Sharma and Sharma, 2007), flag leaf blade area (Sharma and Sharma, 2007) and 1000-grain weight (Sharma and Sharma, 2007). Maximum positive correlation observed among the traits with grain yield per plant indicated a cumulative effect of these associated traits towards the grain yield per plant. This also provide a hint that positive improvement of any of these traits will contribute for the yield improvement.
in the divergence and carried the largest portion of its variability. Second principal component explains 28% of the total variation. Traits that contributed to the second component include panicle exertion (0.65), followed by days to maturity (0.34) and plant height (0.14). All other characters contributed negative to the second component. The third principal component explain 14.41% of the total variation in the genotypes studied. Days to maturity expalin the highest (0.39) third principle component followed by number of tillers and panicle length contributed the highest (0.33).
Genetic similarity / dissimilarity evaluated by morphological traits using Ward method two-way cluster analysis among the fifteen lines of Setaria grouped into 2 major clusters I and II (Table 6 and Figure 2). Cluster I consist of four genotypes subdivided into two main sub clusters a and b. Subcluster-a included Narasimharaya and Srilaxmi
while, Subcluster-b included Prasad and Krishnadevaraya. Cluster II consists of eleven genotypes subdivided into two main sub clusters II a and II b. sub clusters II a included S1G1, S1G2, S1G4, S1C2, S2C1 and S2C2. Sub clusters II b consists of S2G1, S3G4, S2G2, S1C1 and S3G2. Maximal distance (5.69) between S2G2 and PRASAD (Table 5). In the present study, the PCA analyses for morphological traits were almost like those of cluster results. The genotypes of PC1 formed cluster I of the dendrogram, and genotypes of PC2 formed cluster II of the dendrogram. In two-way clustering seven morphological traits also divided into two major clusters I and II. Clusters I contain plant height, days to maturity and panicle exertion. Clusters II contain panicle length, no of tillers, panicle weight and total seed weight. In earlier studies in foxtail millet, Reddy et al., (2015) observed a similar kind of results where genotypes with common phenotypic traits like high yielding varieties cluster in the same group.
Table 2. Mean values for 7 morphological traits in 15 foxtail millet genotypes
Genotype height Plant exertion Panicle Panicle length Panicle weight Total seed weight maturity Days to tillers No
S1G1 75.25 8.45 5.8 1.08 1.06 67 3.8
S1G2 80.35 8.11 8.2 1.18 1.09 68 2.8
S1G4 87.4 4.2 9.75 1.43 1.15 69 3.2
S2G1 76.7 12 5.6 1.00 0.87 76 1.6
S2G2 71.8 9.85 5.9 0.76 0.72 70 2.3
S3G2 62.3 8.5 5.35 0.99 0.92 65 2.1
S3G4 88.4 13.33 6.58 1.62 1.27 73 2.4
Narasimharaya 96.7 8.76 9.2 1.35 1.11 76 3.2
Srilaxmi 102.1 9.35 9 1.55 1.39 78 2.4
Prasad 96.3 16.75 7 1.78 1.58 74 1.5
Krishnadevaraya 78.3 11.55 8.9 1.72 1.05 78 2.1
S1C1 66.6 10.1 5.65 0.85 0.77 69 1.4
S1C2 64 8.95 6.35 1.18 1.00 71 1.8
S2C1 64.2 7.2 6.8 1.49 1.12 69 1.9
S2C2 56 1.44 8.2 1.71 1.16 70 2.5
Table 3. Patterns of genetic variability for 7 morphological traits in 15foxtail millet genotypes
Days to
maturity No tillars Panicle weight exertion Panicle Panicle length Plant height Total seed weight
Mean 71.53 2.27 1.24 9.24 7.22 77.76 1.09
SD 4.07 0.80 0.35 3.59 1.51 14.04 0.22
SE Mean 1.05 0.21 0.09 0.93 0.39 3.63 0.06
C.V. 5.69 35.36 28.47 38.86 20.93 18.06 19.83
Minimum 65.00 0.60 0.72 1.44 5.35 56.00 0.76
Maximum 78.00 3.80 1.78 16.75 9.75 102.10 1.58
Table 4. Correlation coefficients for 7 morphological traits in 15 foxtail millet genotypes
Correlations Height Plant Exertion Panicle Panicle Length Panicle Weight Total seed Weight Maturity Days to Tillers No of
Plant height 1
Panicle exertion .460 1
Panicle length .517* -.338 1
Panicle weight .363 -.091 .383 1
Total seed weight .614* .229 .462 .837** 1
Days to maturity .617* .439 .433 .144 .336 1
No tillers .220 -.464 .455 .148 .174 -.270 1
*. Correlation is significant at the 0.05 level (2-tailed). **. Correlation is significant at the 0.01 level (2-tailed).
Table 5. Principal component analysis for 7 morphological traits in 15 foxtail millet Genotypes – Eigenvectors.
Prin1 Prin2 Prin3 Prin4 Prin5 Prin6 Prin7
Plant height 0.50 0.14 0.28 0.36 -0.18 -0.62 -0.33
Panicle exertion 0.14 0.65 0.01 0.40 -0.14 0.23 0.56
Panicle length 0.41 -0.34 0.33 -0.40 -0.53 0.10 0.40
Panicle weight 0.41 -0.17 -0.61 -0.08 0.35 -0.36 0.41
Total seed weight 0.50 -0.01 -0.42 0.11 -0.18 0.57 -0.46
Days to maturity 0.37 0.34 0.39 -0.43 0.61 0.17 -0.09
Table 6. Genetic similarity/dissimilarity based on 7 morphological traits in 15 foxtail millet genotypes
Genotype S1G1 S1G2 S1G4 S2G1 S2G2 S3G2 S3G4 Narasimharaya Srilaxmi Prasad Krishnadevaraya S1C1 S1C2 S2C1 S2C2
S1G1 0.00
S1G2 2.09 0.00
S1G4 3.31 1.83 0.00
S2G1 4.76 4.12 5.44 0.00
S2G2 2.67 2.74 4.33 2.83 0.00
S3G2 2.45 2.71 4.31 3.62 1.90 0.00
S3G4 3.40 2.76 3.67 3.67 3.89 3.95 0.00
Narasimharaya 3.67 2.49 2.29 4.62 4.15 4.85 2.77 0.00
Srilaxmi 4.77 3.48 3.26 4.75 5.17 5.57 2.57 1.86 0.00
Prasad 5.40 4.52 5.18 4.67 5.69 5.60 2.19 4.24 3.09 0.00
Krishnadevaraya 4.23 3.11 3.99 3.14 3.17 4.27 3.51 2.78 3.38 4.67 0.00
S1C1 3.47 3.22 4.81 2.27 1.27 1.74 4.04 4.77 5.49 5.58 3.60 0.00
S1C2 2.85 2.27 3.72 2.49 1.95 1.81 2.91 3.75 4.28 4.56 3.03 1.70 0.00
S2C1 2.91 2.09 3.15 3.48 3.00 2.25 2.81 3.72 4.08 4.38 3.77 2.76 1.29 0.00
S2C2 3.85 3.03 2.85 5.24 4.51 3.87 4.29 4.13 4.60 5.78 4.79 4.52 3.14 2.19 0.00
Figure 1. Principal component analysis between PCs 1 and 2 showing contribution of various traits in variability of 15 foxtail millet genotypes based on 7 morphological traits
Figure 2. Two-way clusters showing the grouping of the 15foxtail millet genotypes based on 7 morphological traits.
Conclusion
Farmer conserved varieties/ landrace characterization is essential for plant breeders and here we showed utilization of combination of methods viz., phenotypic data and statistical multivariate statistical tools provide a means for estimating diversity of yield attributing traits between the genotypes. These tools are useful for the evaluation of potential plant breeding of crop improvement. However, this study suggests the need for breeders to exploit genotypes from distinct groupings for the development of foxtail millet/
breeding foxtail millet for specific traits. Principal component analysis indicated the presence of significant genetic variation for all traits within the genotypes used in this study. Intercrossing between genotypes of diverse origin or cluster groups would generate a segregating population with wide range of allelic combinations that explain maximum variability for effective selection of lines with desired characters such as high yielding cultivars. Here we showed that the farmer conserved lines have a differential yield phenotypic association compared to release cultivars and can be effectively use them as breeding parental lines forfoxtail millet development.
Acknowledgement
The first author is thankful to the University Grants Commission (UGC) for providing a fellowship under the National fellowship for Higher Education (NFHE).
References
1. Adams, M.W, “An estimate of homogeneity in crop plants with special reference to genetic vulnerability in dry season.” Euphytica. (1995): 26: 665-679.
2. Chakraborty, S., Das, P. K.., Guha, B., Barman, B. and Sarmah, K. K. “Coheritability correlation and path analysis of yield components in boro rice.” Oryza (2001): 38, 99-101.
3. Doust A.N, E.A Kellogg, K.M Devos, J.L Bennetzen, “Foxtail millet: a sequence-driven grass model system.” Plant Physiol (2009): 149:137–141.
4. Gruère G, A. Giuliani, M. Smale, “Marketing underutilized plant species for the Benefit of the Poor: A Conceptual Framework”. (2006): International Food Policy Research Institute.
5. Heerwaarden J. V., J. Doebley. W.H Briggs, J.C Glaubitz. M.M Goodman. J.D Jesus. S.G Gonzalez. J. Ross-Ibarra. “Genetic signals of origin, spread, and introgression in a large sample of maize landraces.” Proceedings of the National Academy of Sciences, USA (2011):108, 1088–1092.
7. Jiaju C. “Breeding and varietal improvement of foxtail millet in China. In Small Millet in Global Agriculture.” Proceeding of the First International Small Millet Workshop (Eds.). October 29-November 2, 1986. Bangalore, India: (1986): pp. 101-104.
8. Johnson RA, D.W Wichern, “Applied multivariate statistical analysis.” Prentice-Hall, Englewood Cliffs, NJ. (1988):
9. Johnson HW, Robinson HF, Comstock RE. Estimates of genetic and environmental variability in soybean. Agronomy Journal. 1955; 47: 314-318.
10. Li P, TP Brutnell. “Setaria viridis and Setaria italica, model genetic systems for the Panicoid grasses.” J Exp Bot 62 (2011): 3031–3037.
11. Mohammadi SA, B.M Prasanna, “Analysis of genetic diversity in crop plants-salient statistical tools and considerations.” Crop Sci. 43 (2003): 1235-1248.
12. Panse VG, PV Sukhatme, “Statistical methods for agricultural workers.” 2nd Ed. ICAR, New Delhi (1964):
13. Rao. DVN, Parathasarathi, AV. “Studies on genetic variability of certain phenotypic variations, genetic advance and heritability of certain quantitative characters.” Madras Agri. J. 55 (1968):392-397.
14. Rao KEP, De Wet, JMJ., Reddy, VG., Mengesha, MH “Diversity in the small millets collection at ICRISAT.” In K.E. Riley pp (1994): 331-345.
15. Reddy CVCM, P. Pullibai, J. Manjunath, P. Munirathnam, “Genetic diversity and genotype by trait analysis for yield & yield attributing traits in foxtail millet (Setaria italica (L.) Beauv.).” IJAIR 3(6) (2015): 1726-1731.
16. Spooner DM, K. Mclean, G. Ramsay, R. Waugh, GJ. Bryan, “A single domestication for potato based on multilocus amplified fragment length polymorphism genotyping.” Proceedings of the National Academy of Sciences, USA 102 (2005): 14694–14699.
17. Sharma AK and Sharma RN (2007). Genetic variability and character association in early maturing rice. Oryza. Vol 44(4) 300-303.
18. Upadhyaya HD, M. Vetriventhan, SP. Deshpande, S. Sivasubramani, J.G. Wallace, E.S. Buckler, CT. Hash, P. Ramu, “Population Genetics and Structure of a Global Foxtail Millet Germplasm Collection. The Plant genome. 8(3) (2015): 1-13.
Cite this article as:
Palakurthi Ramesh, Gurulakshmi Kola, Mallikarjuna Gunti, Puli Chandra Obul Reddy, Jayanna Naik Banavath and Akila Chandra Sekhar. Comprehensive Phenotypic and Statistical Based Analysis of Foxtail Millet (Setaria italica L.) Lines for Parental Line Selection. Annals of Plant Sciences 6.11 (2017) pp. 11736-1741.
doi: http://dx.doi.org/10.21746/aps.2017.6.11.4
Source of support: School of Life Sciences, Yogi Vemana University, Kadapa - 516002, Andhra Pradesh, INDIA