Final Report
MRF Quality Assessment Study
Material quality assessment of municipal MRFs within the UK
Project code: MRF011 ISBN: [Add reference]
WRAP helps individuals, businesses and
local authorities to reduce waste and
recycle more, making better use of
resources and helping to tackle climate
change.
Written by: Enviros Consulting
Front cover photography: Manual Picking © Enviros 2009
WRAP and Enviros Consulting Ltd believe the content of this report to be correct as at the date of writing. However, factors such as prices, levels of recycled content and regulatory requirements are subject to change and users of the report should check with their suppliers to confirm the current situation. In addition, care should be taken in using any of the cost information provided as it is based upon numerous project-specific assumptions (such as scale, location, tender context, etc.).
The report does not claim to be exhaustive, nor does it claim to cover all relevant products and specifications available on the market. While steps have been taken to ensure accuracy, WRAP cannot accept responsibility or be held liable to any person for any loss or damage arising out of or in connection with this information being inaccurate, incomplete or misleading. It is the responsibility of the potential user of a material or product to consult with the supplier or manufacturer and ascertain whether a particular product will satisfy their specific requirements. The listing or featuring of a particular product or company does not constitute an endorsement by WRAP and WRAP cannot guarantee the performance of individual products or materials. This material is copyrighted. It may be reproduced free of charge subject to the material being accurate and not used in a misleading context. The source of the material must be identified and the copyright status acknowledged. This material must not be used to endorse or used to suggest WRAP’s endorsement of a commercial product or service. For more detail, please refer to WRAP’s Terms & Conditions on its web site: www.wrap.org.uk
MRF Quality Assessment Study
3
Executive Summary
Enviros were commissioned by WRAP to undertake a nationwide (England, Wales and Northern Ireland)
assessment of the composition and quality of material currently being sent to MRFs and the associated quality of material then sent to reprocessors. In all 17 MRFs were included in the survey. A parallel project was
commissioned, with Resource Futures, for Scotland which recruited 1 MRF. All numbers and analysis in this report cover all 18 sampled MRFs.
The aim of these projects was to provide robust data on the composition of input, output and residual waste material at MRFs to provide information on the quality of material processed at MRFs and inform the waste management industry on current material quality benchmark thresholds.
A range (upper, lower and median) of contamination was identified for the input and each output material:
lower level – 25th percentile bound, meaning that one quarter of the MRF contamination was at this level or
below i.e. achieving this level of average contamination or better is very good in comparison to the rest of the sector;
middle level – 50% (or half) of the average output from MRF samples were in this range i.e. achieving this
level of contamination is on average comparable with the sector; and
upper level – 75th percentile bound, meaning that one quarter of the MRF contamination was at this level or
higher i.e. achieving this level of average contamination or higher is poor in comparison to the rest of the sector.
Basically, the MRFs with the lowest material contamination are shown in the lower level range. The 18 MRFs consisted of 13 single-stream MRFs and 5 twin-stream MRFs.
The analysis of these ranges can be done from two perspectives; that of comparing all the 4,676 individual samples taken; or that of comparing the average results for each of the 18 MRFs. The use of the individual samples may skew the ranges by allowing more weight to unusually good or bad MRFs, whereas the comparison of overall MRF figures is perhaps more realistic for benchmarking. For this report all analysis is carried out on MRF averages, with no data removed as sample sizes are low for some material streams.
The table below gives a quick and easy-to-use benchmarking comparison for MRFs. More detail on these ranges is given in the main body of this report, in particular MRF type breakdowns are given for output materials. Benchmarking ranges based on MRF average contamination figures
Material Stream Lower Level Median Level Upper Level Input Material All
All < 6.4% 6.4% to 17.5% > 17.5% Single-stream < 8.4% 8.4% to 17.5% > 17.5% Twin-stream – Fibre based < 2.9% 2.9% to 9.0% > 9.0% Twin-stream – Container based < 4.9% 4.9% to 22.6% > 22.6% Output Material
Aluminium < 0.9% 0.9% to 4.6% > 4.6% Steel < 2.8% 2.8% to 7.1% > 7.1% News and PAM <4.6% 4.6% to 15.0% > 15.0% Mixed Paper < 3.2% 3.2% to 25.3% > 25.3% Card < 4.8% 4.8% to 12.0% > 12.0% Mixed Plastic < 6.9% 6.9% to 26.6% > 26.6% Mixed Plastic bottles < 8.3% 8.3% to 16.2% > 16.2% HDPE Coloured Plastic Bottles < 6.9% 6.9% to 11.3% > 11.3% HDPE Natural Plastic Bottles < 1.9% 1.9% to 4.0% > 4.0% PET Clear <2.6% 2.6% to 9.5% > 9.5% PET Coloured < 5.6% 5.6% to 10.7% > 10.7% Residual (contamination is targeted
material)
All < 28.3% 28.3% to 80.9% > 80.9% Single-stream < 24.7% 24.7% to 61.7% > 61.7% Twin-stream – Fibre based < 33.0% 33.0% to 59.2% > 59.2% Twin-stream – Container based < 72.2% 72.2% to 88.0% > 88.0%
MRF Quality Assessment Study
4
Contents
1.0 Introduction ... 51.1 Background...5
1.2 Aims and objectives...5
1.3 Approach ...5
2.0 Sampling at as many MRFs as possible... 5
3.0 Classification of the MRFs ... 6
4.0 Collect composition data from the MRFs ... 7
4.1 How much waste? ...7
4.2 What type of sampling? ...8
4.3 What is the composition of the waste sampled? ...8
4.3.1 Input material...9
4.3.2 Residual material ...11
4.3.3 Output material ...12
5.0 MRF contamination ranges ... 17
5.1 Overview of contamination levels ...17
5.2 Material stream contamination benchmarking...18
5.2.1 Input material contamination...18
5.2.2 Residual material contamination ...19
5.2.3 Output material contamination...20
6.0 Updated sampling regimes... 24
7.0 Conclusions ... 26
Appendix 1: Abbreviations ... 30
MRF Quality Assessment Study
5
1.0
Introduction
1.1
Background
Enviros were commissioned by WRAP to undertake a nationwide (England, Wales and Northern Ireland)
assessment of the composition and quality of material currently being sent to MRFs and the associated quality of material then sent to reprocessors. In all 17 MRFs were included in the survey. A parallel project was
commissioned, with Resource Futures, for Scotland which recruited 1 MRF. All numbers and analysis in this report cover all 18 sampled MRFs.
This report is for MRF benchmarking and analyses the average figures for each of the 18 MRFs. As some material streams are only targeted by a small number of the MRFs no outlying figures have been excluded so as to maintain as much comparable data as possible.
1.2
Aims and objectives
The aim of these projects was to provide robust data on the composition of input, output and residual waste material at MRFs across England, Wales, Northern Ireland and Scotland. The data provides information on the quality of material processed at MRFs and can be used to inform the waste management industry on current material contaminant levels. There were six main project objectives:
1 recruiting and sampling at as many MRFs as possible; 2 define appropriate MRF sector classifications;
3 collate waste composition data on statistically representative samples of input, output and residual material; 4 assess the variability in the composition of material samples across MRF sector classifications;
5 identify a range (i.e. upper, lower and median) of contamination for input and each output material; and 6 using the data collected update recommendations within the current WRAP MRF sampling guidance1 on the
number and weight of samples required to ensure a robust ongoing monitoring regime.
This report is intended to provide summary responses to all of these objectives. It is not the intention of this report to comment or recommend that any particular MRF technology, design or configuration produces a particular quality of output material or separation performance.
For simplicity, there are a number of abbreviations used in the charts and tables presented throughout this report. A list of these abbreviations is in Appendix 1.
1.3
Approach
MRFs were selected through initial approaches from WRAP and final recruitment and confirmation from Enviros in England, Wales and Northern Ireland and Resource Futures in Scotland. It was agreed that the MRFs would either be: trained in how to sample and then supported in the process, of which there were 8 MRFs; or the sorting would be carried out by an Enviros team, of which there were 10 MRFs.
The sorting was carried out over intensive 5 to 10 day periods for the Enviros sort MRFs and over a more extended 2 or 3 month period for the self-sorting MRFs. Each sample was hand sorted into 19 material
categories on top of a 45mm sorting screen. Material that fell through the screen was classified as miscellaneous <45mm with the exception of samples of aluminium outputs and residual material where the material <45mm was sorted again into the same 19 material categories.
The sample weights, numbers of samples and sorting screen size were all taken from the WRAP MRF sorting protocol document. The definition of input, output and residual streams and the identification of sampling points was undertaken in conjunction with each MRF and WRAP.
2.0
Sampling at as many MRFs as possible
The number of MRFs included in the project has been maximised through rigorous recruitment and
communication with the MRF operators and owners. The final number taking part was 19% of the UK MRFs at 18 out of 93.
MRF Quality Assessment Study
6
MRFs were unable to take part for a variety of practical and business reasons including space on the site (as the recyclate market was slow at the beginning of 2009) and limited staff resource. There had been a hope that most MRFs would receive training and then carry out their own sorting, as this would add skills and experience into the MRF. However the limited staff resource meant there were more ‘full-sort’ MRFs than ‘training’ MRFs.
3.0
Classification of the MRFs
A site visit was made once a MRF was recruited during which various details of the MRF were collected. This included basic information on the configuration, confirmation on the type of input materials and target output materials as well as a health and safety assessment for on-site work. The configuration information detailed the material handling and material separation technologies for the MRF.
At the inception of the project it had been hoped that this information would allow the classification of the MRFs into clearly defined groups / sectors based upon the technology used. It soon became clear that various factors made this task impractical. Firstly the fact that only 18 MRFs were included means that any range of classes would have little or no statistical validity.
The second point is that the design and operation of a MRF is very specific to local operating conditions and contractual commitments. The original purpose of groups/sectors was to define them by factors that could restrict or influence the MRFs ability to affect material quality; whereas in fact any MRF can achieve any quality of material and the number of different combinations used to achieve this is too broad. If we had standardised on the design and operation at the time of the visit the potential classes would have had so few MRFs in each that the grouped analysis would have given no advantage over individual analysis.
The other area for classification looked at was in terms of materials processed. The output materials of the MRFs are related to the inputs and this area did allow for one classification of MRFs by how the material was presented; as either a single input stream or two input streams.
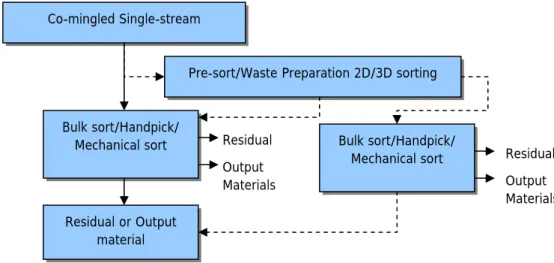
Figure 1 Single-stream (Type 1) input and material processing MRF arrangement
Co-mingled Single-stream Bulk sort/Handpick/ Mechanical sort Residual or Output material Residual Output Materials
Pre-sort/Waste Preparation 2D/3D sorting
Bulk sort/Handpick/
Mechanical sort Residual Output Materials
MRF Quality Assessment Study
7
Figure 2 Twin-stream (Type 2) input and material processing MRF arrangement
In a single-stream MRF the input material is presented in one co-mingled mix (Type 1). In twin-stream MRFs there are two different co-mingled inputs, usually one of co-mingled fibres (paper, card etc) and one of containers (HDPE, PET bottles etc) (Type 2). Whilst theoretically both MRF types could achieve similar output material quality, the risk of cross contamination between fibre based materials and containers is likely to be less where this material is collected separately rather than a single mix. The 18 MRFs were split 13 of Type 1 and 5 of Type 2.
Overall the project agreed that the data report would manage the analysis by classification of MRFs by reviewing the material quality in the two types and across each anonymous MRF. This report only considers the
composition and material quality (i.e. level of contamination) across all MRFs sampled and then by the two classification types.
4.0
Collect composition data from the MRFs
4.1
How much waste?
Around 272 tonnes of material was hand sorted over a 6 month period from a total of 18 MRFs. Around 115 tonnes of material was sorted by 8 training MRFs and 157 tonnes of material was sorted by the Enviros project sorting team from 10 full sort MRFs. In terms of MRF sector classification there was 190 tonnes of waste sorted from Type 1 (single input stream) and 82 tonnes of waste from Type 2 (two input streams).
The 272 tonnes was made up of 85.7 tonnes of input material, 179.8 tonnes of output material and 6.6 tonnes of residual material. Table 1 below shows these tonnages are broken down by MRF sector, sampling approach (i.e. training or full sort, and sample type.
Stream 1 (Usually Fibres) Stream 2 (Usually Containers) Bulk sort/Handpick/ Mechanical sort Bulk sort/Handpick/ Mechanical sort Residual or Output material Residual or Output material Residual Output Materials Residual Output Materials
MRF Quality Assessment Study
8
Table 1 Quantity of material sampled
Input Outputs Residual
Type Data Type Number of Samples Sorted Total Weight of Material Sorted (kg) Number of Samples Sorted Total Weight of Material Sorted (kg) Number of Samples Sorted Total Weight of Material Sorted (kg) Type 1 Full 40 4,210 190 9,413 10 264 Type 1 Full 41 3,595 102 3,459 11 302 Type 1 Training 40 4,017 202 10,543 10 315 Type 1 Training 40 4,630 189 10,976 10 365 Type 1 Training 44 4,684 239 13,718 11 444 Type 1 Training 41 4,648 262 12,053 10 314 Type 1 Full 40 4,531 270 14,069 10 334 Type 1 Full 39 2,328 226 11,562 10 265 Type 1 Full 40 4,160 230 13,231 10 418 Type 1 Full 40 4,297 250 11,769 10 289 Type 1 Full 40 3,874 264 13,432 10 614 Type 1 Training 40 3,844 150 5,597 10 305 Type 1 Training 37 2,621 91 4,740 6 188 Type 1 training 242 24,444 1,133 57,627 57 1,931
Type 1 full sort 280 26,995 1,532 76,935 71 2,486
Type 1 sub total 522 51,439 2,665 134,562 128 4,417
Type 2 Training 80 7,087 170 5,577 10 188 Type 2 Training 80 7,724 230 10,164 20 546 Type 2 Full 40 4,594 190 10,177 10 329 Type 2 Full 80 9,978 250 12,429 20 825 Type 2 Full 40 4,918 131 6,874 10 321 Type 2 training 160 14,811 400 15,741 30 734
Type 2 full sort 160 19,490 571 29,480 40 1,475
Type 2 sub total 320 34,301 971 45,221 70 2,209
Total training 402 39,255 1,533 73,368 87 2,665
Total full sort 440 46,485 2,103 106,415 111 3,961
Total 842 85,740 3,636 179,783 198 6,626
4.2
What type of sampling?
The sampling for this project was based on understanding the contamination levels of the material streams at the MRFs. So the sampling strategy at the MRFs was set to enable statistical validity of the contamination levels within the sample set. The numbers and weights of samples were based on research undertaken by WRAP on a previous project. There was no attempt to weight the sampling according to the throughput tonnage of each MRF or any observations around the relative balance of input in the two-streams of a Type 2 MRF. Also, within any particular MRF, the sampling of each input, output and residual stream was carried out independently. In essence this means that the figures quoted in this report around composition are valid and accurate but should not be used to scale up to a full material mass balance.
4.3
What is the composition of the waste sampled?
The following sections discuss the composition of the input, residual and output streams from the MRFs. Summary graphs and tables are presented in each section, but the full compositional results for the ‘All MRF’, ‘Type 1’ and ‘Type 2’ MRFs are shown in Tables A2.1, A2.2, and A2.3 in Appendix 2.
MRF Quality Assessment Study
9
4.3.1
Input material
The compositional result for input material is represented below in Figure 3,4,5. Naturally the inputs to the MRF come in the main from local authority kerbside collections, so Table 2 shows the make up of the input samples in this study grouped by the four main categories of materials collected at the kerbside (excluding glass). In terms of the sorting categories (see Appendix 1, Table A1 for abbreviations) these cover:
paper: News & Mag, Other R Pa;
plastic bottles: Clr PET, Col PET, Nat HDPE, Col HDPE, Oth bott;
card: Brwn brd, G&W brd; and
cans: Alu cans, Ste cans.
Table 2 Main materials in input material sampled % Composition Material
Full
Data Type 1 MRFs Type 2 MRFs
Paper 36.8 46.6 20.8
Plastic Bottles 17.6 10.4 28.5
Card 14.6 16.6 11.3
Cans 15.0 7.5 27.3
Other 16.0 18.9 12.1
Whilst not a mass flow of input material received at MRF, this does indicate that the most common material in the input samples is paper, with bottles, card and cans at similar but much lower percentages. Type 1 MRFs follow the main pattern but for Type 2 there is a more even split between bottles and cans, with paper third. This may be due to a bias introduced as each of the two-streams was sampled equally by number of samples, and not weighted to the ratio of each stream (as mentioned in section 4.2).
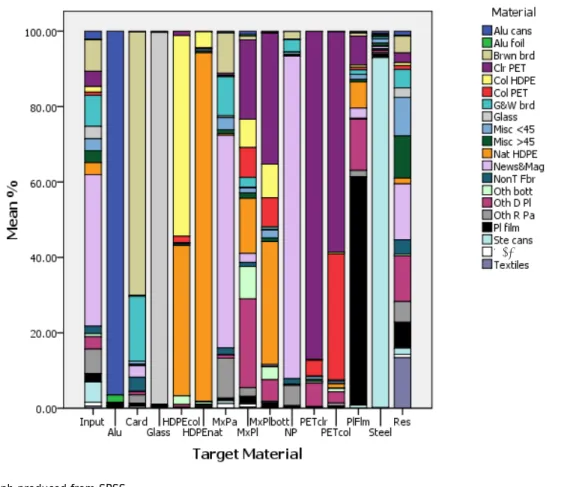
Figure 3 Inputs, outputs and residual composition across all MRFs
Graph produced from SPSS.
MRF Quality Assessment Study
10
Figure 4 Input, output and residual composition across all Type 1 single-stream MRFs
Graph produced from SPSS.
Figure 5 Input, output and residual composition across all Type 2 twin-stream MRFs
Graph produced from SPSS.
BevC BevC
MRF Quality Assessment Study
11
4.3.2
Residual material
A quantity of materials received at a MRF is either missed by the process at the MRF and not recovered to the output streams, or should not have been in the input: these leave the MRF in the residual waste.
In some cases materials are accepted in the input stream but not recovered as an output and so leave the MRF in the residual waste. This is done to accommodate the varying types of material collected across different
authorities that feed into the same MRF and/or to increase participation and/or material capture rates by including a simple message to the public; “plastics” rather than the targeted material “HDPE and PET plastic bottles” for example. Within some MRFs it was noted that some materials that would normally be left to leave the MRF in the residual waste are recovered and sold as an output material due to the volume of contaminating material received in the input.
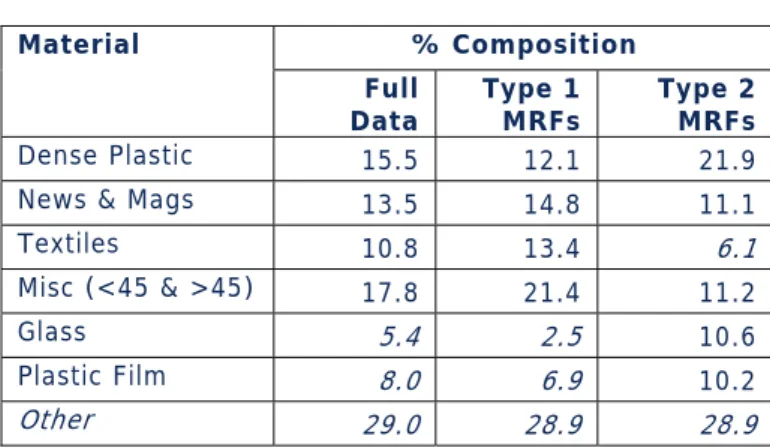
The main materials (those of more than 10% composition) in the residual waste for the full data set and for single-stream Type 1 MRFs are dense plastic, newspaper and magazines, textiles and miscellaneous. For twin-stream Type 2 MRFs the textiles are replaced by glass and plastic film.
Table 3 Main materials in residual material sampled % Composition Material
Full
Data Type 1 MRFs Type 2 MRFs
Dense Plastic 15.5 12.1 21.9
News & Mags 13.5 14.8 11.1
Textiles 10.8 13.4 6.1
Misc (<45 & >45) 17.8 21.4 11.2
Glass 5.4 2.5 10.6
Plastic Film 8.0 6.9 10.2
Other 29.0 28.9 28.9
It is not surprising that ‘miscellaneous’ makes up a large proportion due to the various processes the materials have been through. The miscellaneous materials arrives in the residual waste either by being positively picked or removed as contaminant as part of a quality control process or left on the conveyor once all other output materials are positively picked. The materials included within this category are ‘true contaminating materials’ that were not targeted by the MRF. They will comprise composite materials or unidentifiable material i.e. material that is severally contaminated beyond recognition such as paper soaked in food liquid.
Dense plastic is only targeted in 8 of the 18 MRFs but due to a lack of public awareness can be put into the kerbside collection schemes and so it comes through into the residual. Paper is invariably targeted into different output grades within a MRF but comes through into the residual. This can be a result of the different separation processes involved and the different particle size ranges of the material. For example, if newspaper and
magazines are positively picked as an output material then the material remaining on the conveyor belt continues into the residual. So paper with a small particle size range maybe missed. Unless mechanical or optical sorting equipment is 100% efficient again not all material will be recovered. The speed of the conveyor picking belt will also influence how much of the paper is picked. MRF throughput versus output material quality or the proportion of targeted material leaving the MRF as residual is often a local commercial decision. The difference with textiles will be biased due to it being targeted in only 2 of 13 single-stream Type 1 but 2 of 5 Type 2 MRFs.
The residual waste should contain a minimum amount of the materials generally targeted by the authority collection schemes (as per Table 2). The percentage of the residual due to each of these materials is shown in Table 4. This is illustrative and not the same as the actual missed recyclate in the residual as the different MRFs accept a range of materials. An interesting point is that paper is the main common input material in the residual waste probably due to the reasons already outlined. Plastic bottles, card and cans are of broadly similar
proportions. These figures should be as close to 0% as possible. However, this probably reflects the efficiency of the various sorting options operating within a MRF. Clearly, the proportion of common input materials in the residual waste is a reflection of residual waste not being positively removed but instead being the point at the end of the MRF process once all output materials have been removed. For example, it is unlikely that plastic bottles would be positively picked as a contaminant and placed into the residual waste stream.
MRF Quality Assessment Study
12
Table 4 Common targeted materials in residual material sampled % Composition
Material
Full
Data Type 1 MRFs Type 2 MRFs
Paper 18.7 20.3 15.7 Plastic Bottles 7.3 6.3 9.0 Card 8.5 9.3 6.9 Cans 3.5 2.7 5.0 Other 62.0 61.4 63.4
4.3.3
Output material
The outputs categories to be sampled were dictated by the materials that are targeted at each MRF and those requested to be sampled by WRAP. Not all output materials at each MRF were sampled. The list of the headline materials is quite standard with the occasional material only targeted by a few MRFs. However another area of difference across the MRFs was which sub-category they accept in the headline material (e.g. foil in aluminium cans).
For the 18 MRFs in the survey the number that targeted each material stream is shown in Table 5 as is the number of those streams that were sampled.
Table 5 Materials targeted at # of 18 MRFs in project Targeted
by # MRFs at # MRFsSampled
Aluminium 18 18
Steel 18 18
News & PAMs 12 12
Card 14 12 Mixed Paper 10 9 Mixed Plastic 8 8 Mixed Bottles 8 8 Plastic Film 8 1 Nat HDPE 6 6 Clear PET 5 4 Textiles 4 0 Col HDPE 3 3 Glass 3 1 Col PET 2 2 Bev Cartons 1 0
The output materials at the MRFs are by-and-large made up of the correct type of material, e.g. all forms of plastic output are mainly plastic (rather than metal or paper based materials), however within each specific output stream there can be a mixture of materials. This section captures some of the key findings from this analysis.
For the main output streams that were sampled the results are shown in Figures 6,7 and 8 (the full data is in Appendix 2). It should be noted that the following analysis looks at the composition of each stream and not the contamination. Having material other than the main category is not the same as contamination, as what is acceptable in the main category can vary between MRFs. For example coloured PET can have clear PET in it, so Clear PET is not a contaminant and the MRF may not attempt to separate it.
Table 6 has the summary data for Figure 6 and shows that the can streams are very closely controlled and well segregated. This is almost certainly a function of the value of these streams to the MRF and the technology used to separate them being robust and in most cases unlikely to pick the wrong material, e.g. a magnet will pick up
MRF Quality Assessment Study
13
ferrous based material such as steel cans and an eddy current separator non-ferrous materials such as aluminium cans. However, like any bulk separation process, this can and will capture other material that is either wrapped around the targeted material, gets caught up in the recovery, or is similar in magnetic/non-magnetic properties. For example beverage cartons where the internal lining has similar material properties to aluminium so it can get recovered by an eddy current separator.
The proportion of ‘non-cans’ in the aluminium is lower than for steel which is thought to be driven primarily by the significant higher aluminium revenue and purity requirements specified by the reprocessor. In most cases this justifies the additional investment in further quality control procedures after the bulk separation process.
Aluminium cans contamination is lower in Type 2 MRFs. This is not surprising as the Type 2 MRFs surveyed during this project were smaller scale MRF operations with lower throughputs than the single-stream Type 1 MRFs, therefore the costs of additional quality control after the eddy current separator are less.
A further point to note is that a magnet to recover ferrous materials is often positioned before the eddy current separator, therefore, as this bulk separation process is recovering targeted materials from a greater mix of materials the risk of other materials getting caught in this recovery process is higher than during the aluminium recovery process which is often at the end of the process from a simple material mix.
The proportion of non-steel can material is less in twin-stream Type 2 MRFs. For Type 2 only container based materials are being processed on the container conveyor when steel cans are being recovered by the over band magnet, whereas in single-stream Type 1 MRFs the over band magnet tends to operate over a greater mix of material and hence greater risk of picking up other contaminating materials during the process.
Table 6 Composition of can based outputs by each metal category and non-metal categories Alu Cans % Composition Steel Cans % Composition Cans Outputs
Full
Data Type 1 MRFs Type 2 MRFs Data Full Type 1 MRFs Type 2 MRFs Aluminium Cans 96.29 96.47 95.84 0.84 0.67 1.25 Aluminium Foil 1.98 1.98 1.98 0.12 0.13 0.1 Steel Cans 0.25 0.28 0.17 93.93 92.81 96.67
Non-cans/foil 1.48 1.27 2.00 5.12 6.39 1.99
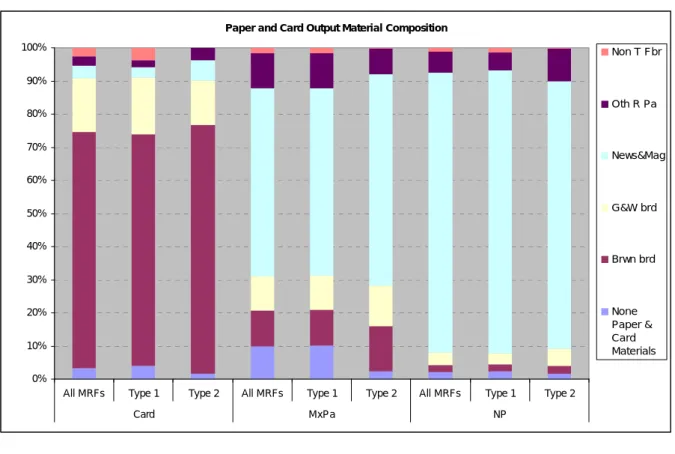
Table 7 has the summary data for Figure 7 and shows that there is a relatively good separation of card and news and PAMs in their own streams. However, there is a mixture of paper types in each of the output materials. The mixed paper is made up of over half News and PAMs and a further fifth of card.
These results are in line with the expectation when the relative financial value of the news and PAMs and mixed paper streams are considered. At the time of this project the price differential was lower and so the need to maximise News and PAMs was not strong. There is also a need for some News and PAMs in the mixed paper stream in order to meet the reprocessor specifications.
The card outputs consist primarily of card based material most of which is corrugated brown board material which is often recovered at the pre-sort stage.
The News and PAM outputs are over 80% newspaper and magazines and in total around 90% when including other recyclable paper which is often included in this material specification. Whilst there is some non-targeted fibre (more so in single-stream Type 1 MRFs thought to be a result of more mechanical and optical sorting processes) this figure is low as is the quantity of fibre based materials. As expected the proportion of non-fibre based materials is higher in single-stream Type 1 MRFs where the News and PAM output is sorted from a mix of materials in comparison twin-stream Type 2 MRFs where the material is sorted from fibre input stream.
MRF Quality Assessment Study
14
Table 7 Composition of ‘paper and card’ based outputs as by each ‘paper and card’ category and non-‘paper and card’ categories
Card % Composition Mixed Paper %
Composition News and PAMs % Composition Paper and Card
Outputs
Full
Data Type 1 MRFs Type 2 MRFs Data Full Type 1 MRFs Type 2 MRF Data Full Type 1 MRFs Type 2 MRF Brown Board 71.35 69.83 75.13 10.76 10.67 13.75 2.13 2.04 2.49 G&W Board 16.12 17.18 13.49 10.45 10.40 12.18 3.67 3.30 5.18 News & Mags 3.90 3.03 6.05 56.64 56.41 63.89 84.54 85.52 80.61 Other Recy Paper 2.62 2.21 3.64 10.49 10.58 7.61 6.22 5.31 9.89 Non-targeted fibre 2.69 3.73 0.10 1.70 1.75 0.28 1.23 1.48 0.22
Non-Paper & Card 3.33 4.02 1.61 9.95 10.19 2.30 2.21 2.36 1.62
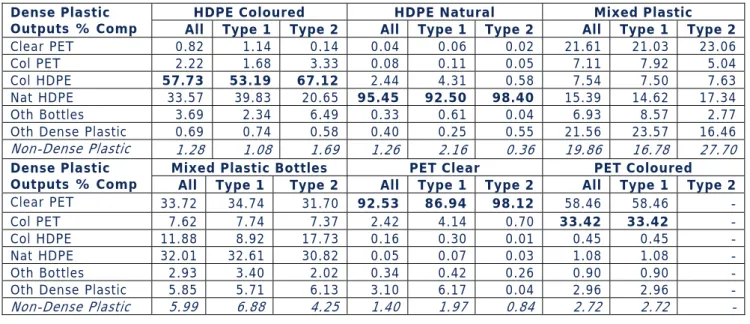
Table 8 has the summary data for Figure 8 and shows that the plastic outputs consist of a large mix of material types. The clear PET and natural HDPE are the two main plastic streams that contain the least other dense plastics. This is likely to be due to the constraints on quality enforced by the markets, the higher price these two materials attract and the nature of the materials. These two material outputs tend to be positively picked from the conveyor or targeted by optical sort processes. The coloured HDPE and coloured PET outputs generally contain some of the natural and clear counterpart. The issue here is in the potential loss of the price differential by having the natural and clear material in the coloured output. The analysis clearly shows some MRF
configurations are positively collecting these materials together rather than separating them into their polymer types, which will be a local consideration on the economic viability of the investment required, and expected return, to warrant these materials being kept separate. However, what is clear is that even when natural and coloured HDPE and PET are collected separately within the same MRF, a large proportion of the clear bottles are still collected in the coloured stream resulting in a potential loss of income which could be rectified without significant investment.
Mixed plastic and mixed plastic bottles are, as expected, a mix of the various grades of plastic, but the higher value natural HDPE and clear PET may need to be in the mix to meet the market needs, however this analysis is not known as part of this report. What is interesting to note is that mixed plastic is the only output stream with a significant amount of completely unconnected materials present. Overall nearly 20% of the mixed plastic is fibre, metal, plastic film or <45mm miscellaneous. Further work could be done to investigate this but it may be related to the point of the process that mixed plastic is collected. The other materials are positively picked out and the mixed plastic is often negatively picked remaining as ‘last off the line’ it will almost certainly pick up more residual material depending on the effectiveness of the quality control procedures within the MRF for removing residual contaminants. In most cases the MRFs collecting mixed plastics only positively picked one other plastic output either as mixed bottles, PET or HDPE natural bottles with the remaining mix of plastics being retained in the mixed plastic output. There were a number of opportunities to recover additional polymer types through either optical or manual sorting, however a point of consideration raised is that if all of the ‘high value’ bottle polymers are removed from the mixed plastic, this action in itself as noted above could reduce the value of the mixed plastic output or make this product unmarketable.
MRF Quality Assessment Study
15
Table 8 Composition of dense plastic based outputs as each dense plastic category and non-dense plastic categories
HDPE Coloured HDPE Natural Mixed Plastic Dense Plastic
Outputs % Comp All Type 1 Type 2 All Type 1 Type 2 All Type 1 Type 2 Clear PET 0.82 1.14 0.14 0.04 0.06 0.02 21.61 21.03 23.06
Col PET 2.22 1.68 3.33 0.08 0.11 0.05 7.11 7.92 5.04
Col HDPE 57.73 53.19 67.12 2.44 4.31 0.58 7.54 7.50 7.63 Nat HDPE 33.57 39.83 20.65 95.45 92.50 98.40 15.39 14.62 17.34 Oth Bottles 3.69 2.34 6.49 0.33 0.61 0.04 6.93 8.57 2.77 Oth Dense Plastic 0.69 0.74 0.58 0.40 0.25 0.55 21.56 23.57 16.46
Non-Dense Plastic 1.28 1.08 1.69 1.26 2.16 0.36 19.86 16.78 27.70
Mixed Plastic Bottles PET Clear PET Coloured Dense Plastic
Outputs % Comp All Type 1 Type 2 All Type 1 Type 2 All Type 1 Type 2 Clear PET 33.72 34.74 31.70 92.53 86.94 98.12 58.46 58.46 - Col PET 7.62 7.74 7.37 2.42 4.14 0.70 33.42 33.42 -
Col HDPE 11.88 8.92 17.73 0.16 0.30 0.01 0.45 0.45 -
Nat HDPE 32.01 32.61 30.82 0.05 0.07 0.03 1.08 1.08 - Oth Bottles 2.93 3.40 2.02 0.34 0.42 0.26 0.90 0.90 - Oth Dense Plastic 5.85 5.71 6.13 3.10 6.17 0.04 2.96 2.96 -
Non-Dense Plastic 5.99 6.88 4.25 1.40 1.97 0.84 2.72 2.72
-Figure 6 Composition of can based outputs showing mix of metal categories with non-metal materials grouped
Cans Output Material Composition
0% 10% 20% 30% 40% 50% 60% 70% 80% 90% 100%
All MRFs Type 1 Type 2 All MRFs Type 1 Type 2 Alu Steel Ste cans Alu foil Alu cans None Cans & Foil Material
MRF Quality Assessment Study
16
Figure 7 Composition of paper and card based outputs showing mix of paper and card categories with non-paper and card materials grouped
Paper and Card Output Material Composition
0% 10% 20% 30% 40% 50% 60% 70% 80% 90% 100%
All MRFs Type 1 Type 2 All MRFs Type 1 Type 2 All MRFs Type 1 Type 2 Card MxPa NP Non T Fbr Oth R Pa News&Mag G&W brd Brwn brd None Paper & Card Materials
Figure 8 Composition of dense plastic based outputs showing mix of dense plastic categories with non-dense plastic materials grouped
Dense Plastic Output Material Composition
0% 10% 20% 30% 40% 50% 60% 70% 80% 90% 100% A ll M R F s Ty p e 1 Ty p e 2 A ll M R F s Ty p e 1 Ty p e 2 A ll M R F s Ty p e 1 Ty p e 2 A ll M R F s Ty p e 1 Ty p e 2 A ll M R F s Ty p e 1 Ty p e 2 A ll M R F s Ty p e 1 Ty p e 2
HDPEcol HDPEnat MxPl MxPlbott PETclr PETcol
Oth D Pl Oth bott Nat HDPE Col HDPE Col PET Clr PET None Dense Plastic Materials
MRF Quality Assessment Study
17
5.0
MRF contamination ranges
The main requirement of this project was to understand the quality of material received at MRFs (input material) and material leaving MRFs and sent to reprocessors (MRF outputs). For this we needed to define the level of contamination that was in each material stream. As mentioned earlier there is a broad consistency over the detailed definition of the contents of a material stream but there are some variations in what is accepted. For example for some MRFs aluminium foil was considered a contaminant in aluminium cans.
There are two ways that the contamination was analysed: across all individual samples taken in the project and across each MRF. Naturally the number of samples is very high and so gives a large sample size compared with the 18 individual MRF figures, however it also exposes the analysis to a higher bias when one MRF has a particular characteristic. It also exposes maximum and minimum limits to the extremes of individual samples. For example the maximum contamination in an aluminium sample across all 524 samples was 25.6% but the largest average MRF contamination for aluminium over the 18 MRFs was 2.5%. This clearly shows that a schedule of samples is needed to address quality and not just a programme of infrequent spot checks.
The analysis in this report focuses on the overall MRF data to give a better indication of what can be expected in ranges of performance for a MRF.
5.1
Overview of contamination levels
The level of variation in the quality of output materials between MRFs was significant. However this varied on a material basis. For example, just because the output quality of one output material was poor does not mean that all the output materials in the same MRF were also highly contaminated. The quality of some output materials was very good.
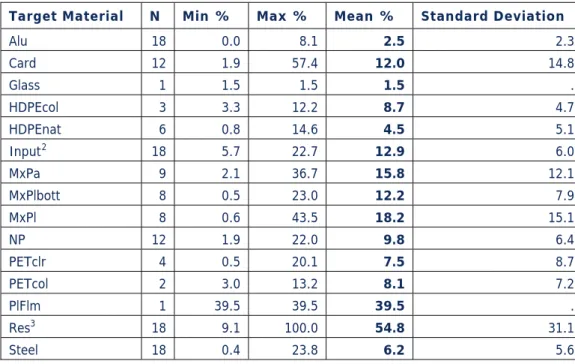
Table 9 shows the average contamination rate for all the material streams. Residual is shown to have the most contamination but that would be expected. In fact 54.8% contamination does mean that there is potentially 45.2% targeted material not recovered by the MRF. However the actual tonnage of residual waste in relation to MRF throughput is small and much of it is small particle size and recovery by manual picking would be difficult i.e. ripped paper.
Table 9 All MRF average contamination rates (%)
Target Material N Min % Max % Mean % Standard Deviation
Alu 18 0.0 8.1 2.5 2.3 Card 12 1.9 57.4 12.0 14.8 Glass 1 1.5 1.5 1.5 . HDPEcol 3 3.3 12.2 8.7 4.7 HDPEnat 6 0.8 14.6 4.5 5.1 Input2 18 5.7 22.7 12.9 6.0 MxPa 9 2.1 36.7 15.8 12.1 MxPlbott 8 0.5 23.0 12.2 7.9 MxPl 8 0.6 43.5 18.2 15.1 NP 12 1.9 22.0 9.8 6.4 PETclr 4 0.5 20.1 7.5 8.7 PETcol 2 3.0 13.2 8.1 7.2 PlFlm 1 39.5 39.5 39.5 . Res3 18 9.1 100.0 54.8 31.1 Steel 18 0.4 23.8 6.2 5.6
MRF Quality Assessment Study
18
The lowest levels of contamination across all samples were in aluminium cans at 2.5% on average. The low contamination level in aluminium is thought to be driven primarily by the significant higher aluminium revenue and purity requirements specified by the reprocessor. In most cases this justifies the additional investment in further quality control procedures.
The greatest level of contamination in output materials was found in the plastic film 39.5%, mixed plastic 18.2% and mixed paper 15.8%. Cross contamination was evident within most MRFs where materials targeted were recovered in other output materials.
An indication of the likely main contaminants for the main output materials sampled is provided below:
input - miscellaneous >45mm, glass and other dense plastic;
aluminium - other dense plastic, miscellaneous <45mm, aluminium foil;
card – non-target fibre, other dense plastic, plastic film;
HDPE natural – coloured HDPE, other dense plastic, miscellaneous <45mm;
mixed paper - miscellaneous <45mm and >45mm material, beverage cartons, brown board;
mixed bottles – other dense plastic >45mm miscellaneous material, plastic film;
mixed plastic - miscellaneous <45mm material, newspaper and magazines, grey an white board;
news and PAM – brown board, grey and white board, non-target fibre;
steel - miscellaneous <45mm material, aluminium cans, plastic film; and
residual – other dense plastic, textiles, plastic film, miscellaneous <45mm and >45mm material.
5.2
Material stream contamination benchmarking
The analysis in this section focuses on the range of contamination that is found in each stream. The contamination range is defined by looking across the 18 MRFS at the:
minimum, this is the lowest contamination rate the survey found;
25th percentile bound, meaning that one quarter of the MRF contamination was at this level or below;
mean, being the average contamination rate across the sample;
75th percentile bound, meaning that one quarter of the MRF contamination was at this level or higher; and
maximum, this is the highest contamination rate the survey found.
So when looking at benchmarking the tables in each subsequent section will allow a MRF that performs its own analysis to benchmark itself within one of six ranges formed by the factors described above. This is not the same as statistical 95% upper and lower bound confidence intervals.
5.2.1
Input material contamination
The contamination of the input materials is broken out in Table 10 and represented graphically in Figure 9. The numbers have been split into the full set of 18 MRFs, the 13 Type 1 MRFs and the 5 Type 2. The twin-stream Type 2 MRFs have two distinct input streams and so for quality analysis these are separated out. The two main streams are the containers such as plastic bottles and cans and the fibres such as paper and card.
Table 10 Percentage contamination in input material across 18 MRFs
Material MRF Type Max
% 75
th
Perc Mean % 25 th
Perc Min % Input Full Data 28.61 17.48 12.00 6.37 0.79 Input Type 1 MRFs 22.54 17.48 13.10 8.37 5.72 Input (container) Type 2 MRFs 28.61 22.64 13.35 4.85 0.79 Input (fibre) Type 2 MRFs 9.00 9.00 6.74 2.86 2.08
The analysis of the individual samples showed there is a statistical significant difference in the contamination rates between the two types of MRF. Overall the figures show the level of contamination from the twin-stream co-mingled input samples was marginally lower than those from single-stream input samples. This may reflect households more diligent consideration of what materials can go into the recycling bin during the initial segregation into fibres and containers, or it may simply be a function of less targeted materials being in each group.
MRF Quality Assessment Study
19
Figure 9 Percentage contamination of input materials stream
Input Material % Contamination
0
5
10
15
20
25
30
35
All
Type 1
Type 2
Type 2
Input
Input Container
Input Fibre
Max
75th
Perc
Mean
25th
Perc
Min
Any MRF with an input contamination rate between the two lines on Figure 9 would be in the central 50% of MRFs within the analysis of this project.
5.2.2
Residual material contamination
The contamination of the residual materials is broken out in Table 11 and represented graphically in Figure 10. The numbers have been split into the full set of 18 MRFs, the 13 Type 1 MRFs and the 5 Type 2. The twin-stream Type 2 MRFs have two distinct input twin-streams and so for quality analysis these are separated out. The two main streams are the containers such as plastic bottles and cans and the fibres such as paper and card.
It is key to note that the contamination in residual material (i.e. materials not targeted by the MRF) should be read as good when high, this means the targeted materials are removed into the output streams and
contaminating material continue through into the residual waste.
Table 11 Percentage contamination in residual material across 18 MRFs
Material MRF Type Max
% 75
th
Perc Mean % 25 th
Perc Min % Residual Full Data 100.00 80.91 54.60 28.33 9.09 Residual Type 1 MRFs 100.00 61.70 48.99 24.70 9.09 Res (container) Type 2 MRFs 99.95 87.99 72.60 72.23 25.55 Res (fibre) Type 2 MRFs 80.91 59.24 48.94 32.95 29.33
The analysis shows that twin-stream Type 2 MRFs seem to allow more targeted material through in the fibre stream and less in the container stream than single-stream Type 1 MRFs. Figure 10 very clearly shows that the performance from the fibre stream of a twin-stream Type 2 MRF type is much better and more consistent. Single- stream Type 1 MRF types have a wider range of contamination levels, but also process a wider mix of materials within the same process.
MRF Quality Assessment Study
20
Figure 10 Percentage contamination of residual materials stream
Residual Material % Contamination
0
10
20
30
40
50
60
70
80
90
100
All
Type 1
Type 2
Type 2
Residual
Res Container
Res Fibre
Max
75th
Perc
Mean
25th
Perc
Min
Any MRF with a residual contamination rate between the two lines on Figure 10 would be in the central 50% of MRFs within the analysis of this project.
5.2.3
Output material contamination
The contamination of the output materials is considered in the same three groups as the composition. These groups are can based, paper and card based and plastic based. Each group is given its own analysis section below.
Can based outputs
The contamination of can based output streams is shown in Table 12 and represented graphically in Figure 11. As discussed in the compositional section the aluminium stream commands a strong market value and so is sorted very carefully. This is born out by aluminium having the lowest average contamination but also a very narrow band of performance across the sampled MRFs.
Table 12 Percentage contamination in can based output material across 18 MRFs
Material MRF Type Max
% 75
th
Perc Mean % 25 th
Perc Min % Aluminium Full Data 8.04 4.59 2.53 0.88 0
Type 1 MRFs 8.04 2.45 2.13 0.84 0 Type 2 MRFs 5.78 5.22 3.58 1.00 0.84 Steel Full Data 23.78 7.14 6.24 2.82 0.35 Type 1 MRFs 23.78 8.98 7.36 2.83 2.34 Type 2 MRFs 5.32 4.92 3.33 2.80 0.35
Steel cans have a slightly higher average contamination but a much wider band of performance. As discussed in the composition section, this could be due to the separation process and the position in which steel is often recovered in the overall MRF process.
MRF Quality Assessment Study
21
Figure 11 Percentage contamination of can based materials stream
Can Output % Contamination
0
5
10
15
20
25
All
Type 1
Type 2
All
Type 1
Type 2
Alu
Steel
Max
Cont
75th
Perc
Mean
25th
Perc
Min
Cont
Any MRF with a contamination rate between the two lines on Figure 11 would be in the central 50% of MRFs within the analysis of this project.
Paper and card based outputs
The contamination of paper and card based output streams is shown in Table 13 and represented graphically in Figure 12.
This suggests that twin-stream Type 2 MRFs produced a higher quality card output than single-stream Type 1 MRFs, but this may be more due to how the data was collected i.e. full sort or training MRF. These figures should be interpreted with some caution as the approach to collecting card varied greatly between MRFs, although typically oversize material was removed at the pre sort stage. Lower levels of contamination in the twin-stream MRF would be expected as the risk of contamination from non-fibre materials is less as a result of the card being collected and then processed with the paper input and not the container input.
For mixed paper no real comparison can be drawn between the types of MRF as there was only one twin-stream Type 2 MRF in the study with a mixed paper output for which only a small number of samples were taken. However this one twin-stream Type 2 MRF did show a significantly higher quality of mixed paper.
News and PAMs average contamination rates are very similar across the two MRF types. There is though greater consistency on the twin-stream Type 2 MRFs shown by a slightly narrower middle percentile bounds
(performance range) and even narrow max and min range (shown graphically on Figure 12). This could be due to the separation in the two-streams at the householder although the best (lowest) reported level of
contamination was from a single-stream Type 1 MRF.
Although similar levels of minimum contamination can be achieved from mixed paper as News and PAM, on average the mixed paper is more contaminated than the News and PAM. Whilst the News and PAM output has a higher market value the differential was not significant during the time of the survey. More likely the difference in contamination between the two outputs is thought to be caused by the different approaches within a MRF to recovering these materials. News and PAM is often positively picked from the process i.e. removing the targeted material off the conveyor, whereas mixed paper is often negatively picked from the process i.e. leaving the targeted material on the conveyor and removing the contaminating materials. Therefore, there is a greater risk of contamination in the mixed paper output. A point of interest is that due to the market price differential between paper grades during the time of the survey, in some cases News and PAM and mixed paper were not being
MRF Quality Assessment Study
22
collected separately and all paper material consigned as mixed paper and would therefore contain a higher proportion of newspaper and magazines.
Table 13 Percentage contamination in paper and card based output material across 18 MRFs
Material MRF Type Max
% 75
th
Perc Mean % 25 th
Perc Min % Card Full Data 57.38 12.00 11.97 4.82 1.90
Type 1 MRFs 57.38 9.07 13.01 4.97 3.77 Type 2 MRFs 12.92 12.31 8.84 6.80 1.90 Mixed Paper Full Data 36.70 25.34 15.80 3.20 2.10
Type 1 MRFs 36.70 25.52 17.45 9.83 2.10 Type 2 MRFs 2.58 2.58 2.58 2.58 2.58 News and PAMs Full Data 21.97 15.05 9.79 4.62 1.86 Type 1 MRFs 21.97 14.71 9.49 4.72 1.86 Type 2 MRFs 16.07 13.87 10.68 7.98 4.30 Figure 12 Percentage contamination of paper and card based materials stream
Paper and Card Output % Contamination
0
10
20
30
40
50
60
All
Type
1
Type
2
All
Type
1
Type
2
All
Type
1
Type
2
Card
MxPa
NP
Max
Cont
75th
Perc
Mean
25th
Perc
Min
Cont
Any MRF with a contamination rate between the two lines on Figure 12 would be in the central 50% of MRFs within the analysis of this project.
Dense plastic based outputs
The contamination of dense plastic based output streams is shown in Table 14 and represented graphically in Figure 13.
For coloured HDPE the analysis comparing the two MRF types is limited as there were only two single-stream Type 1 and one twin-stream Type 2 MRFs in the data. The main statistical analysis did indicate that the differences reported between the two MRF types, across individual samples, was not statistically relevant. Overall natural HDPE shows the lowest mean contamination of all the plastic materials. For natural HDPE the difference between the average contamination for single-stream Type 1 MRF and the twin-stream Type 2 MRF was shown to be statistically significant: the Type 2 MRFs generating much lower levels of contamination. As
MRF Quality Assessment Study
23
Figure 13 clearly shows, twin-stream Type 2 MRF also have a narrow range of performance. The high value of natural HDPE in the market seems to force investment in good separation practice, positively picking these materials.
For mixed plastic the single-stream MRF seems to produce a higher average quality of output that was found to be statistically significant: however there is a much wider performance range. The twin-stream Type 2 MRFs whilst with a higher level of average contamination were much more consistent in the level of contamination achieved, shown by a narrower performance range.
For mixed plastic bottles there is very little difference in the average contamination. Although for the individual sample analysis this was shown to be statistically significant: but this was thought to be driven by one MRF having unusually low contamination levels. On comparison of contamination quartile range in Figure 13 shows single-stream Type 1 MRFs have a similar spread of extremes but a narrow middle band.
The level of contamination in Clear PET in the twin-stream Type 2 MRFs is lower than single-stream Type 1 MRFs in both the average level of contamination and the upper and lower quartile range. This difference was shown to be statistically significant.
Coloured PET was not processed as an output material at any of the twin-stream Type 2 MRFs in the study. The contamination at single-stream Type 1 MRFs for coloured PET and all the non-mixed output streams does seem to be similar as illustrated in Figure 13.
As noted in the composition section of this report, the quality of the different plastic outputs varies which appears to be driven by the market value i.e. higher for clear PET and natural HDPE, and then the associated process to recover the plastic outputs within the MRF.
Table 14 Percentage contamination in dense plastic based output material across 18 MRFs
Material MRF Type Max
% 75
th
Perc Mean % 25 th
Perc Min % Coloured HDPE Full Data 12.33 11.34 8.66 6.88 3.32
Type 1 MRFs 10.44 8.66 6.88 5.10 3.32 Type 2 MRFs 12.23 12.23 12.23 12.23 12.23 Natural HDPE Full Data 14.59 3.98 4.55 1.85 0.75
Type 1 MRFs 14.59 9.29 7.50 3.96 3.93 Type 2 MRFs 2.34 2.02 1.59 1.22 0.75 Mixed Plastic Full Data 43.55 26.59 18.21 6.88 0.56
Type 1 MRFs 43.55 21.24 15.05 4.85 0.56 Type 2 MRFs 29.92 28.81 27.70 26.59 25.48 Mixed Plastic Bottles Full Data 23.04 16.16 12.21 8.34 0.47 Type 1 MRFs 23.04 14.30 12.40 10.03 3.26 Type 2 MRFs 21.72 17.61 11.89 6.98 0.47 Clear PET Full Data 20.14 9.52 7.47 2.56 0.53
Type 1 MRFs 20.14 16.60 13.06 9.52 5.98 Type 2 MRFs 3.24 2.56 1.89 1.21 0.53 Coloured PET Full Data 13.24 10.68 8.13 5.57 3.01 Type 1 MRFs 13.24 10.68 8.13 5.57 3.01 Type 2 MRFs No MRF data
MRF Quality Assessment Study
24
Figure 13 Percentage contamination of dense plastic based materials stream
Dense Plastic Output % Contamination
0
5
10
15
20
25
30
35
40
45
All
Ty
p
e
1
Ty
p
e
2
All
Ty
p
e
1
Ty
p
e
2
All
Ty
p
e
1
Ty
p
e
2
All
Ty
p
e
1
Ty
p
e
2
All
Ty
p
e
1
Ty
p
e
2
All
Ty
p
e
1
Ty
p
e
2
HDPEcol
HDPEnat
MxPl
MxPlbott
PETclr
PETcol
Max
Cont
75th
Perc
Mean
25th
Perc
Min
Cont
Any MRF with a contamination rate between the two lines on Figure 13 would be in the central 50% of MRFs within the analysis of this project.
6.0
Updated sampling regimes
One of the key practical conclusions from this project is that the level of sampling originally specified was very intensive for the training MRFs. Often the level of resource required to hand sort the specified weight and number of samples in the original protocol was beyond the level of resource available. Of particular interest was the implication of trying to achieve the minimum sample weight for input material at twin-stream Type 2 MRFs that did not contain paper. This increased further the resource demands on the MRF operators to hand sort this material in terms of sorting time, space, manpower and equipment due to the additional volume of material that was required.
This project used the WRAP MRF sampling protocol document3 for the sample sizes. These are provided in Table
15 below. A revised data set of minimum sample sizes and minimum sample weights has been produced to reflect the data collected during the MRF11 study and the practicalities of sampling and ensuring that ongoing sampling where possible is less resource intensive. The revised sample sizes are provided in Table 16.
MRF Quality Assessment Study
25
Table 15 WRAP MRF protocol minimum sample number and weights Material Stream Number of
Samples Minimum Sample Weight (kg)
Input Material 40 95
Output Material
News and PAMs 40 70
Mixed Paper 40 70
Aluminium Cans 30 25
Steel Cans 30 40
Clear PET Bottles 30 25
Mixed Plastic 50 30
Natural HDPE Containers 30 25
Residual Material 10 30
The figures in Table 16 are intended as a ‘starting point’ for MRF operators and any future similar study to assist the sample plan design. However, one of the main conclusions from this project is that there is a significant variability in the quality of the same outputs between MRFs due to local operational and economic factors. Therefore, ongoing sample sizes at a MRF should be based only on the composition and associated variability of samples collected at the MRF and not on a generic table that accommodates the variability across various MRF designs achieving varying levels of performance. The sample size required for each output will be a direct function on the consistency of a specific material at a MRF. In some MRFs the sample size will be high and in others it will be low. Clearly this will affect the resource commitment required by the MRF. It is also important to stress that the required sample size is based on variability and not the level of quality achieved. For example, if samples within a MRF consistently have a high level of contamination then a smaller sample size could be required in comparison to a MRF where on average the level of contamination is a lot lower but the variability around this average is greater.
Within this project, there was no requirement to measure the weight and number of particles within each sample. Therefore, it is not possible to derive a revised minimum sample weight. Instead, a minimum sample weight has been based on the average weight of samples taken for each stream. This is because the measured variability and confidence levels will be influenced by the weight of material sampled.
Based on this weight, a view has been taken on the appropriate number of samples required to achieve an acceptable level of precision at a 95% confidence level. This means that if the number and weight of samples specified were sorted again you would be 95% confident that the values would be with the specified percentage of the mean. Clearly it is important to try and achieve as narrow a band of precision (i.e. be as accurate) as possible.
The narrowest band of precision (and the associated number of samples required to achieve this) has been selected considering:
the length of time to sort the samples and hence resource requirements on the MRF operators. For example a required sample size of 491 samples to achieve 10% level of precision for aluminium is not practical; and
the actual mean contamination value reported across the 18 MRFs sampled. For example whilst a figure of +/- 50% around the mean for aluminium appears high, the mean in some MRFs is as low as 0.1%. Therefore the 95% confidence range will be between 0.05% and 0.15%.
MRF Quality Assessment Study
26
Table 16 WRAP MRF protocol minimum sample number and weights * Material Stream Number of
Samples Minimum Sample Weight (kg) Estimated +/- % around the mean with 95% Confidence
Input Material (Single-stream) 20 100 +/- 20%
Input Material (Twin-stream
with paper) 30 100 +/- 20%
Input Material (Twin-stream
without paper) 25 100 +/- 20% Output Material Aluminium 20 30 +/- 50% Card 40 70 +/- 20% Mixed Paper 25 80 +/- 25% Mixed Plastic 25 35 +/- 20%
Mixed Plastic Bottles 25 35 +/- 20%
HDPE Coloured Plastic Bottles 35 30 +/- 30% HDPE Natural Plastic Bottles 30 30 +/- 30%
News and PAM 35 85 +/- 20%
PET Clear 25 30 +/- 25%
PET Coloured 20 30 +/- 50%
Steel 20 45 +/- 25%
Residual Material 10 35 +/- 25%
[*The sample numbers have been rounded up or down to the nearest 5]
7.0
Conclusions
During this project around 270 tonnes of material was hand sorted from 18 MRF across the UK. There is a significant quantity of data contained within this report where a number of different conclusions can be drawn. These have been discussed within the report in the relevant sections. Each of these conclusions should be considered within the context of the data limitations outlined within the report and the number of MRF sampled and approach taken. A number of statistical relationships have been identified, but these should be interpreted with caution due to the potential inter-relationship between these. In many cases there are a range of factors that appear to correlate with material quality which cannot be accounted for in the same analysis and therefore a triangulated approach is required to take an informed view of the actual factors causing this change.
MRF Quality Assessment Study
27
This section outlines the key conclusions of this project, drawn from the report, and listed below:
The average contamination of the material streams varied significantly. Table 17 All MRF average contamination rates (%)
Target Material N Min % Max % Mean % Standard Deviation
Alu 18 0.0 8.1 2.5 2.3 Card 12 1.9 57.4 12.0 14.8 Glass 1 1.5 1.5 1.5 . HDPEcol 3 3.3 12.2 8.7 4.7 HDPEnat 6 0.8 14.6 4.5 5.1 Input4 18 5.7 22.7 12.9 6.0 MxPa 9 2.1 36.7 15.8 12.1 MxPlbott 8 0.5 23.0 12.2 7.9 MxPl 8 0.6 43.5 18.2 15.1 NP 12 1.9 22.0 9.8 6.4 PETclr 4 0.5 20.1 7.5 8.7 PETcol 2 3.0 13.2 8.1 7.2 PlFlm 1 39.5 39.5 39.5 . Res5 18 9.1 100.0 54.8 31.1 Steel 18 0.4 23.8 6.2 5.6
Input contamination for Type 1 MRFs and container based input on Type 2 have a similar mean (13.1% and 13.35%), but Type 2 container has a wider range between maximum and minimum. Type 2 fibre based input has a lower mean (6.74%) and a narrow range.
Residual contamination for Type 1 MRFs and fibre based residual on Type 2 have a similar mean (48.99% and 48.94%), but Type 2 fibre has a narrower range. Type 2 container based residual has a higher mean
(72.6%). For residual contamination is good, as this means Type 2 container based lines allowed less targeted material through into the input.
Steel cans had a similar minimum contamination to aluminium cans (0.35% and 0%), but a much higher
maximum (23.78% and 8.04%).
Of the paper based outputs, News and PAMs has the lowest mean contamination (9.79%) then card (11.97%) and then mixed paper (15.8%). One card MRF had a particularly high contamination rate.
For plastic based outputs the mixed plastic (18.21%) and mixed bottles (12.21%) showed the highest level of
contamination. The lowest was natural HDPE (4.55%). Coloured HDPE (8.66%), Clear PET (7.47%) and coloured PET (8.13%) had similar mean contaminations. The highest range of contamination was not surprisingly on mixed plastics.
The following conclusions are pulled from the technical data report, and so the figures are based on the analysis of the 4,676 individual samples unless otherwise stated.
Input contamination across all MRFs sampled varied significantly between 6% and 23%.
Newspaper and Magazines is the dominant material in nearly all MRFs sampled. Whilst all MRFs sampled accepted aluminium, steel, PET and HDPE bottles, acceptance of other materials varied. Some materials were tolerated at the MRF for a variety of reasons specific to local circumstances on the assumption that the material would be removed and be contained in the residual material. Conversely, some materials not targeted in the inputs, but were ‘targeted’ into output materials i.e. some materials were present in sufficient