The INL is a U.S. Department of Energy National Laboratory operated by Battelle Energy Alliance
INL/EXT-08-14324
Primer Control System
Cyber Security
Framework and
Technical Metrics
Wayne F. Boyer
Miles A. McQueen
May 2008
INL/EXT-08-14324
Primer Control System Cyber Security Framework and
Technical Metrics
Wayne F. Boyer Miles A. McQueen
May 2008
US-CERT Control Systems Security Center
Idaho Falls, Idaho 83415
Prepared for the
3ULPHU ([HFXWLYH6XPPDU\
EXECUTIVE SUMMARY
The Department of Homeland Security National Cyber Security Division supported development of a control system cyber security framework and a set of technical metrics to aid owner-operators in tracking control systems security. The framework defines seven relevant cyber security dimensions and provides the foundation for thinking about control system security. Based on the developed security framework, a set of ten technical metrics are recommended that allow control systems owner-operators to track improvements or degradations in their individual control systems security posture.
This primer has been developed to assist you (owners and operators) in securing your control systems by applying the control system cyber security framework and implementing the ten technical security metrics.
([HFXWLYH6XPPDU\ 3ULPHU
3ULPHU &RQWHQWV
CONTENTS
EXECUTIVE SUMMARY ...iii
1. INTRODUCTION ... 1
2. CONTROL SYSTEM CYBER SECURITY FRAMEWORK... 2
2.1 Security Group Knowledge... 3
2.2 Attack Group Knowledge ... 3
2.3 Access ... 3
2.4 Vulnerabilities... 3
2.5 Damage Potential ... 4
2.6 Detection ... 4
2.7 Recovery ... 4
2.8 Security Dimensions Drive Security and Security Metrics... 4
3. RECOMMENDED METRICS ... 6
3.1 Rogue Change Days... 6
3.2 Security Evaluation Deficiency Count... 6
3.3 Data Transmission Exposure... 6
3.4 Reachability Count... 7
3.5 Attack Path Depth ... 7
3.6 Known Vulnerability Days ... 7
3.7 Password Crack Time ... 7
3.8 Worst Case Loss... 8
3.9 Detection Mechanism Deficiency Count ... 8
3.10 Restoration Time... 8
3.11 Specifications of Recommended Metrics... 8
4. CASE STUDIES ... 19
4.1 Case Study 1... 19
4.2 Case Study 2... 20
5. SURVEY OF PREVIOUSLY PROPOSED TECHNICAL METRICS ... 22
6. SUMMARY ... 23
7. REFERENCES ... 24
FIGURES
Figure 1. Simplified diagram of Case study 1 (DCS). ... 19&RQWHQWV 3ULPHU
TABLES
Table 1. Seven Control System Cyber Security Dimensions... 2
Table 2. Security dimension checklist and potential metrics... 5
Table 3. Rogue Change Days metric specification. ... 9
Table 4. Security Evaluation Deficiency Count metric specification. ... 10
Table 5. Data Transmission Exposure metric specification... 11
Table 6. Reachability Count metric specification. ... 12
Table 7. Attack Path Depth metric specification. ... 13
Table 8. Known Vulnerability Days metric specification... 14
Table 9. Password Crack Time metric specification... 15
Table 10. Worst Case Loss metric specification... 16
Table 11. Detection Mechanism Deficiency Count metric specification... 17
Table 12. Restoration Time metric specification. ... 18
Table 13. Case Study 1 metric values. ... 20
3ULPHU ,QWURGXFWLRQ
1. INTRODUCTION
Electronic control systems that operate much of the Nation's critical infrastructure are increasingly connected to public networks. Consequently, control systems and the associated critical infrastructure are at greater risk than before from externally initiated cyber attacks. To aid the mitigation of these increased risks, the Department of Homeland Security National Cyber Security Division funded development of (1) a control system focused cyber security framework to aid owner/operators in thinking about their control system’s security posture and (2) a related set of meaningful technical metrics.
This primer describes the resulting framework and proposed metrics to you, the owner-operator, and is to be used as an aid when applying both the framework and metrics to your control systems. Rigorous application of the framework, when thinking about a control system’s security posture, and consistent measurement and evaluation of the proposed metrics will support more effective security decisions for your systems.
The framework consists of seven security dimensions. Each of the security dimensions is related to risk. Unfortunately it is currently beyond the state-of-the-art and state-of-the-practice to quantify the relationship between any set of security dimensions and risk. However, based on case studies and review of control system security assessments, there is strong evidence that the framework’s seven security dimensions capture many of the system attributes, which correlate with a control system’s risk exposure. As a result, the seven security dimensions are the recommended foundation for thinking about the security of your system and are also the foundation for the ten recommended technical metrics. It is these ten technical security metrics that support you in assessing whether your security risk exposure is increasing or decreasing over time.
A metric is a standard of measurement.1This primer presents ten useful and practical quantitative technical metrics. A cyber security technical metric is the security relevant output from an explicit mathematical model that makes use of objective measurements of a technical object. Other types of metrics (such as operational and organizational metrics, and metrics that are qualitative such as “low impact” or “highly unlikely”) can provide insights about security but are beyond the scope of this primer.
The remainder of this primer consists of four additional sections. Section 2, “Control System Cyber Security Framework,” discusses the framework of seven control system cyber security dimensions to aid you in thinking about the security of control systems; Section 3, “Recommended Metrics,” presents and recommends one specific set of technical metrics that have been applied in case studies and demonstrated their value in improving control system security; Section 4, “Case Studies,” discusses two case studies where the recommended technical metrics were applied to operational control systems; and Section 5, “Survey of Previously Proposed Technical Metrics,” discusses a few previously proposed metrics, their strengths and weaknesses.
&RQWURO6\VWHP&\EHU6HFXULW\)UDPHZRUN 3ULPHU
2. CONTROL SYSTEM CYBER SECURITY FRAMEWORK
The control system cyber security framework consists of sevensecurity dimensions and provides the foundation for the recommended metrics found later in this primer.Each of the seven dimensions of security represents an important aspect of the control system’s security posture at a given point in time. An ideal value associated with each dimension indicates what would be needed in order to achieve security perfection along the associated dimension. The ideal values are provided to you as a target to move towards, not as a target that can be fully and completely met. The seven dimensions of security are defined in Table 1 and then discussed more fully in the rest of this section.
Table 1. Seven Control System Cyber Security Dimensions.
Security Dimension Definition
1. Security group (SG) knowledge
Aspects of the system or associated management processes that impact the security group‘s ability (the people who are directly responsible for the security of the control system) to know the system and manage changes to the system. It includes (a) aspects of the system and processes associated with configuration management, (b) tools (or lack of tools) that support the tracking of changes, and (c) the collection and analysis of system logs and forensics. 2. Attack group
(AG) knowledge
Attributes of the system, processes, or actions that provide potential attackers with means to gain information about the system. It includes (a) software defects or configuration settings that return information when the system is probed by an unauthenticated user, (b) any information about the system that can be obtained from public sources, and (c) design or implementation weaknesses that allow a user with no authenticated privilege to gain information by listening on communication paths.
3. Access Attributes of the system design, configuration, or deployment that provide a potential attacker with the ability to send or receive data to/from a component of the control system from the attacker's location. This includes (a) physical access to control system components, (b) access to control system components through external and internal networks, and (c) access from internal components that may have been compromised. Access does not address whether or not the communication channel can be used to gain any useful information nor whether sending data can provide the attacker with any desired result. 4. Vulnerabilities Defects or weaknesses in the control system that can be exploited to gain unauthorized
privilege. This excludes defects that allow information to be obtained once access is gained without also explicitly gaining privilege. If a single defect allows an attacker to gain information and also gain privilege, that defect is defined to be a vulnerability.
5. Damage potential The amount of loss that a malicious attacker has the power to cause once they have gained privilege on a control system. It does not include any weaknesses associated with the process of gaining malicious control. Although actual damage may be reduced by a quick response to an attack, this dimension does not include any effects associated with attack detection or control system recovery.
6. Detection The ability to detect attacks and provide timely notification. This includes anti-virus software, IDS, IPS and system logging, whether detection mechanisms are in place and the effectiveness of those mechanisms.
7. Recovery The ability to restore the control system from a compromised state to an uncompromised state. It includes the reliability of the backup and restore facilities and the time required to recover from an attack
Seven Dimensions of Control System Cyber Security: 1. Security group knowledge 2. Attack group knowledge
3. Access
4. Vulnerabilities 5. Damage potential 6. Detection
3ULPHU &RQWURO6\VWHP&\EHU6HFXULW\)UDPHZRUN
2.1
Security Group Knowledge
The first control system security dimension is Security Group (SG) knowledge. The security group represents those people in your organization who are directly responsible for the security of the control systems. Security risk is strongly correlated with the security group’s knowledge of your system. In the ideal situation, the security group has perfect knowledge of the system including all the hardware and software components, network topology, communication paths, normal operational behavior, and even vulnerabilities. That knowledge is needed for your security group to effectively make security decisions that protect the control system from potential attackers. Any changes that occur to the control systems without the security group’s knowledge may inadvertently introduce new vulnerabilities into the system and inhibit the introduction of reasonable mitigation measures. Perfect knowledge of the system implies a configuration management process that includes the security group in the planning of all changes and provides a mechanism for alerting the security group to any unauthorized changes.
2.2
Attack Group Knowledge
The second control system security dimension is Attack Group (AG) knowledge. The attack group represents any of the many potential adversaries in the world who might have interest in attacking your facility through cyber means. Security risk from targeted attacks is kept down when potential attackers are unable to obtain any information about your control system. Ideally, anyone who is not authorized to use the control system should be prevented from gaining knowledge of its design or configuration and be unable to obtain any information that would allow them to plan and execute an attack. This includes information an attacker might gain about the control system after they have compromised portions of it and information they might gain from other sources before the attack commences (e.g., a vendor’s web site touting your facility as a success story).
Be aware that even approved users may become members of an attack group when their actions on the system go beyond what they are authorized to perform, whether inadvertently or intentionally (the “insider threat”).
2.3
Access
The third control system security dimension is Access. Even though authentication mechanisms are designed to prevent unauthorized use of data transfer paths, the existence of every path, authenticated or not, negatively impacts security risk. The ideal situation from a security perspective is to disallow any communication channels between the control system and any location where there are potential attackers. Although achievement of this ideal is not practical in most cases, the ideal includes the absence of any electronic connections between the Internet and the control system.
2.4
Vulnerabilities
The fourth control system security dimension is Vulnerabilities. A vulnerability is any weakness or defect in the system that provides a potential attacker with a means to gain privilege intended for authorized users only. An exploit of a vulnerability leads to a compromise. An ideal system has no weaknesses and no defects. Unfortunately, all systems have weaknesses and if an attack group is targeting your facility they will be actively searching vulnerability disclosure sites and using techniques such as reverse engineering to find those weaknesses.
&RQWURO6\VWHP&\EHU6HFXULW\)UDPHZRUN 3ULPHU
2.5
Damage Potential
The fifth control system security dimension is Damage Potential. The ideal control system cannot cause damage even if the electronic networks are completely compromised by an attacker. Since risk is the expected value of loss, the damage potential is directly proportional to risk. The amount of damage that can be caused by a compromised control system is determined by the type of process that it controls and by the nature of engineered safety systems (e.g., physical safety mechanisms may be in place that prevents significant damage despite a successful attack on the electronic control system).
2.6
Detection
The sixth control system security dimension is Detection. An ideal control system includes detection mechanisms that alert the Security Group whenever there is an unauthorized event on the control system. Unauthorized events come in a wide variety of forms and would include activities such as an
unauthorized user attempting to gain access to your control system or a counterfeit message from a front end processor to a remote terminal unit (RTU).
2.7
Recovery
The seventh control system security dimension is Recovery. An ideal control system can be restored to an uncompromised state immediately after an attack is detected. Recovery time is related to Damage Potential because the cost of a successful attack correlates with the length of time that the control system is in a compromised state. Damage will tend to be less severe if the time to recover is minimized.
However, the relationship between Recovery Time and Damage Potential is highly non-linear and highly system dependent.
2.8
Security Dimensions Drive Security and Security Metrics
Although perfection may not be feasible for any of these seven dimensions of control system cyber security, the measurement of how nearly the system approaches the ideal in each dimension is a useful way to think about the security risk to your system. Table 2 is a check list that can help you begin to consider each dimension, and ensure you are measuring and tracking some system attribute related to each cyber security dimension.To support your efforts in establishing measures for each security dimension, ten technical security metrics have been defined with at least one of the metrics covering each security dimension. The ten metrics and their application are discussed in the next section.
3ULPHU &RQWURO6\VWHP&\EHU6HFXULW\)UDPHZRUN
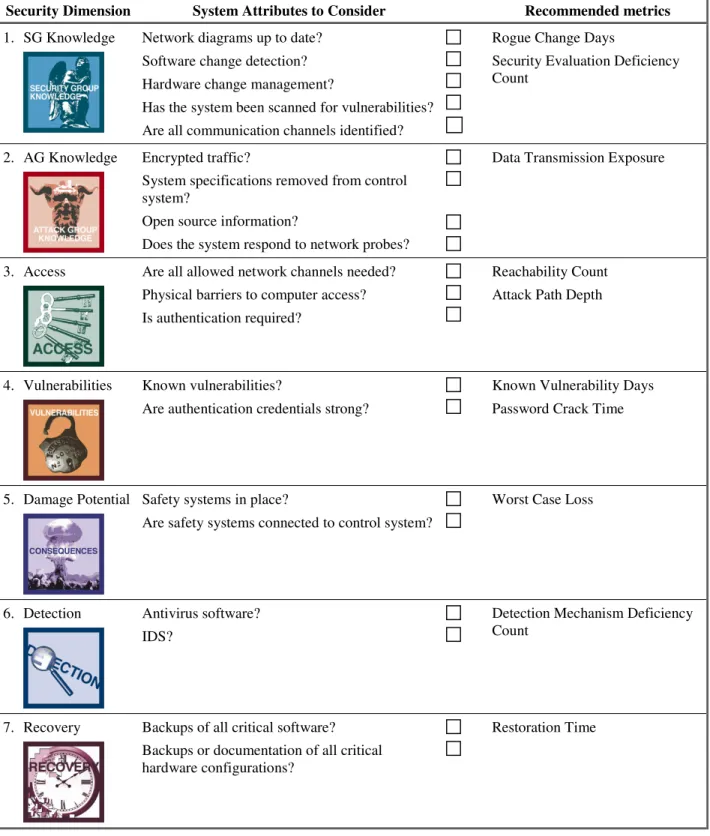
Table 2. Security dimension checklist and potential metrics.
Security Dimension System Attributes to Consider Recommended metrics
1. SG Knowledge Network diagrams up to date? Software change detection? Hardware change management?
Has the system been scanned for vulnerabilities? Are all communication channels identified?
Rogue Change Days
Security Evaluation Deficiency Count
2. AG Knowledge Encrypted traffic?
System specifications removed from control system?
Open source information?
Does the system respond to network probes?
Data Transmission Exposure
3. Access Are all allowed network channels needed? Physical barriers to computer access? Is authentication required?
Reachability Count Attack Path Depth
4. Vulnerabilities Known vulnerabilities?
Are authentication credentials strong?
Known Vulnerability Days Password Crack Time
5. Damage Potential Safety systems in place?
Are safety systems connected to control system?
Worst Case Loss
6. Detection Antivirus software? IDS?
Detection Mechanism Deficiency Count
7. Recovery Backups of all critical software? Backups or documentation of all critical hardware configurations?
5HFRPPHQGHG0HWULFV 3ULPHU
3. RECOMMENDED METRICS
Ten recommended technical metrics are listed inTable 2. Each metric is associated with one security dimension and there is at least one metric associated with each of the seven cyber security dimensions. Each defined metric is an answer to the question: “What can be objectively measured on the system that is a
reasonable representation of how nearly the system approaches the ideal of its associated security dimension?” As this is a framework,the metrics you choose may be different but there should be at least one metric for each of the seven security dimensions. These ten recommended metrics have been successfully applied to two case studies described below and will be described in sufficient detail to provide you with a starting point for your own metrics plan. It is most important that you use these examples to consider how the metrics framework can be applied to your system in a consistent manner over time to track progress.
3.1
Rogue Change Days
Rogue Change Days are the number of rogue changes multiplied by number of days the changes were unknown to the Security Group. A rogue change is any change to the system configuration without prior notification to the Security Group. For example, if two modems were added to the control system without the knowledge of the security group and this change was not discovered by the security group until 10 days later, this would add 2 * 10Æ20 rogue change days to the metric calculation. This is the first recommended metric for the security group knowledge security dimension. Its ideal value is zero.
3.2
Security Evaluation Deficiency Count
The Security Evaluation Deficiency Count is the number of control system network devices that have not undergone a security evaluation. This metric emphasizes the need to measure and track system knowledge about the security attributes of the control system. For example, if two RTUs that have not undergone security evaluations and one programmable logic controller (PLC) that has undergone security evaluation have been added to the control system, this would add a count of 3 – 1Æ2 to this metric calculation. This is the second recommended metric for the security group knowledge security dimension. Its ideal value is zero.
3.3
Data Transmission Exposure
Data Transmission Exposure is the unencrypted data transmission volume. A key assertion is that any data that can be monitored by a potential attacker increases the security risk. Some data are clearly more sensitive than others; however, to make the metric easier to obtain, it is simply a count of the number of clear text channels used by the control system. For example, if Telnet is used to connect to the
engineering workstation of the control system from the Internet and if it is the only channel used for
Recommended Technical Metrics:
1. Rogue Change Days
2. Security Evaluation Deficiency Count
3. Data Transmission Exposure
4. Reachability Count 5. Attack Path Depth 6. Known Vulnerability Days
7. Password Crack Time
8. Worst Case Loss
9. Detection Mechanism Deficiency Count
3ULPHU 5HFRPPHQGHG0HWULFV
external access, then the value of the metric is 1. Telnet channels are included in this metric because Telnet uses a clear text protocol that attackers can tap into to obtain passwords and other sensitive data. This is the recommended metric for the attack group knowledge security dimension. Its ideal value is zero.
3.4
Reachability Count
The Reachability Count is the number of access points in relation to a specific point of origin such as the Internet. A key assertion is that a reduction in the number of access points tends to reduce the cyber security risk. This metric is a count of the incoming and outgoing network communication channels plus the number of physical access data channels. For example, the reachability count (from the Internet) for a control system protected by a firewall is calculated as follows. Suppose the control system consists of ten machines with two open TCP/IP ports each, and suppose the firewall prevents access to one of the two ports on each machine but has no outgoing restrictions. The metric value is 10 incoming channels (one for each machine) plus 10 outgoing channels (one for each machine), 10 + 10Æ20. This is the first
recommended metric for the access security dimension. Its ideal value is zero.
3.5
Attack Path Depth
The Attack Path Depth is the minimum number of independent, single-machine compromises required for a successful attack from an external network. This metric emphasizes the importance of having multiple layers of defense. You should avoid a protection configuration that can be defeated by a single exploit or compromise. A control system that has direct access through an external modem, for example, has a metric value of 1 because a successful attack requires only the compromise of a single device, even though it is connected to the Internet through a corporate IT network and through multiple firewalls. This is the second recommended metric for the access security dimension. Its ideal value is infinity.
3.6
Known Vulnerability Days
The Known Vulnerability Days metric is the sum of known and unpatched vulnerabilities, each multiplied by their exposure time interval. A key assertion is that the longer a vulnerability is known the greater the risk that it will be exploited. For example, if three vulnerabilities were publicly announced 2 weeks ago but still haven’t been fixed on your system, it would add 3 * 14Æ42 known vulnerability days to this metric. This is the first recommended metric for the vulnerabilities security dimension. Its ideal value is zero.
3.7
Password Crack Time
The Password Crack Time is the shortest time (in days) needed to crack a single password for any account on the system. This metric is a measure of the minimum amount of time an attacker would need to compromise the system by password cracking. For example, suppose the encrypted password files have been copied from all of the computers in the control room and the first of these passwords was cracked in 18 days and the second password was cracked in 30 days using John the Ripper. If no other passwords were cracked in fewer days the metric calculation would yield a value of minimum(18, 30)Æ18 days.
5HFRPPHQGHG0HWULFV 3ULPHU
This is the second recommended metric for the vulnerabilities security dimension. Its ideal value is infinity.
3.8
Worst Case Loss
Worst Case Loss is the maximum dollar value of the damage/loss that could be inflicted by malicious personnel via a compromised control system. A key assertion is that system risk is strongly related to worst case loss. Although there can be successful attacks where the actual loss is much less than the worst case, a reduction in the worst case loss reduces the potential for loss and, therefore, reduces risk. For an example calculation of this metric consider a chemical plant in which a major explosion can be triggered by signals from the control system. The value of the metric is the estimated cost of the explosion in dollars including repairs, replacements and plant downtime. This is the recommended metric for the damage-potential security dimension. Its ideal value is zero.
3.9
Detection Mechanism Deficiency Count
The Detection Mechanism Deficiency Count is the number of externally accessible devices that do not have malware detection or attack detection mechanisms. A key assertion is that detection mechanisms reduce risk, especially when applied to devices that can be used as entry points for attacks. For an
example calculation of this metric, suppose the control room has fifteen computers each with one or more currently enabled USB ports, and assume that twelve of the computers have antivirus installed but three do not. This would add 15 – 12Æ3 to this metric calculation, the recommended metric for the detection security dimension. Its ideal value is zero.
3.10 Restoration Time
The Restoration Time is the worst case elapsed time to restore the system to a known uncorrupted version. The metric can be determined by running a test to measure the actual time elapsed from a worst-case compromise to a fully restored and 100% operational system. If a test is not feasible and there have been no security events on your control system where the restoration time was tracked, you may have to resort to a pencil and paper exercise. For example, your exercise might assume a situation where all twenty computers in the control room have been compromised by a virus. Fortunately, the virus seems to be relatively benign so you are able to address one computer at a time. Perhaps, you decide to, one by one, take a computer off the network, operate in a degraded mode, clean the virus from that machine, and then reintroduce the computer to the network and get the applications in an up-to-date status. If this activity for a single machine takes 1-1/2 hours, it would yield a metric value of 20 * 90Æ1,800 minutes, the recommended metric for the recovery security dimension. Its ideal value is zero.
3.11 Specifications of Recommended Metrics
Detailed metric specifications for each of the ten recommended core metrics are listed in Tables 3 through 12.
3ULPHU 5HFRPPHQGHG0HWULFV
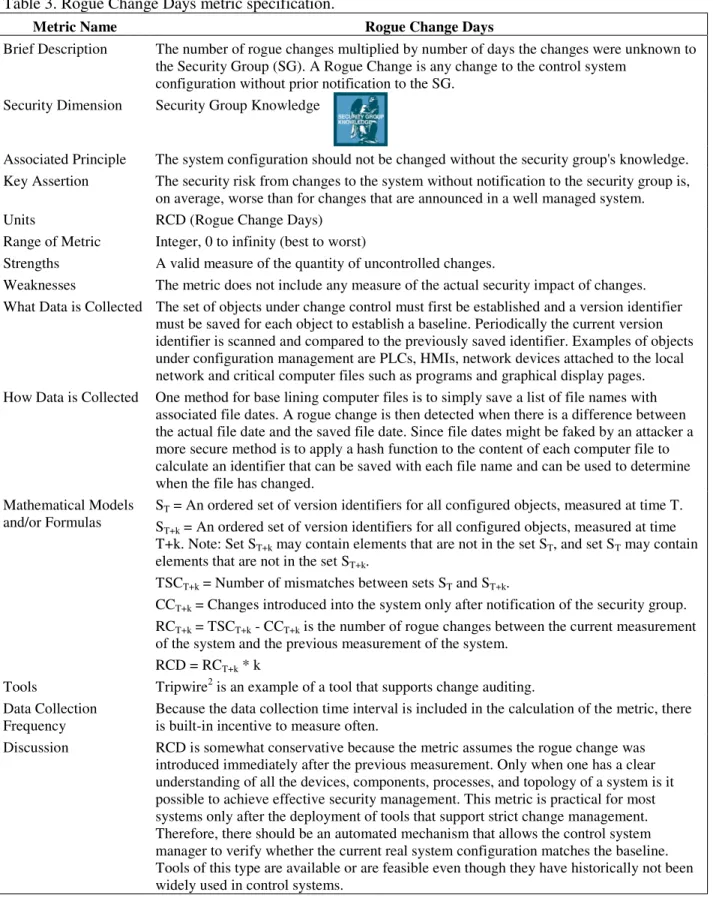
Table 3. Rogue Change Days metric specification.
Metric Name Rogue Change Days
Brief Description The number of rogue changes multiplied by number of days the changes were unknown to the Security Group (SG). A Rogue Change is any change to the control system
configuration without prior notification to the SG. Security Dimension Security Group Knowledge
Associated Principle The system configuration should not be changed without the security group's knowledge. Key Assertion The security risk from changes to the system without notification to the security group is,
on average, worse than for changes that are announced in a well managed system.
Units RCD (Rogue Change Days)
Range of Metric Integer, 0 to infinity (best to worst)
Strengths A valid measure of the quantity of uncontrolled changes.
Weaknesses The metric does not include any measure of the actual security impact of changes. What Data is Collected The set of objects under change control must first be established and a version identifier
must be saved for each object to establish a baseline. Periodically the current version identifier is scanned and compared to the previously saved identifier. Examples of objects under configuration management are PLCs, HMIs, network devices attached to the local network and critical computer files such as programs and graphical display pages. How Data is Collected One method for base lining computer files is to simply save a list of file names with
associated file dates. A rogue change is then detected when there is a difference between the actual file date and the saved file date. Since file dates might be faked by an attacker a more secure method is to apply a hash function to the content of each computer file to calculate an identifier that can be saved with each file name and can be used to determine when the file has changed.
Mathematical Models and/or Formulas
ST= An ordered set of version identifiers for all configured objects, measured at time T.
ST+k= An ordered set of version identifiers for all configured objects, measured at time
T+k. Note: Set ST+kmay contain elements that are not in the set ST, and set STmay contain
elements that are not in the set ST+k.
TSCT+k= Number of mismatches between sets STand ST+k.
CCT+k= Changes introduced into the system only after notification of the security group.
RCT+k= TSCT+k- CCT+kis the number of rogue changes between the current measurement
of the system and the previous measurement of the system. RCD = RCT+k* k
Tools Tripwire2is an example of a tool that supports change auditing. Data Collection
Frequency
Because the data collection time interval is included in the calculation of the metric, there is built-in incentive to measure often.
Discussion RCD is somewhat conservative because the metric assumes the rogue change was introduced immediately after the previous measurement. Only when one has a clear understanding of all the devices, components, processes, and topology of a system is it possible to achieve effective security management. This metric is practical for most systems only after the deployment of tools that support strict change management. Therefore, there should be an automated mechanism that allows the control system manager to verify whether the current real system configuration matches the baseline. Tools of this type are available or are feasible even though they have historically not been widely used in control systems.
5HFRPPHQGHG0HWULFV 3ULPHU
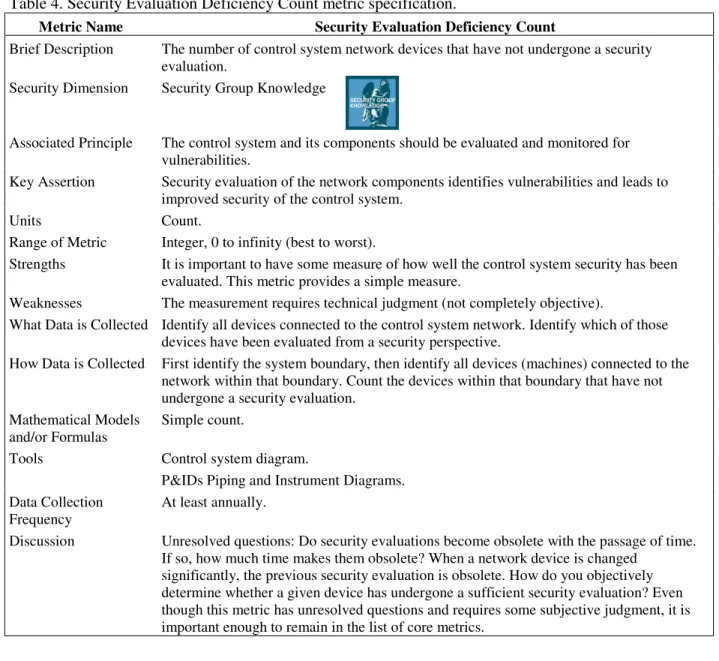
Table 4. Security Evaluation Deficiency Count metric specification.
Metric Name Security Evaluation Deficiency Count
Brief Description The number of control system network devices that have not undergone a security evaluation.
Security Dimension Security Group Knowledge
Associated Principle The control system and its components should be evaluated and monitored for vulnerabilities.
Key Assertion Security evaluation of the network components identifies vulnerabilities and leads to improved security of the control system.
Units Count.
Range of Metric Integer, 0 to infinity (best to worst).
Strengths It is important to have some measure of how well the control system security has been evaluated. This metric provides a simple measure.
Weaknesses The measurement requires technical judgment (not completely objective).
What Data is Collected Identify all devices connected to the control system network. Identify which of those devices have been evaluated from a security perspective.
How Data is Collected First identify the system boundary, then identify all devices (machines) connected to the network within that boundary. Count the devices within that boundary that have not undergone a security evaluation.
Mathematical Models and/or Formulas
Simple count.
Tools Control system diagram.
P&IDs Piping and Instrument Diagrams. Data Collection
Frequency
At least annually.
Discussion Unresolved questions: Do security evaluations become obsolete with the passage of time. If so, how much time makes them obsolete? When a network device is changed
significantly, the previous security evaluation is obsolete. How do you objectively determine whether a given device has undergone a sufficient security evaluation? Even though this metric has unresolved questions and requires some subjective judgment, it is important enough to remain in the list of core metrics.
3ULPHU 5HFRPPHQGHG0HWULFV
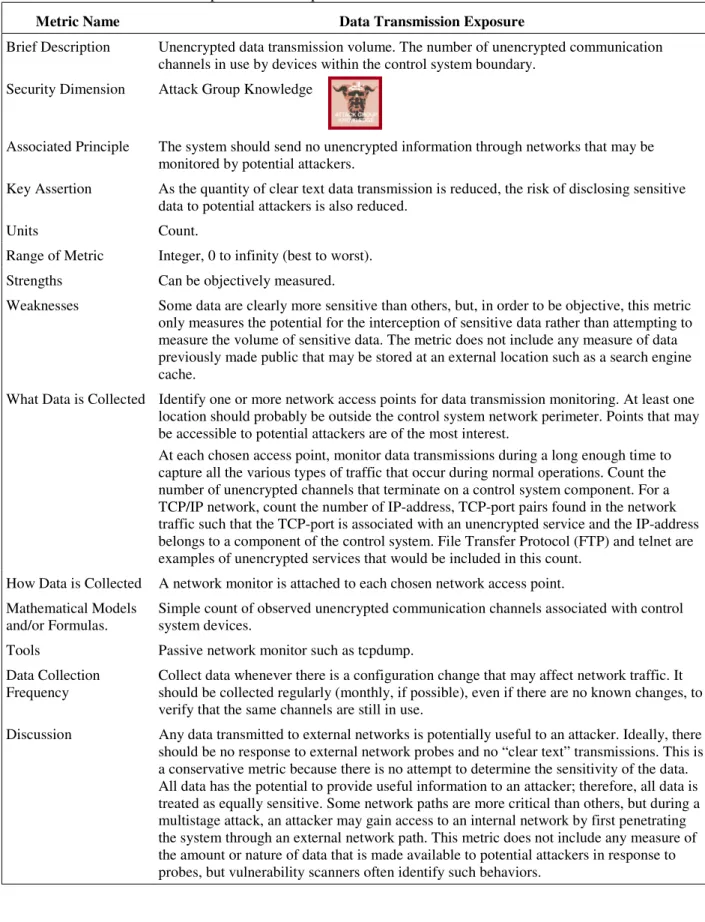
Table 5. Data Transmission Exposure metric specification.
Metric Name Data Transmission Exposure
Brief Description Unencrypted data transmission volume. The number of unencrypted communication channels in use by devices within the control system boundary.
Security Dimension Attack Group Knowledge
Associated Principle The system should send no unencrypted information through networks that may be monitored by potential attackers.
Key Assertion As the quantity of clear text data transmission is reduced, the risk of disclosing sensitive data to potential attackers is also reduced.
Units Count.
Range of Metric Integer, 0 to infinity (best to worst).
Strengths Can be objectively measured.
Weaknesses Some data are clearly more sensitive than others, but, in order to be objective, this metric only measures the potential for the interception of sensitive data rather than attempting to measure the volume of sensitive data. The metric does not include any measure of data previously made public that may be stored at an external location such as a search engine cache.
What Data is Collected Identify one or more network access points for data transmission monitoring. At least one location should probably be outside the control system network perimeter. Points that may be accessible to potential attackers are of the most interest.
At each chosen access point, monitor data transmissions during a long enough time to capture all the various types of traffic that occur during normal operations. Count the number of unencrypted channels that terminate on a control system component. For a TCP/IP network, count the number of IP-address, TCP-port pairs found in the network traffic such that the TCP-port is associated with an unencrypted service and the IP-address belongs to a component of the control system. File Transfer Protocol (FTP) and telnet are examples of unencrypted services that would be included in this count.
How Data is Collected A network monitor is attached to each chosen network access point. Mathematical Models
and/or Formulas.
Simple count of observed unencrypted communication channels associated with control system devices.
Tools Passive network monitor such as tcpdump.
Data Collection Frequency
Collect data whenever there is a configuration change that may affect network traffic. It should be collected regularly (monthly, if possible), even if there are no known changes, to verify that the same channels are still in use.
Discussion Any data transmitted to external networks is potentially useful to an attacker. Ideally, there should be no response to external network probes and no “clear text” transmissions. This is a conservative metric because there is no attempt to determine the sensitivity of the data. All data has the potential to provide useful information to an attacker; therefore, all data is treated as equally sensitive. Some network paths are more critical than others, but during a multistage attack, an attacker may gain access to an internal network by first penetrating the system through an external network path. This metric does not include any measure of the amount or nature of data that is made available to potential attackers in response to probes, but vulnerability scanners often identify such behaviors.
5HFRPPHQGHG0HWULFV 3ULPHU
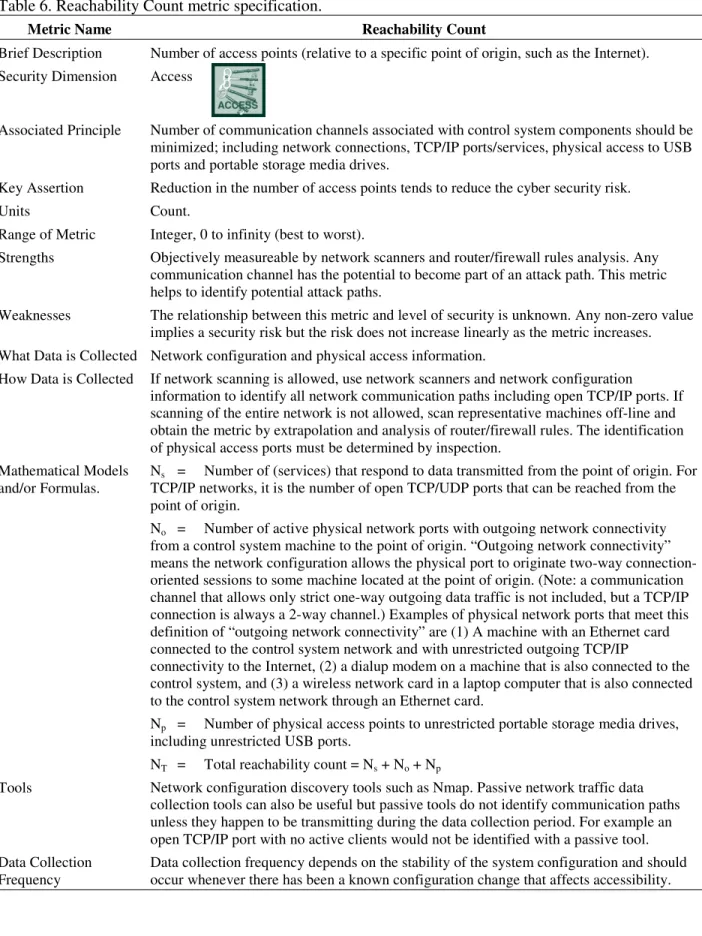
Table 6. Reachability Count metric specification.
Metric Name Reachability Count
Brief Description Number of access points (relative to a specific point of origin, such as the Internet). Security Dimension Access
Associated Principle Number of communication channels associated with control system components should be minimized; including network connections, TCP/IP ports/services, physical access to USB ports and portable storage media drives.
Key Assertion Reduction in the number of access points tends to reduce the cyber security risk.
Units Count.
Range of Metric Integer, 0 to infinity (best to worst).
Strengths Objectively measureable by network scanners and router/firewall rules analysis. Any communication channel has the potential to become part of an attack path. This metric helps to identify potential attack paths.
Weaknesses The relationship between this metric and level of security is unknown. Any non-zero value implies a security risk but the risk does not increase linearly as the metric increases. What Data is Collected Network configuration and physical access information.
How Data is Collected If network scanning is allowed, use network scanners and network configuration
information to identify all network communication paths including open TCP/IP ports. If scanning of the entire network is not allowed, scan representative machines off-line and obtain the metric by extrapolation and analysis of router/firewall rules. The identification of physical access ports must be determined by inspection.
Mathematical Models and/or Formulas.
Ns = Number of (services) that respond to data transmitted from the point of origin. For
TCP/IP networks, it is the number of open TCP/UDP ports that can be reached from the point of origin.
No = Number of active physical network ports with outgoing network connectivity
from a control system machine to the point of origin. “Outgoing network connectivity” means the network configuration allows the physical port to originate two-way connection-oriented sessions to some machine located at the point of origin. (Note: a communication channel that allows only strict one-way outgoing data traffic is not included, but a TCP/IP connection is always a 2-way channel.) Examples of physical network ports that meet this definition of “outgoing network connectivity” are (1) A machine with an Ethernet card connected to the control system network and with unrestricted outgoing TCP/IP
connectivity to the Internet, (2) a dialup modem on a machine that is also connected to the control system, and (3) a wireless network card in a laptop computer that is also connected to the control system network through an Ethernet card.
Np = Number of physical access points to unrestricted portable storage media drives,
including unrestricted USB ports.
NT = Total reachability count = Ns+ No+ Np
Tools Network configuration discovery tools such as Nmap. Passive network traffic data collection tools can also be useful but passive tools do not identify communication paths unless they happen to be transmitting during the data collection period. For example an open TCP/IP port with no active clients would not be identified with a passive tool. Data Collection
Frequency
Data collection frequency depends on the stability of the system configuration and should occur whenever there has been a known configuration change that affects accessibility.
3ULPHU 5HFRPPHQGHG0HWULFV
Table 6. (continued).
Metric Name Reachability Count
Discussion This metric applies to a specific point of origin. The system manager may choose to combine the network and physical reachability counts or track them separately.
The network point of origin of most concern is the Internet. Because of the possibility of penetration of the perimeter, the system manager may choose to also calculate this metric for points of origin within the network perimeter, such as at the DMZ or behind each firewall. The measurement of reachable ports/services includes all the cases of crafted packets that exploit known vulnerabilities in firewalls and routers, such as the spoofing of IP addresses and packet fragmentation to disguise the targeted TCP port number.
The point of origin for physical access may be outside of the perimeter or some other partially controlled area or combination of areas within the fence as defined by the system manager. Examples of restricted portable storage media drives that should not be included in the count of physical access points are:
USB ports that are disconnected, physically locked or blocked with glue Host-based or device-based port encryption
Ports restricted by end-point control software.
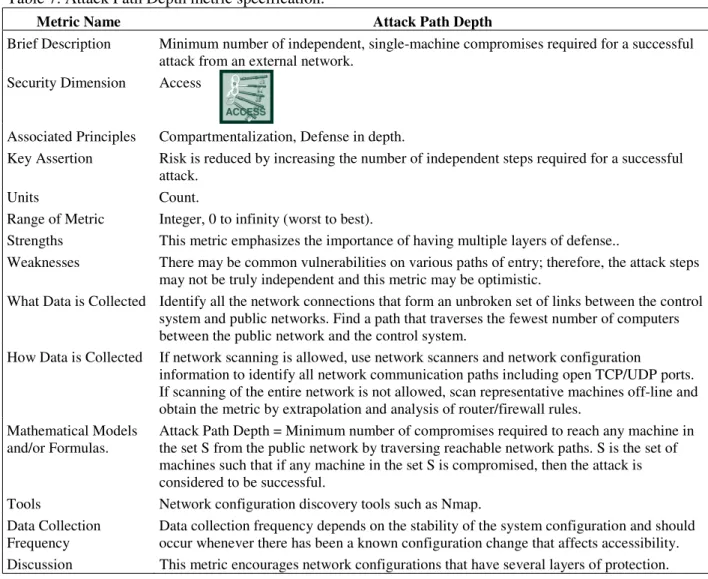
Table 7. Attack Path Depth metric specification.
Metric Name Attack Path Depth
Brief Description Minimum number of independent, single-machine compromises required for a successful attack from an external network.
Security Dimension Access
Associated Principles Compartmentalization, Defense in depth.
Key Assertion Risk is reduced by increasing the number of independent steps required for a successful attack.
Units Count.
Range of Metric Integer, 0 to infinity (worst to best).
Strengths This metric emphasizes the importance of having multiple layers of defense..
Weaknesses There may be common vulnerabilities on various paths of entry; therefore, the attack steps may not be truly independent and this metric may be optimistic.
What Data is Collected Identify all the network connections that form an unbroken set of links between the control system and public networks. Find a path that traverses the fewest number of computers between the public network and the control system.
How Data is Collected If network scanning is allowed, use network scanners and network configuration
information to identify all network communication paths including open TCP/UDP ports. If scanning of the entire network is not allowed, scan representative machines off-line and obtain the metric by extrapolation and analysis of router/firewall rules.
Mathematical Models and/or Formulas.
Attack Path Depth = Minimum number of compromises required to reach any machine in the set S from the public network by traversing reachable network paths. S is the set of machines such that if any machine in the set S is compromised, then the attack is considered to be successful.
Tools Network configuration discovery tools such as Nmap.
Data Collection Frequency
Data collection frequency depends on the stability of the system configuration and should occur whenever there has been a known configuration change that affects accessibility. Discussion This metric encourages network configurations that have several layers of protection.
5HFRPPHQGHG0HWULFV 3ULPHU
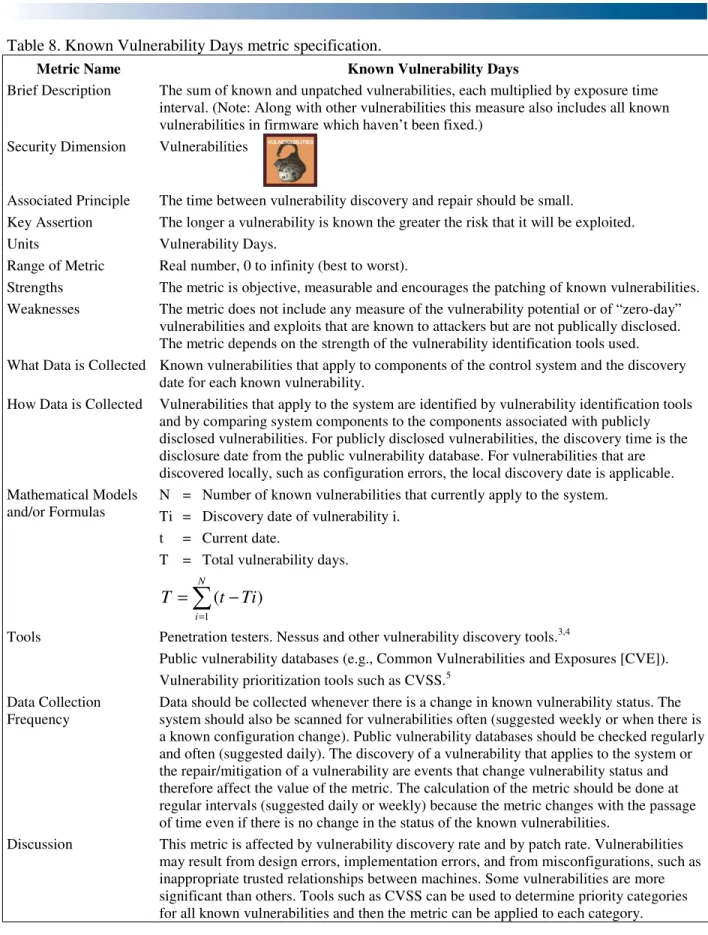
Table 8. Known Vulnerability Days metric specification.
Metric Name Known Vulnerability Days
Brief Description The sum of known and unpatched vulnerabilities, each multiplied by exposure time interval. (Note: Along with other vulnerabilities this measure also includes all known vulnerabilities in firmware which haven’t been fixed.)
Security Dimension Vulnerabilities
Associated Principle The time between vulnerability discovery and repair should be small.
Key Assertion The longer a vulnerability is known the greater the risk that it will be exploited.
Units Vulnerability Days.
Range of Metric Real number, 0 to infinity (best to worst).
Strengths The metric is objective, measurable and encourages the patching of known vulnerabilities. Weaknesses The metric does not include any measure of the vulnerability potential or of “zero-day”
vulnerabilities and exploits that are known to attackers but are not publically disclosed. The metric depends on the strength of the vulnerability identification tools used. What Data is Collected Known vulnerabilities that apply to components of the control system and the discovery
date for each known vulnerability.
How Data is Collected Vulnerabilities that apply to the system are identified by vulnerability identification tools and by comparing system components to the components associated with publicly disclosed vulnerabilities. For publicly disclosed vulnerabilities, the discovery time is the disclosure date from the public vulnerability database. For vulnerabilities that are discovered locally, such as configuration errors, the local discovery date is applicable. Mathematical Models
and/or Formulas
N = Number of known vulnerabilities that currently apply to the system. Ti = Discovery date of vulnerability i.
t = Current date.
T = Total vulnerability days.
¦
= − = N i Ti t T 1 ) (Tools Penetration testers. Nessus and other vulnerability discovery tools.3,4
Public vulnerability databases (e.g., Common Vulnerabilities and Exposures [CVE]). Vulnerability prioritization tools such as CVSS.5
Data Collection Frequency
Data should be collected whenever there is a change in known vulnerability status. The system should also be scanned for vulnerabilities often (suggested weekly or when there is a known configuration change). Public vulnerability databases should be checked regularly and often (suggested daily). The discovery of a vulnerability that applies to the system or the repair/mitigation of a vulnerability are events that change vulnerability status and therefore affect the value of the metric. The calculation of the metric should be done at regular intervals (suggested daily or weekly) because the metric changes with the passage of time even if there is no change in the status of the known vulnerabilities.
Discussion This metric is affected by vulnerability discovery rate and by patch rate. Vulnerabilities may result from design errors, implementation errors, and from misconfigurations, such as inappropriate trusted relationships between machines. Some vulnerabilities are more significant than others. Tools such as CVSS can be used to determine priority categories for all known vulnerabilities and then the metric can be applied to each category.
3ULPHU 5HFRPPHQGHG0HWULFV
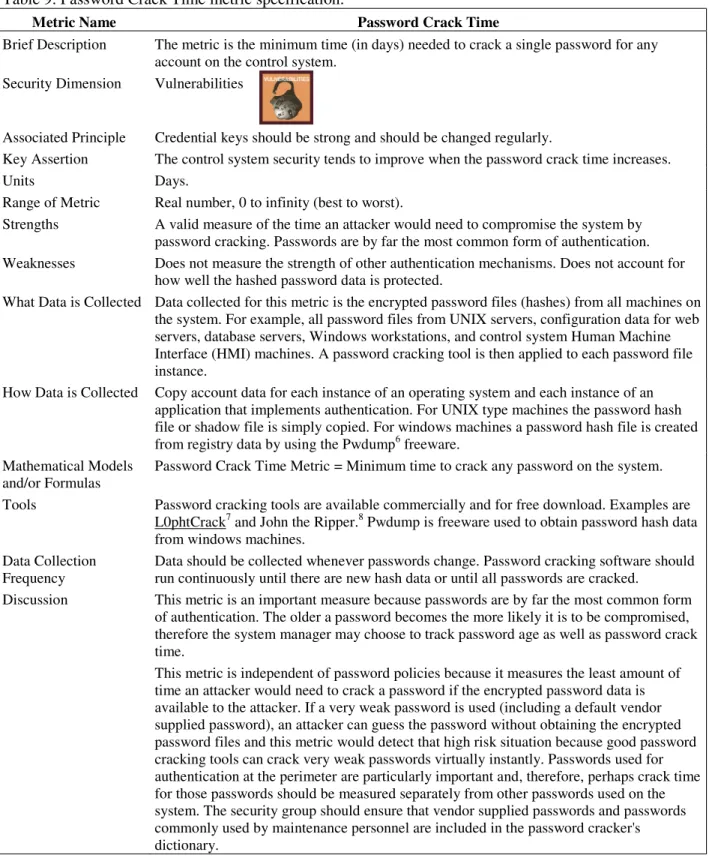
Table 9. Password Crack Time metric specification.
Metric Name Password Crack Time
Brief Description The metric is the minimum time (in days) needed to crack a single password for any account on the control system.
Security Dimension Vulnerabilities
Associated Principle Credential keys should be strong and should be changed regularly.
Key Assertion The control system security tends to improve when the password crack time increases.
Units Days.
Range of Metric Real number, 0 to infinity (best to worst).
Strengths A valid measure of the time an attacker would need to compromise the system by password cracking. Passwords are by far the most common form of authentication. Weaknesses Does not measure the strength of other authentication mechanisms. Does not account for
how well the hashed password data is protected.
What Data is Collected Data collected for this metric is the encrypted password files (hashes) from all machines on the system. For example, all password files from UNIX servers, configuration data for web servers, database servers, Windows workstations, and control system Human Machine Interface (HMI) machines. A password cracking tool is then applied to each password file instance.
How Data is Collected Copy account data for each instance of an operating system and each instance of an application that implements authentication. For UNIX type machines the password hash file or shadow file is simply copied. For windows machines a password hash file is created from registry data by using the Pwdump6freeware.
Mathematical Models and/or Formulas
Password Crack Time Metric = Minimum time to crack any password on the system. Tools Password cracking tools are available commercially and for free download. Examples are
L0phtCrack7and John the Ripper.8Pwdump is freeware used to obtain password hash data from windows machines.
Data Collection Frequency
Data should be collected whenever passwords change. Password cracking software should run continuously until there are new hash data or until all passwords are cracked.
Discussion This metric is an important measure because passwords are by far the most common form of authentication. The older a password becomes the more likely it is to be compromised, therefore the system manager may choose to track password age as well as password crack time.
This metric is independent of password policies because it measures the least amount of time an attacker would need to crack a password if the encrypted password data is available to the attacker. If a very weak password is used (including a default vendor supplied password), an attacker can guess the password without obtaining the encrypted password files and this metric would detect that high risk situation because good password cracking tools can crack very weak passwords virtually instantly. Passwords used for authentication at the perimeter are particularly important and, therefore, perhaps crack time for those passwords should be measured separately from other passwords used on the system. The security group should ensure that vendor supplied passwords and passwords commonly used by maintenance personnel are included in the password cracker's dictionary.
5HFRPPHQGHG0HWULFV 3ULPHU
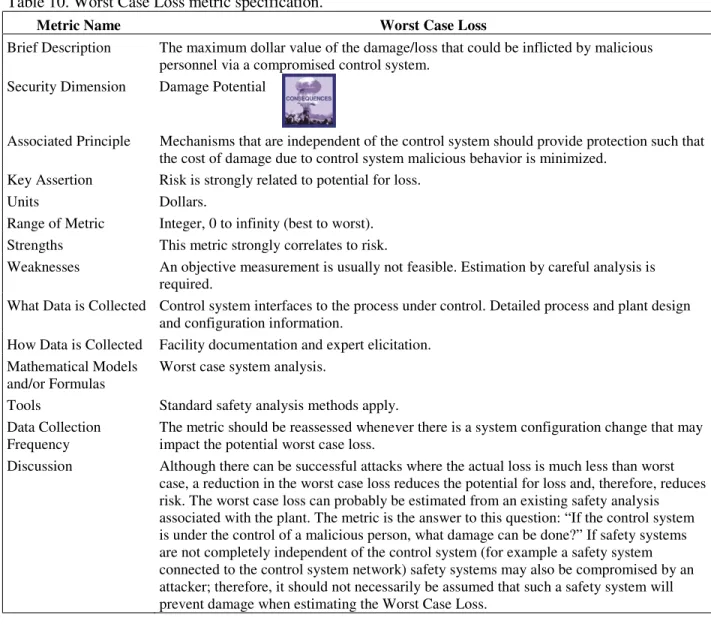
Table 10. Worst Case Loss metric specification.
Metric Name Worst Case Loss
Brief Description The maximum dollar value of the damage/loss that could be inflicted by malicious personnel via a compromised control system.
Security Dimension Damage Potential
Associated Principle Mechanisms that are independent of the control system should provide protection such that the cost of damage due to control system malicious behavior is minimized.
Key Assertion Risk is strongly related to potential for loss.
Units Dollars.
Range of Metric Integer, 0 to infinity (best to worst). Strengths This metric strongly correlates to risk.
Weaknesses An objective measurement is usually not feasible. Estimation by careful analysis is required.
What Data is Collected Control system interfaces to the process under control. Detailed process and plant design and configuration information.
How Data is Collected Facility documentation and expert elicitation. Mathematical Models
and/or Formulas
Worst case system analysis.
Tools Standard safety analysis methods apply.
Data Collection Frequency
The metric should be reassessed whenever there is a system configuration change that may impact the potential worst case loss.
Discussion Although there can be successful attacks where the actual loss is much less than worst case, a reduction in the worst case loss reduces the potential for loss and, therefore, reduces risk. The worst case loss can probably be estimated from an existing safety analysis associated with the plant. The metric is the answer to this question: “If the control system is under the control of a malicious person, what damage can be done?” If safety systems are not completely independent of the control system (for example a safety system connected to the control system network) safety systems may also be compromised by an attacker; therefore, it should not necessarily be assumed that such a safety system will prevent damage when estimating the Worst Case Loss.
3ULPHU 5HFRPPHQGHG0HWULFV
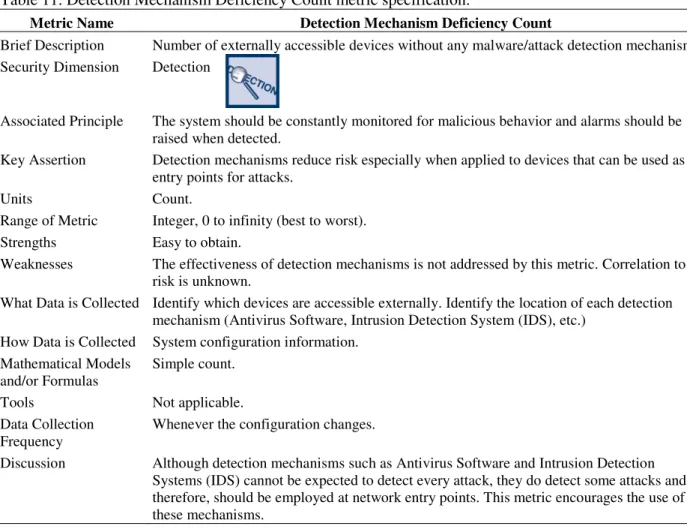
Table 11. Detection Mechanism Deficiency Count metric specification.
Metric Name Detection Mechanism Deficiency Count
Brief Description Number of externally accessible devices without any malware/attack detection mechanism. Security Dimension Detection
Associated Principle The system should be constantly monitored for malicious behavior and alarms should be raised when detected.
Key Assertion Detection mechanisms reduce risk especially when applied to devices that can be used as entry points for attacks.
Units Count.
Range of Metric Integer, 0 to infinity (best to worst).
Strengths Easy to obtain.
Weaknesses The effectiveness of detection mechanisms is not addressed by this metric. Correlation to risk is unknown.
What Data is Collected Identify which devices are accessible externally. Identify the location of each detection mechanism (Antivirus Software, Intrusion Detection System (IDS), etc.)
How Data is Collected System configuration information. Mathematical Models
and/or Formulas
Simple count.
Tools Not applicable.
Data Collection Frequency
Whenever the configuration changes.
Discussion Although detection mechanisms such as Antivirus Software and Intrusion Detection Systems (IDS) cannot be expected to detect every attack, they do detect some attacks and, therefore, should be employed at network entry points. This metric encourages the use of these mechanisms.
5HFRPPHQGHG0HWULFV 3ULPHU
Table 12. Restoration Time metric specification.
Metric Name Restoration Time
Brief Description Worst case elapsed time to restore the control system to a known uncorrupted version. Security Dimension Recovery
Associated Principle The time needed to restore the system to an uncorrupted state should be minimal. Key Assertion Risk is correlated with the amount of time needed to restore the control system to an
uncompromised state.
Units Minutes.
Range of Metric Real number, 0 to infinity (best to worst).
Strengths Simple model.
Weaknesses On some systems it may be difficult to measure accurately. Many systems require continual operation and there may be no known incidents that included full system restoration.
What Data is Collected Measure the actual time elapsed from “start” to a fully restored and 100% operational system.
How Data is Collected Record elapsed time during the recovery process. This data should be collected for actual security events if they have occurred. If there have been no recorded security incidents a test of the recovery process would include restoration of all software.
Mathematical Models and/or Formulas
T0= Start time (Time compromise is detected, or test start time)
Tr= Time at which recovery is complete and the system is 100% operational.
Restoration time = Maximum value of all instances of (Tr- T0).
Tools clock
Data Collection Frequency
As needed.
Discussion The metric can be determined by running a test to measure the actual time elapsed from the “start” of worst case compromise to a fully restored and 100% operational system. If it is impractical to perform that kind of test on an operational system, then this data should be collected for actual security events if they have occurred. If a recovery test is not feasible, then a worst case recovery analysis may be used to estimate recovery time.
3ULPHU &DVH6WXGLHV
4. CASE STUDIES
The recommended technical metrics were applied in two case studies of operating control systems. These studies helped to identify the practical limitations associated with data collection and provide specific examples of how the metrics could be obtained and used. TheControl System Technical Security Metrics Report9gives a detailed account of these case studies.4.1
Case Study 1
The first case study was of a Distributed Control System (DCS) for a chemical processing plant. Figure 1 is a simplified network diagram of the case study system.
Notice that the system is connected to the Internet through the corporate network. The router that provides connectivity between the corporate network and the local TCP/IP network restricts access to the control system with an access control list so that only the incoming TCP/IP connections with origination addresses that match the control list are allowed through the router. The system boundary is defined to be the processing plant and the control system networks that are within the control room. A dedicated
telephone line connects the control system to the plant data archive system, which has direct connectivity to the corporate network. The corporate network affects the security of the control system, but, for this study, the corporate network was not considered to be part of the system.
The DCS for this case study consists of a TCP/IP network that provides connectivity for eleven workstations and two printers, and a proprietary control network that provides connectivity to
approximately thirty distributed controller nodes that control and monitor the plant. The workstations on the TCP/IP network consist of standard IT hardware, standard IT operating system software, and
application software supplied by the DCS vendor. The controller nodes consist of specialized control hardware and software supplied by the same DCS vendor.
The metric values obtained for Study 1 are shown in Table 13, which also shows the ideal value and suggested target value for each metric. The suggested target value is the value we estimate could be obtained by changing the system configuration to improve security while retaining required functionality. This case study verified that the values of the metrics listed in Table 13 could be obtained using tools that are readily available.
corporate network Internet router TCP/IP network control network controllers chemical process system boundary plant data archive dedicated telephone line
…
…
Figure 1. Simplified diagram of Case study 1 (DCS).
Case Studies of Operating Control Systems:
1. Distributed control system for a chemical processing plant 2. SCADA System used for
3ULPHU &DVH6WXGLHV
All of the passwords for this case study,were cracked in less than one day using John the Ripper. The password hashes were LAN Manager hashes that are known to be easy to crack. The metric values obtained for Case Study 2 are shown in Table 14.
Table 14 also gives the ideal value for each metric and the suggested target value. The suggested target value is the value we estimate could be obtained by changing the system configuration as suggested by the comments in the table.
Table 14. Case Study 2 metric values.
Metric Name Metric Value Ideal Metric Value Suggested Target Value Comment
Rogue Change Days unknown 0 0 Mechanisms are needed to detect rogue changes
Password Crack Time 0 days 30+ days Use longer passwords and avoid LAN manager hash
of the password from being stored on the Windows machines (see http://support.microsoft.com/kb/299656). Data Transmission Exposure (Internet) 0 0 0 Data Transmission Exposure (Intranet)
28 0 0 Avoid using unencrypted protocols through the
firewall. 1. Reachability Count
(external) (NT)a
0 0 0 External reachability count total
1. Physical (Np) 0 0 0 No physical access outside the control room
1. Services (NS) 0 0 0 External connectivity only through a VPN
1. Outgoing (No) 0 0 0 firewall prevents outgoing connections
2. Reachability Count (local) (NT)
a 91 0 1 Local Reachability count total. From within control
room and/or from VPN
2. Physical (Np) 4 0 0 HMI and EWS have unrestricted physical access USB
ports inside the control room.
2. Services (NS) 87 0 1 Suggest further firewall rules to restrict VPN access.
2. Outgoing (No) 0 0 0 firewall prevents outgoing connections
Worst Case Loss unknown $0 unknown Worst case power outage from a cyber attack is
estimated to be 6 hours duration. The dollar value of such an outage has not been estimated.
Detection Mechanism Deficiency Count
46 0 0 There are no detection mechanisms on the system.
The addition of AV software and firewall restrictions can reduce metric value to zero.
Vulnerability Exposure (high priority)†
36,318 vuln. days
0 0 Recommend the operating system be patched to
current level. The PLC vulnerability has no available fix but PLC reachability improvement could mitigate the vulnerability. Vulnerability Exposure (low priority)b 18,624 vuln. days
0 0 All known vulnerabilities should be mitigated if
feasible.
Attack Path Depth 1 2 Suggest further firewall rules to restrict VPN access
to increase attack path depth.
Restoration Time 72 hours 0 5 hours Worst case restoration time is high because it requires a complete software rebuild.
a. NT = Np + NS + No.
6XUYH\RI3UHYLRXVO\3URSRVHG7HFKQLFDO0HWULFV 3ULPHU
5. SURVEY OF PREVIOUSLY PROPOSED TECHNICAL METRICS
Thirty guides and standards documents (including, forexample, references 10, 11, 12, and 13) were reviewed in search of technical metrics that have previously been defined and recommended.14A sampling of security metrics used by some industries was also included in the investigation. Most of the metrics found in the standards and guides are not technical metrics. Only a few of the reviewed standards documents recommended the use of a specific metric or set of metrics. The metrics described in standards documents are generally provided as examples rather than as recommended metrics.
Each of the identified technical metrics was analyzed by considering the circumstances in which the metric provides a meaningful security representation and relationship to risk. After evaluating the strengths and weaknesses of the various metrics it was determined that existing metrics have serious weaknesses. For example, many of the metrics were simply a percent of the system components that implemented a certain type of security control mechanism. However, the fractional implementation of a given security mechanism does not necessarily correlate to risk.
A specific metric defined in industry is “Average number of vulnerabilities per system component” This metric is easy to understand and it is easy to obtain estimates using automatic scanning tools. The problem with using an average is that all vulnerabilities and all components of the network are given equal weight. Consider the case where there is one easily exploitable vulnerability that allows penetration of a critical system component while there are zero known vulnerabilities on the other system
components. Now consider a case where there are no known vulnerabilities on critical components and no vulnerabilities that allow penetration from an external site, but there are many minor vulnerabilities on noncritical system components. The former case is a high-risk situation, but the metric indicates low risk while the latter case is a low-risk situation, but the metric indicates high risk. The assumption that all vulnerabilities and all components are of equal value is false for most systems. The metric can be improved by counting the number of vulnerabilities for each group of components with similar security implications and for vulnerabilities with similar effects (e.g., external penetration versus privilege escalation).
The survey of existing technical metrics clearly demonstrated the need for a framework in which to think about control system security and the definition of a small set of practical technical metrics that you can use to gain better insight into your security risk.
Survey results indicated the need for:
• A framework in which to think about control system security
• A set of practical technical metrics for use in better understanding security risks
3ULPHU 6XPPDU\
6. SUMMARY
The security framework for control systems consists of seven security dimensions, each related to risk. Based on case studies and reviews of control system security assessments, there is strong evidence that the framework’s security dimensions capture many of the system attributes which correlate with a control system’s risk exposure. As a result, the seven security dimensions are the recommended
foundation for thinking about the security of your system and are the foundation for the ten recommended technical metrics.
The ten recommended technical security metrics support you in assessing whether your security risk exposure is increasing or decreasing over time. The recommended metrics have been applied to control systems and proven to be practical and useful. However, every system and facility is unique so there may be a need to select metrics or measurement technologies in line with your particular circumstances. That being the case, it is still important to have at least one metric for each of the seven security dimensions.
An important use of the recommended technical metrics is in tracking the improvement or degradation of your systems security posture along all seven dimensions of security. As the security posture improves, the risk to your control system from a cyber attack diminishes. Diligent use of the security framework and application of the technical metrics will aid you in making more effective security decisions for your control systems.
5HIHUHQFHV 3ULPHU
7. REFERENCES
1. A. Jacquith,Security Metrics, Addison Wesley, 2007.2. Tripwire, http://www.tripwire.com/products/index.cfm 3. Nessus, vulnerability scanner: http://www.nessus.org. 4. Metasploit http://www.metasploit.com
5. M. Schiffman,A Complete Guide to the Common Vulnerability Scoring System (CVSS),
https://www.first.org/cvss/cvss-guide.html, Technical Report, Forum for Incident Response and Security Teams (FIRST), published June 7, 2005, Web site visited July 11, 2006.
6. Pwdump, http://www.darknet.org.uk/2006/10/download-pwdump-142-and-fgdump-134-windows-password-dumping.
7. LC5, http://www.securityfocus.com/tools/1005. 8. John the Ripper, (http://www.openwall.com).
9. W. F. Boyer, M. A. McQueen, S. M. McBride,Control System Technical Security Metrics Report, INL Report to the Department of Homeland Security, INL/EXT-07-13562, December 2007. 10. Chemical Sector Cyber Security Program (CSCSP),Guidance for Addressing Cyber Security in the
Chemical Industry, Technical Report, CSCSP, May 2006..
11. E. Chew, A. Clay, J. Hash, N. Bartol, A. Brown, Guide for Developing Performance Metrics for Information Security, NIST Special Publication 800-80, May 2006.
12. R. Ross, S. Katzke, A. Johnson, M. Swanson, and G. Rogers, “System Questionnaire with NIST SP 800-53: Recommended Security Controls for Federal Information Systems,” Technical Report, NIST, References and Associated Security Control Mappings, Gaithersburg, Maryland, March 2006
13. M. Swanson, N. Bartol, J. Sabato, J. Hash, and L. Graffo,Security Metrics Guide for Information Technology Systems, NIST Special Publication 800-55, National Institute of Standards and Technology (NIST), Gaithersburg, Maryland, July 2003
14. INL Report to the Department of Homeland Security,Cyber Security Metrics, INL/EXT-06-12016, December 2006.