Method for Calculating Schedule Delay
Considering Lost Productivity
Hyun-Soo Lee, M.ASCE
1; Han-Guk Ryu
2; Jung-Ho Yu
3; and Jae-Jun Kim, M.ASCE
4Abstract:A delay claim often occurs when a difference between the actual completion date and the contract completion date exists. The duration of a delay is an essential piece of information required for determining the cause of a delay. However, it is difficult to analyze a delay claim due to the fact that numerous factors that cause this delay, thereby making it a very complex issue. One of such factors is the lost productivity or loss of productivity. Despite the fact that it is one of the major causes of delay, there have been only a few studies that focus on converting lost productivity into delay duration carried out to date. Claims for productivity losses are generally the result of tension between the contractor and the owner. This tension arises due to the great difficulty involved in quantifying disruption effects. Thus, to calculate accurately the delay duration, a logical method for analyzing schedule delay caused by lost productivity is necessary. Therefore, in this study, we propose a method for analyzing construction schedule delay where this lost productivity is taken into consideration. This methodology was implemented on a case project to ascertain its practicability, and to decide whether it can be utilized in the case of a delay claim related to lost productivity. The significance of this paper is twofold. One is the method to convert the lost productivity into the delay duration, which can be applied to reasonable delay claim settlement. The other is the process to analyze the construction schedule delay considering lost productivity.
DOI:10.1061/共ASCE兲0733-9364共2005兲131:11共1147兲
CE Database subject headings:Claims; Delay time; Productivity; Data analysis; Databases; Construction industry.
Introduction
The duration of a construction project is an important factor to set forth when entering into a construction agreement. If a contractor works within a planned parameter, he/she should be able to finish the construction project in a timely manner. However, compared to other industries, it is difficult to complete a construction project in which many construction trades participate and numerous un-known variables exist. When such difficulties arise, construction schedules are delayed, and consequently delay claims occur.
Delays in construction may be caused by the owner, the con-tractor, acts of God, or a third party. They may occur early or late in the job, alone, or with other delays. In whatever cases, negoti-ating a fair and timely damage settlement is beneficial to all
par-ties 共Bubshait and Cunningham 1998兲. Thus, the ascertainment of the period of project delay serves as basic information for the apportionment of responsibility, which may be a highly complex operation in cases with concurrent causes 共Shi et al. 2001兲. As-signing responsibility for project delays is critical to the allocation of responsibility for time-related costs共Al-Saggaf 1998兲. In this respect, when a delay claim occurs, it is very important to assign responsibility and magnitude to the delay. However, many sources and causes of construction delays exist, and it is often difficult to analyze the ultimate liability in delay claims共Kraiem and Diekmann 1987兲. Lost productivity or loss of productivity is one of the most important causes of delay among the various causes of construction delays. Thus calculating the effect of lost productivity on delays is an intricate issue.
Although several studies have been directed toward the issue of analyzing delay and lost productivity 共Kallo 1996; Al-Saggaf 1998; Bubshait and Cunningham 1998; Finke 1998; 1999; Kar-tam 1999; Reichard and Norwood 2001兲, but they have been mostly concerned about converting lost productivity into cost. There have been only a few studies conducted on concrete meth-ods for converting lost productivity into delay duration.
The purpose of this study is to propose a practical method for converting lost productivity into delay duration. Several concepts pertinent to the lost productivity and its consequent delay analysis are introduced. The method is presented and implemented to a case project to ascertain its practicability.
Among the various factors that cause delays, this study fo-cuses on the factors that cause loss of productivity. There are a few kinds of productivity, e.g., labor productivity, equipment pro-ductivity, etc. This study has focused on the labor productivity because labor productivity representatively shows all kinds of productivity. The effect of lost productivity on delay duration will 1
Associate Professor, Dept. of Architecture, Seoul National Univ., Seoul 151-742, Korea 共corresponding author兲. E-mail: [email protected]
2
PhD Candidate, Dept. of Architecture, Seoul National Univ., Seoul 151-742, Korea. E-mail: [email protected]
3
PhD, Full–time Lecturer, Dept. of Architectural Engineering, Kwangwoon Univ., Seoul 139-701, Korea. E-mail: [email protected]; formerly, Dept. of Architecture, Seoul National Univ., Seoul 151-742, Korea.
4
Associate Professor, College of Architecture, Hanyang Univ., Seoul 133-791, Korea. E-mail: [email protected]
Note. Discussion open until April 1, 2006. Separate discussions must be submitted for individual papers. To extend the closing date by one month, a written request must be filed with the ASCE Managing Editor. The manuscript for this paper was submitted for review and possible publication on May 15, 2003; approved on March 22, 2005. This paper is part of theJournal of Construction Engineering and Management, Vol. 131, No. 11, November 1, 2005. ©ASCE, ISSN 0733-9364/2005/11-1147–1154/$25.00.
be calculated against critical works, which is represented as a line in the LOB form of a project schedule. The LOB form of a project schedule is practical in understanding the changes of productivity visually.
Schedule Delay Calculation Method Considering Lost Productivity
Review of Schedule Delay and Lost Productivity Calculation Methods
Many studies or methodologies directed at analyzing delay and lost productivity have been reported. The current status of delay calculating studies related to lost productivity can be summarized in three cases as follows.共1兲It is assumed that lost productivity claim is a different type of impact claim than a delay claim. Claimants frequently confuse these two types of claims because the impacts of both occur simultaneously共Bramble et al. 1990兲.
共2兲Lost productivity claims are limited to studies of converting lost productivity into cost such as total labor cost method, mea-sured mile analysis, expert estimate, industry factors, historical productivity data, etc.共Kallo 1996; Reichard and Norwood 2001兲. For example, the measured mile analysis is conducted by com-paring productivity during an unimpacted period of time with the productivity during an impacted period of time. The claim amount is the difference between the two productivity measures multiplied by the costs associated with the lost productivity. Dam-ages by lost productivity are calculated by subtracting the esti-mated costs from the actual costs incurred. Because the actual costs include the increased labor costs from the lost productivity, the cumulative effect of changes is addressed in the total cost overrun.共3兲Delay causes are conceived as activities in a project schedule such as a method of “what-if” evaluation or “but-for” schedule 共Al-Saggaf 1998; Bubshait and Cunningham 1998; Finke 1998, 1999, Kartam 1999兲. “But-for” schedule results from “pulling out” all owner delays that affected the as-built critical path. The amount of compensable delay is the difference in time between the actual completion date on the as-built schedule and the completion date on the “but-for” schedule.
As a result, a study concerning the methods of calculating schedule delay of lost productivity is not sufficient.
Basic Concepts for Considering Lost Productivity Productivity may be defined as the quantity of work produced per man hour, equipment hour, or crew hour共Finke 1998兲. As shown in Fig. 1, the lost productivity or loss of productivity is repre-sented by the productivity impacted by unexpected factors or im-pact factors. For example, a curtain wall crew consisting of five workers installing 34.65 m2/ h has a productivity rate of 6.93 m2/ man h under ideal conditions without any other impact factor. However, if the work is impacted by another impact factor such as unexpected adverse weather, the work productivity will decline, and unexpected extra time will be required for the im-pacted work productivity to be unimim-pacted work productivity.
To introduce the basic concepts regarding delay and produc-tivity, it is necessary to define the terminologies. Planned work duration共DP兲is the work duration with the planned work produc-tivity共PP兲of as-planned schedule. Actual work duration共DA兲is the work duration with the average productivity of as-built sched-ule共PA兲. As-built schedule is widely accepted for determining the impact of project delays. It is basically a comparison of what was planned to what actually occurred at the job site 共Bramble and Callahan 1992兲. Start time variance共VS兲is the difference between the actual start time of work and the finish time of the preceding work of the as-built schedule. Finish time variance 共VF兲 as the difference betweenDAandDPis composed ofDNandDP.
When lost productivity factors occur, the lost productivity共PL兲 of work can be calculated using Eq.共1兲, wherePUandPIdenote the unimpacted productivity of the activity and the impacted pro-ductivity of a given activity, respectively. If the work is planned properly, then thePUwill be the same as thePP
LP =Pu−Pi 共1兲
The lost productivity entails lost work, the amount of which could be completed without the lost productivity. The quantity of lost work due to the lost productivity共QPL兲can be calculated by the following equation, whereLIdenotes the daily average labor dur-ing the impacted work duration共DI兲
QPL=共PU−PI兲⫻LI⫻DI 共2兲 The lost productivity also entails lost duration DPL, which as an opportunity duration could be worked as much as QPLwith theLI andPU. The DPLcan be calculated by the following equation. All the variables in the equations hereafter are summarized in the Notation DPL= QPL LIPU =共PU−PI兲⫻LI⫻DI LIPU =DI
冉
1 − PI PU冊
共3兲 When the contractor’s claim includes the “ripple effect,” that is a request for compensation for activities whose productivity suf-fered indirectly due to the owner’s actions, the situation is further complicated. The owner is usually reluctant to accept the exis-tence of this ripple effect because it is not readily seen and be-cause it may be used to cover up the inefficiency be-caused by the contractor’s mismanagement 共Abdul-Malak et al. 2002兲. There-fore, the characteristics of the impact factor must be known to fairly assign the DPL.Impact factors affecting the DPL are categorized according to independence and impact on the next impact factor. An indepen-dent factor means that an impact factor does not have any effect on the duration of subsequent works共see Scenario 1 of Fig. 2兲. An impacting factor means that an impact factor adversely affects Fig. 1.Lost productivity
the duration of subsequent works when the next impact factor occurs even before the previous impact factor’s ripple effect has finished共see Scenario 2 of Figs. 2 and 3兲.
As shown in Fig. 3, if the PL共i−1兲共Fj−1兲 is impacted by Fj, the lost productivity will consist of the PL共i−1兲共Fj−1兲␣, the new PLi共Fj兲, and the intersection of PL共i−1兲共Fj兲 and PLi共Fj兲, or
PL共i−1兲共Fj−1兲, wherePLi共Fj兲denotes the portion ofith productiv-ity due to the ith factor. Usually the PL共i−1兲共Fj兲 is not equal to
PL共i−1兲共Fj−1兲becausePL共i−1兲共Fj−1兲would naturally change through a mode of learning curve as times passes. Thus the PL共i−1兲共Fj兲, which is PL共i−1兲共Fj−1兲 impacted by Fj, can be written as
PL共i−1兲共Fj−1兲␣. The␣is defined as the self ratio, the extent which
PL共i−1兲共Fj−1兲would naturally change from the initial point ofFj−1 to the initial point ofFjwithout theFj. Theis defined to explain the intersection as the impacting ratio, the extent which
PL共i−1兲共Fj−1兲affectsPLi共Fj兲.
Process for Schedule Delay Analysis
A common method for calculating a schedule delay is by compar-ing the as-planned schedule and the as-built schedule prepared by the critical path method 共CPM兲 共Kraiem and Diekmann 1987; Bubshait and Cunningham 1998兲. The critical works in the as-built schedule ultimately impact the delay duration. The critical works can be classified into two types. One type is the work impacting on the project completion date and the other type is the work that has no impact on the compeltion date. It is therefore necessary to analyze which works influence the completion date and to determine the degree of their impact. In other words, it is necessary to examine what the cause is, to determine who is
ac-countable for the work delay, and to calculate how much is im-pacted. The analysis of the delay duration can be carried out in the procedure depicted in Fig. 4.
1. Propriety analysis of as-planned schedule and as-built sched-ule. In this phase, propriety is analyzed to verify the reason-ableness of the as-planned schedule and DP considering the average labor productivity, appropriate resource allocation, labor usability, weather, appropriate materials, machine sup-ply, and so forth. After verifying that the as-planned schedule and DP are reasonable, the as-built schedule and DA are examined based on the evidence共e.g., detailed work sched-ules, updated schedule, daily reports, correspondence, delay description, etc.兲. The as-built schedule reflects the actual progression of events that occurs during the execution of the project. As a result, the as-built schedule should be made by carefully studying the project reports and documents
共Kraiem and Diekmann 1987兲and based on this evidence, it can be justified whether the as-built schedule andDA were appropriate.
2. Analysis of critical works in as-built schedule. A construction project normally proceeds at a pace that is usually different from the as-planned schedule. The criticality of individual activities in a CPM network changes due to delays and ac-celerations in construction共Arditi and Robinson 1995; Shi et al. 2001兲. A project delay is the accumulated effect of delays in individual activities共Shi et al. 2001兲. Because the delay of critical work in the as-built schedule ultimately affects the project completion date, delay causes within the critical works must be recorded and analyzed on the as-built sched-ule. It is important to know which work among the critical works influences the project delay and the extent of their influence on the as-built schedule. The extent of the impact on the project delay should be analyzed comprehensively by considering the project characteristics, field environment, the Fig. 2.Lost productivity factors’ characteristics
Fig. 3.Change ofPL共i−1兲共Fj兲impacted byFj
impacted work characteristic, the completed work extent, and so forth.
3. Analysis ofVSandVF. Through a comparison of the critical works in the built schedule and the works in the as-planned schedule, VS andVF can be calculated. After cal-culating VS andVF, the causes or impact factors of the VS and VF must be found and analyzed by investigating the evidence.
4. Finding the evidence ofVF. Once the claimant has been con-vinced that the construction could be completed if the works were carried out according to the as-planned schedule and that the as-planned schedule is sufficient to meet the work sequencing restraints, then he/she will question why the works were actually delayed. A construction claim is an as-sertion of and a demand for compensation by way of evi-dence produced and arguments advanced by a party in sup-port of its case共Kululanga et al. 2001兲. So, theDNofVFcan be found and assigned to the owner, the project contractor, or a third party according to their responsibility. If aDA exclud-ing theDN is equal to theDP, the delay calculation is com-plete. In this case, the actual productivity of the work is consistent with thePP. However, if theDAis not equal to the
DP, the calculating process proceeds to the next phase. If the project contractor has no evidence to prove thePL, the cal-culating process should also be stopped. In other words, if is not verified, then⑀ is the contractor’s responsibility关See Eq.共6兲兴.
5. Analysis of delay causes. After theVFevidence is confirmed, the impact factors can be analyzed by comparing theDAwith theDP. The contractor can finish planned work quantity共QP兲 with the unimpacted daily labors共LU兲and the PUwithin the duration共DC兲. This can be calculated by the following equa-tion, whereQUdenotes the quantities worked in the normal and realistic work conditions of an unimpacted work dura-tion 共DU兲, andQI denotes the quantities worked in the im-pacted work duration共DI兲
DC= QP LUPU =QU+QI LUPU 共4兲 Time is of the essence in a construction contract. Typically, a time period is defined as the contract duration. The contrac-tor is obliged under the contract to achieve substantial completion within the specified period 共Shi et al. 2001兲.
Therefore, contractor’s difference共DD兲between DC andDP is a mistake made by the contractor as a result of a miscal-culation of the work duration in planning.DDcan be calcu-lated by the following equation:
DD=DC−DP=
QP
LUPU−DP 共5兲
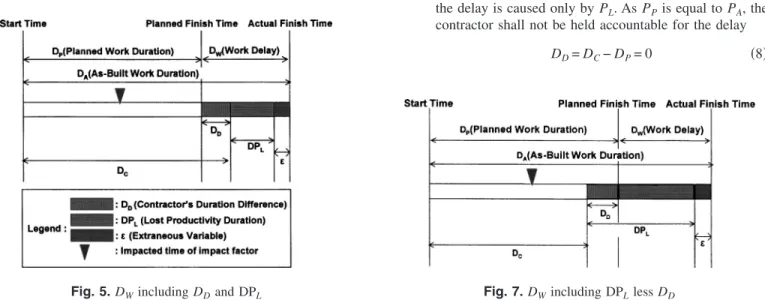
Work delay共DW兲consists ofDD, DPL, andas shown in the following equation, whereDDand DPLare independent vari-ables and is an extraneous variable that accounts for any delays other thanDCand DPL
DW=DD+ DPL+ 共6兲
DW are classified into three cases: DW including DD and DPL,DWincluding only DPL, andDWincluding DPLlessDD. 1. DWincludingDDand DPL.DWincludes allDDand DPL during the impacted work duration as shown in Fig. 5. WhenDDis greater than zero, as shown in the following equation, the delay is caused by the contractor’s mistake such as the allocation of lower labor and productivities than the as-planned schedule. In this case, the contractor could not be compensated or, rather, should compensate the owner for the liquidated damage
DD=DC−DP⬎0 共7兲 2. DWincluding only DPL. TheDWincludes only DPLin the case where theDAof the as-built schedule is equal to the
DPof the as-planned schedule as shown in Fig. 6. When
DDis equal to zero, as shown in the following equation, the delay is caused only byPL. AsPPis equal to PA, the contractor shall not be held accountable for the delay
DD=DC−DP= 0 共8兲
Fig. 5.DWincludingDDand DPL
Fig. 6.DWincluding only DPL
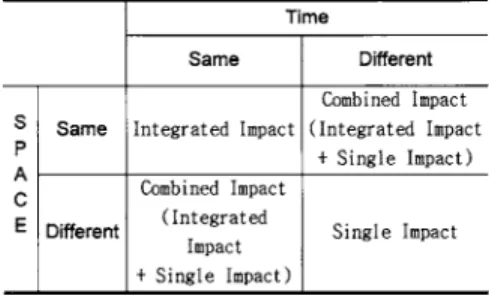
3. DWincluding DPLless DD. WhenDDis less than zero, as shown in the following equation,DWis calculated by only DPL. If it were not for the DPL, the actual work could have been finished earlier than DP, as demonstrated in Fig. 7. If theDCis shorter than theDP, the work might be performed by acceleration or the use of more labor than was originally planned, but the effort cannot be recog-nized as a compensable delay
DD=DC−DP⬍0 共9兲
Assignment of Lost Productivity Duration Calculation of Lost Productivity
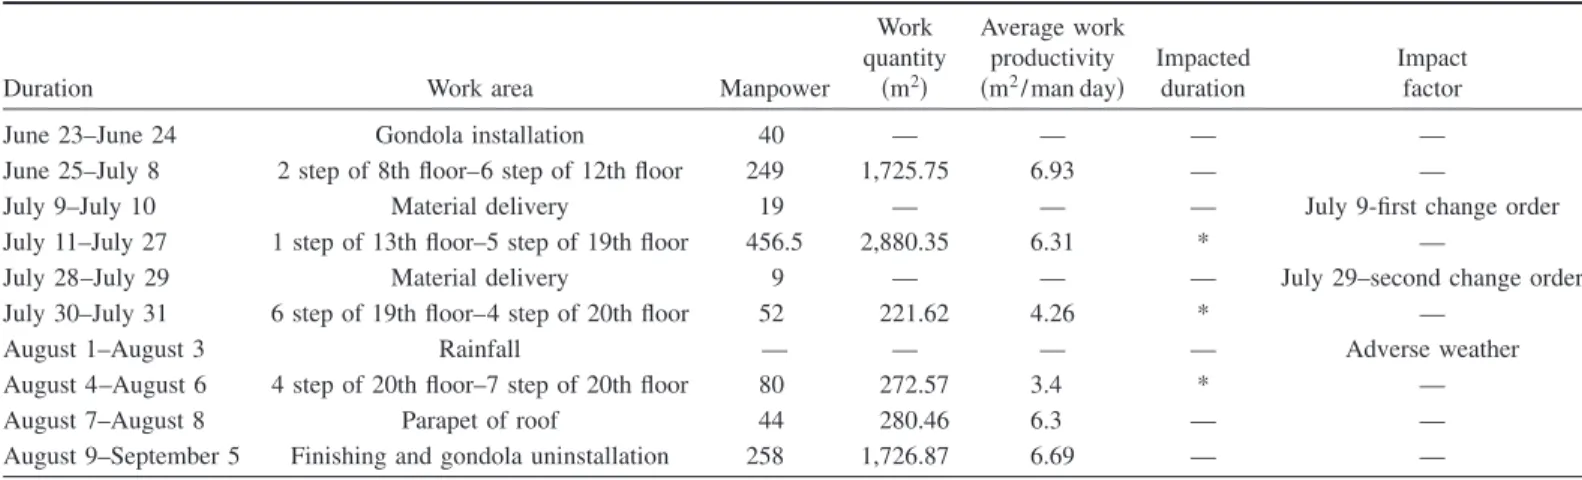
After DPLis verified, the DPL must be assigned to the source by analyzing the impact factors. The responsibility for delays can fall on the owner, the contractor, or third parties. Compensation or liquidated damage can be determined in proportion to the extent of the impact: self ratio共␣兲and impacting ratio共兲. Impact fac-tors with␣and impact factors withcan affect the productivity as a manner of integrated impact, single impact, and combined impact according to the time-space 2⫻2 matrix, as shown in Fig. 8.
When given impact factors affect the work productivity at the same time and at the same space, the extent of the integrated impact represents the extent to which proceeding impact factors equally affect the productivity of subsequent work. Integrated im-pact factor is analogous to the characteristics of concurrent de-lays. Concurrent delays are used to describe two or more delays that occur at the same time by one or more of the parties共Richter 1983; Kraiem and Diekmann 1987; Bramble and Callahan 1992; Rubin et al. 1992兲. For example, when the curtain wall design change of the main entrance and the material items’ change of the curtain wall of the main entrance occurred by the owner at the same time, this would cause a delay in the work. In this case, the lost productivities caused by the design change and the material items’ change of the main entrance occurred integrally according to integrated impact factors.
When given impact factors affect work productivity at a dif-ferent time and at a difdif-ferent space, the extent of the single impact represents the extent which proceeding impact factors have dif-ferent effects on the productivity of the subsequent work. For example, when a change order concerning the curtain wall work on the fifth floor is made, this would cause a delay in the work. Then, several days later after the change orders, the curtain wall work on the seventh floor was delayed because of a malfunction
of the gondola. In this case, the lost productivities caused by the change order and the machine malfunction are different according to single impact.
The combined impact is the combination of integrated impact and single impact. For example, if 1 week later after the design change and the material items change of the main entrance oc-curred at the same time and at the same space共integrated impact factors兲, and there was also a malfunction in the gondola共single impact factor兲, the lost productivities of the integrated impact factors and single impact factor should both be calculated. Sum of PL„SPL…
After analyzing the characteristics of impact factors by using the time-space 2⫻2 matrix, the sum of PL共SPL兲 can be quantified according to the impact factor’s characteristics. PLi changes ac-cording to the characteristics of the impact factors fromFjtoFn. The SPLfromFitoFncan be written as the following equation:
SPL1_共F1,F2,¯,Fn兲=
兺
i=1 n PL1共Fi兲 SPL2_共F2,F3,¯,Fn兲=兺
i=2 n PL2共Fi兲 ¯ ¯ SPLk _共Fk,Fk+1,¯,Fn兲=兺
i=k n PLk共Fi兲 ¯ ¯ SPL共n−1兲共Fn−1,Fn兲=兺
i=n−1 n PL共n−1兲共Fi兲 共10兲 Sum Assignment ofDPLIt is essential that distinctions of excusable/nonexcusable delays are made when analyzing delays. Excusable/compensable delays are due to some actions or omission of the owner, for example, lack of site access, or late arrival of owner-furnished material or Fig. 8.Integrated, single, and combined impact
equipment. In such cases, the contractor would be entitled to damages for extra costs incurred unless there is an enforceable contract clause barring such recovery. Excusable/noncompensable delays are delays for which neither party is at fault such as: acts of God, epidemics, etc., as set forth in the delay clause. Time extension is the only remedy for such delays. Nonexcusable de-lays are dede-lays caused by the contractor. These could include failure in coordinating the work, insufficient manpower on the job, late delivery of equipment furnished by the contractor, low productivity, defective work that must be promptly corrected, etc. Such delays could be compensable to the owner in the form of liquidated or actual damages共Rubin et al. 1992兲.
After calculatingPLof each impact factor and SPL, the respon-sibility for the SPLcan be assigned to the owner, the contractor, or the third party, based on the causes. The sum of the DPLcan be calculated as the following equation:
SDPLi共Fj兲=
SPLi共Fj兲⫻LI⫻DI
LIPU
共11兲
Case Study
The case project for this case study was the construction of a 20-story office building located in the business center of Seoul,
Korea. The construction project was performed in the manner of a traditional delivery system or a single contract. One of the writers was actually involved in the project. Productivity data were col-lected daily in a database and used for the delay analysis in this case study. The following sections will explain the analysis con-ducted on the delay by using the process proposed in this paper.
Propriety Analysis of As-Planned Schedule and As-Built Schedule
Common work duration in the as-planned schedule was investi-gated thoroughly and the as-built schedule was reasonably compiled according to the evidence that was stored in the data-base. Therefore, the as-planned schedule and as-built schedule can be seen to be of acceptable level to be used in the proposed methodology.
Analysis of Critical Works in As-Built Schedule
The planned completion date of the master plan was October 31, 1999 but the actual completion date was November 25, 1999. The project was delayed for 25 days共See Figs. 9 and 10兲.
The planned critical works are from ACT1 to ACT16 共the planned project duration is 930 days兲but the actual critical works are from ACT1 to ACT4 and from ACT17 to ACT29共the actual project duration was 955 days兲. Thus, from ACT1 to ACT4 and from ACT17 to ACT29 were the impacting works of the actual delay of the project completion in this case study. This case study focuses particularly on the ACT27共the exterior curtain wall ac-tivity兲which was delayed the longest.
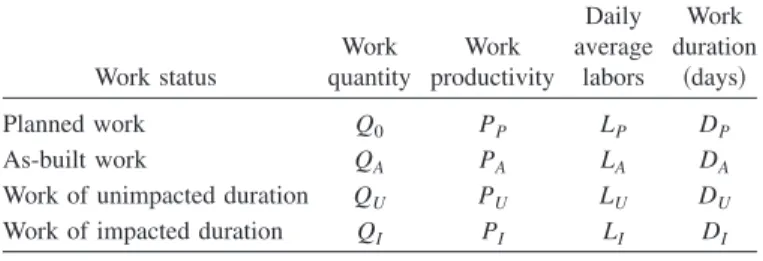
Table 1.Productivity Data Summary of ACT27
Duration Work area Manpower
Work quantity 共m2兲 Average work productivity 共m2/ man day兲 Impacted duration Impact factor
June 23–June 24 Gondola installation 40 — — — —
June 25–July 8 2 step of 8th floor–6 step of 12th floor 249 1,725.75 6.93 — —
July 9–July 10 Material delivery 19 — — — July 9-first change order
July 11–July 27 1 step of 13th floor–5 step of 19th floor 456.5 2,880.35 6.31 * —
July 28–July 29 Material delivery 9 — — — July 29–second change order
July 30–July 31 6 step of 19th floor–4 step of 20th floor 52 221.62 4.26 * —
August 1–August 3 Rainfall — — — — Adverse weather
August 4–August 6 4 step of 20th floor–7 step of 20th floor 80 272.57 3.4 * —
August 7–August 8 Parapet of roof 44 280.46 6.3 — —
August 9–September 5 Finishing and gondola uninstallation 258 1,726.87 6.69 — —
Fig. 10.Comparison of as-planned schedule and as-built schedule
Analysis of VS and VF
The DP of ACT27 was from June 17, 1999 to August 15, 1999 and the DA of ACT27 was from June 23, 1999 to September 5, 1999 as shown in Fig. 11. It was proved that the 6 days ofVSwas the cause of the proceeding work ACT26 performed by the same subcontractor and theVFis 15 days.
Finding Evidence of VF
The lost productivity of the ACT27 was impacted by three impact factors共FS兲: the owner’s two change orders and adverse weather. The productivity data of the ACT27 is summarized in Table 1 based on the construction productivity database.
Cause Analysis of Work Delay
The total number of labor days was 249, the work quantity was 1 , 725.75 m2, and no impact factor was found from June 25, 1999 to July 8, 1999. Thus LU are 17.8 labor days and PU are 6.93 m2/ man day LU= 249 men 14 days = 17.8 man/day PU= 1,725.75 m2 17.8 man/day⫻14 days= 6.93 m 2/man day
TheDDcan be calculated using Eq.共5兲. The total work quantity of curtain wall less parapet work quantity 共QP兲is 6 , 827.16 m2. TheDPexcept for theDN is 54 days
DD=DC−DP= Q0 LUPU −DP= 6,827.16 17.8⫻6.93− 54 = 1.34⬎0 Thus,DWincludes DDand DPL duringDI.
Characteristics ofFsand Calculation ofSPL
Because Fsoccurred at a different time and at a different space, the Fsrepresent single impact factors. The consequence of ana-lyzing the characteristics of the first, second, and third impact factor is independency 共␣= 0 % ,= 0 %兲 in which PL共i−1兲共Fj−1兲 was dismissed during the following work duration. Thus, SPLi caused byF1,F2, andF3can be calculated as follows:
SPL1_共F1,F2,F3兲=
兺
i=1 3 PL1共Fi兲=PL1共F1兲= 6.93 − 6.31 = 0.62 SPL2共IF2,IF3兲=兺
i=2 3 PL2共FLi兲=PL2共F2兲= 6.93 − 4.26 = 2.67 SLP3 _IF3= LP3_IF3= 6.93 − 3.4 = 3.53SDPLCalculation of First, Second, and Third F
SPL1共F1兲 is 0.62共m2/ man day兲,L1 is 28.5 共labor days兲, and D1, except for aDN共July 22兲due to rain, is 16 days. QPL1and SDPL1 are calculated as follows关See Eqs.共2兲and共11兲兴. Other SDPLs are calculated in the same way as shown in Table 2.
QPL1=共PU−P1兲⫻L1⫻D1= 0.62⫻28.5⫻16 = 282.72 m2 共12兲 SDPL1= QPL1 L1PU = 282.72 28.5⫻6.93= 1.43 days 共13兲 Assignment ofSDPL
According to the responsibility for the SDPL, the SDPL can be assigned to the owner, the contractor, or the third party. The first and second change orders issued by the owner are excusable/ compensable delay and the adverse weather is excusable/ noncompensable delay:
• nonexcusable delay= 75−共60+ 7.67+ 3.26兲= 4.07 days, • excusable/ compensable delay= 1.43+ 1.83= 3.26 days, and • excusable/ noncompensable delay= 3 + 4.67= 7.67 days.
From this, we can conclude that the contractor has the respon-sibility for the 4.07 days among the total 15 delays of ACT27
共more accurately writing FTV of ACT27兲of the liquidated dam-age共see Table 3兲.
Conclusion
An analysis of delays that occurred in a construction process and the allocation of the responsibilities for the delays always entail differences of opinion on the cause of the delay and on who should be held accountable. In particular, when delays caused by lost productivity are involved, the analysis becomes very compli-cated. There are several reasons that contribute to the delay of a project. Many studies or methodologies for analyzing the delay have focused on these reasons. The reasons for a delay are usually conceived of activities in a project schedule and the impacted activities are analyzed without considering the impacted produc-tivity. However, if some variables impact the next sequence of the work in the construction project, the impacted work may become lost productivity work. As only a few studies have been reported on converting lost productivity into a delay, this paper presents a
Table 2.SDPLof ACT27 Classification Q共Fi兲 P共Fi兲 SPL共Fi兲 L共Fi兲 D共Fi兲 QPL共Fi兲 SDPL共Fi兲 Unimpacted duration 1,725.75 6.93 — 17.8 14 — — First impacted duration 2,880.35 6.31 0.62 28.5 16 282.72 1.43 Second impacted duration 221.62 4.26 2.67 26 2 138.84 1.83 Third impacted duration 272.57 3.4 3.53 26.7 3 282.75 4.67
Table 3.Variables Used in Equations
Work status Work quantity Work productivity Daily average labors Work duration 共days兲 Planned work Q0 PP LP DP As-built work QA PA LA DA
Work of unimpacted duration QU PU LU DU
method for calculating schedule delays considering lost produc-tivity in an attempt to settle claims without litigation. The main conclusions from this study are as follows:
1. The methodology introduced several concepts regarding delay and productivity, such as planned and actual work duration, impact factors, lost productivity, the duration of lost productivity, start time variance, and finish time vari-ance, etc.
2. Based on those concepts, a delay analysis process and equations for calculating the required values are developed with which schedule delays can be analyzed with greater accuracy.
3. The methodology was presented and implemented to a case project to show its practicality. The case study indicates that the method is a more logical process for analyzing of the complicated delay situations, and thus can provide more de-tailed analysis results on schedule delays.
We could also conclude that a properly designed database could aid in the accumulation of statistical data on self ratio共␣兲 and impact ratio 共兲, and contribute in the application of the proposed methodology. As a result, further research on the utili-zation of such a database will be conducted in the future.
Acknowledgment
The writers would like to thank the Korea Institute of Science and Technology Evaluation and Planning共Grant No. M10104000274-01J000012100兲for their contributions to this research.
Notation
The following symbols are used in this paper:
DC ⫽ duration within which planned work duration共DP兲 could be finished with daily average labors共LU兲and unimpacted productivity共PU兲;
DD ⫽ contractor’s difference betweenDCandDP;
Di ⫽ portion ofith duration due toith factor;
DN ⫽ nonworked day;
DW ⫽ work delay;
DPL ⫽ lost productivity duration;
Pi ⫽ portion ofith productivity due toith factor;
PL ⫽ lost productivity;
PLi共Fj兲 ⫽ portion ofith lost productivity due to jth factor; QPL ⫽ lost productivity quantity;
VF ⫽ finish time variance;
VS ⫽ start time variance; and
i ⫽ portion ofith lost productivity not due to factors detected.
References
Abdul-Malak, M. A., Ei-Saadi, M. H., and Abou-Zeid, M.共2002兲. “Pro-cess model for administrating construction claims.”J. Manage. Eng.,
18共2兲, 84–94.
Al-Saggaf, H. A. 共1998兲. “The five commandments of construction project delay analysis.”Cost Eng., 40共4兲, 37–41.
Arditi, D., and Robinson, M. A.共1995兲. “Concurrent delays in construc-tion litigaconstruc-tion.”Cost Eng., 37共7兲, 20–30.
Bramble, B. B., and Callahan, M. T.共1992兲.Construction delay claims, 2nd Ed., Wiley, New York.
Bramble, B. B., D’Onfrio, M. F., and Stetson, J. B.共1990兲.Avoiding & resolving construction claims., R.S.Means Company.
Bubshait, A. A., and Cunningham, M. J.共1998兲. “Comparison of delay analysis methodologies.”J. Constr. Eng. Manage., 124共4兲, 315–322. Finke, M. R.共1998兲. “A better way to estimate and mitigate disruption.”
J. Constr. Eng. Manage., 124共6兲, 490–497.
Finke, M. R.共1999兲. “Window analysis of compensable delays.”J. Con-str. Eng. Manage., 125共2兲, 96–100.
Kallo, G. G.共1996兲. “Estimating loss of productivity claims.”J. Manage. Eng., 12共6兲, 13–15.
Kartam, S.共1999兲. “Generic methodology for analysing delay claims.”J. Constr. Eng. Manage., 125共6兲, 409–419.
Kraiem, Z. M., and Diekmann, J. E.共1987兲. “Concurrent delays in con-struction projects.”J. Constr. Eng. Manage., 113共4兲, 591–602. Kululanga, G. G., Kuotcha, W., McCaffer, and Edum-Fotwe, F.共2001兲.
“Construction contractors’ claim process framework.”J. Constr. Eng. Manage., 127共4兲, 309–314.
Reichard, D. D., and Norwood, C. L.共2001兲. “Analyzing the cumulative impact of changes.”AACE International Transactions, AACE Inter-national.
Richter, I. E.共1983兲. International construction claims: Avoiding & re-solving disputes, McGraw–Hill, New York.
Rubin, R., Fairweather, V., Guy, S., and Maevis, A.共1992兲.Construction claims prevention and resolution, 2nd Ed., Van Nostrand-Reinhold, New York.
Shi, J. J., Cheung, S. O., and Arditi, D. 共2001兲. “Construction delay computation method.”J. Constr. Eng. Manage., 127共1兲, 60–65.