This PDF document was made available from www.rand.org as a public service of the RAND Corporation.
6
Jump down to documentVisit RAND at www.rand.org
Explore RAND Education
View document details
This document and trademark(s) contained herein are protected by law as indicated in a notice appearing later in this work. This electronic representation of RAND intellectual property is provided for non-commercial use only. Permission is required from RAND to reproduce, or reuse in another form, any of our research documents.
Limited Electronic Distribution Rights
For More Information
CHILD POLICYCIVIL JUSTICE EDUCATION ENERGY AND ENVIRONMENT HEALTH AND HEALTH CARE INTERNATIONAL AFFAIRS NATIONAL SECURITY POPULATION AND AGING PUBLIC SAFETY SCIENCE AND TECHNOLOGY SUBSTANCE ABUSE TERRORISM AND HOMELAND SECURITY TRANSPORTATION AND INFRASTRUCTURE
The RAND Corporation is a nonprofit
research organization providing
objective analysis and effective
solutions that address the challenges
facing the public and private sectors
around the world.
Purchase this document Browse Books & Publications Make a charitable contribution
Support RAND
This product is part of the RAND Corporation monograph series. RAND monographs present major research findings that address the challenges facing the public and private sectors. All RAND mono-graphs undergo rigorous peer review to ensure high standards for research quality and objectivity.
Stephen J. Carroll, Cathy Krop, Jeremy Arkes, Peter A. Morrison, Ann Flanagan
Supported by the William and Flora Hewlett Foundation
California’s K–12
Public Schools
The RAND Corporation is a nonprofit research organization providing objective analysis and effective solutions that address the challenges facing the public and private sectors around the world. RAND’s publications do not necessarily reflect the opinions of its research clients and sponsors.
R® is a registered trademark.
© Copyright 2005 RAND Corporation
All rights reserved. No part of this book may be reproduced in any form by any electronic or mechanical means (including photocopying, recording, or information storage and retrieval) without permission in writing from RAND.
Published 2005 by the RAND Corporation
1776 Main Street, P.O. Box 2138, Santa Monica, CA 90407-2138 1200 South Hayes Street, Arlington, VA 22202-5050 201 North Craig Street, Suite 202, Pittsburgh, PA 15213-1516
RAND URL: http://www.rand.org/
To order RAND documents or to obtain additional information, contact Distribution Services: Telephone: (310) 451-7002;
Fax: (310) 451-6915; Email: [email protected]
Library of Congress Cataloging-in-Publication Data
California’s K–12 public schools : how are they doing? / Stephen J. Carroll ... [et al.]. p. cm.
“MG-186.”
Includes bibliographical references. ISBN 0-8330-3716-1 (pbk. : alk. paper)
1. Public schools—California. 2. Education—California—Evaluation. 3. Educational equalization—California. 4. Education and state—California. I. Carroll, Stephen J., 1940–
LA243.C34 2005 371.01'09794—dc22
2004025761
The research described in this report was conducted by RAND Education for the William and Flora Hewlett Foundation.
iii
Foreword
Jorge Ruiz-de-Velasco and Marshall S. Smith The William and Flora Hewlett Foundation
This RAND report carefully documents how California’s public schools have declined in quality along many important dimensions since the 1970s. Moreover, the investigators report a growing, if somewhat vague, awareness among Californians that the quality of our public schools has slipped both relative to the past, as well as to schools in other states. Yet, despite this growing awareness, it is fair to say that there has been little sense of urgency among voters about the condition of our schools. Even as an enormous revenue shortfall in the spring and summer of 2003 forced state and local districts to make large cuts in school budgets, media and public attention to the problems facing our schools has been scant or localized. The danger now, as in previous budget crises, is that leaders will look for short-term solutions in the hope that the economy turns around quickly enough to keep them from having to make hard reform choices.
Why the complacency at the state level about the quality of our schools? We believe the problem is two fold. First, although the state collects a great deal of data about student performance and the distri-bution of resources to schools, these data are difficult and costly for reporters and even professional policy analysts to obtain and synthe-size. Consequently, journalists and others rely on local reports about individual schools or groups of schools or even about individual stu-dents to tell the story. The result is that attentive citizens get a glimpse of heroic teachers and stalwart students struggling to teach and learn in decrepit schools that lack books, certified teachers, or functioning bathrooms. The take-away has often been a recognition that things in some schools are pretty bad, but no real sense of the
iv California’s K–12 Public Schools: How Are They Doing?
scope of the crisis across the state in general. In this context, it has been easy for voters and leaders to minimize the situation and to seek only short-term solutions, or to target only the offending schools for improvement.
A second explanation for public complacency involves the old rule that a problem with no apparent solution (or consensus about a solution) is generally not defined as a problem. Instead it comes to be accepted as “just the way things are.” In the case of schools there has been little attention paid to the yawning gap between our high curriculum standards and the inadequate resources we provide to schools, in part because state leaders have been divided about the scope of the problem or about the proper solution when the problem is acknowledged. In this ambiguous context only stakeholders (teach-ers and sometimes parents) get involved in the political fray while the confused public tunes out.
In response, the William and Flora Hewlett Foundation launched a multi-year effort, begun in 2002, to address the two problems we have just outlined. This study is the most recent product in an effort to gather, analyze, and broadly disseminate information about the status of public education across the state. Our hope is that studies like this will provide important context for all those individual investigations of local schools by giving Californians and our policy leaders reliable information about the scope of the challenges facing our teachers and students in virtually every California school district.
We hope that these studies will do more than just define the challenges we face, but will also underscore lessons learned and point the way to solutions and policy options that would have wide appeal to voters and school stakeholders across the state. Indeed some of those solutions have been suggested in the following pages. The re-port, for example, concludes that California students rank among the lowest in the nation in student achievement, and that this is consis-tently true across all racial and ethnic groups. One source of this problem is that California’s accountability system provides school leaders with an end-of-the-year snapshot of how the school per-formed, but does not provide data in a time and manner that could be used by teachers and principals for continuous improvement. By
Foreword v
contrast, states with similar demographics, like Texas, have made more robust progress on student achievement because their account-ability systems provide multiple opportunities for teachers to assess student progress on meeting state standards and, potentially, to make mid-course corrections. Our accountability system needs to move in this direction before we can hope to begin closing the achievement gap with other states.
The RAND report also suggests that the time is right for Cali-fornians to rethink Proposition 98, which was intended to establish a minimum funding formula for schools, but which has come to func-tion more as a funding ceiling than a floor. Despite the good inten-tions behind Proposition 98, the RAND report documents continu-ing inequalities in the resources—both capital and human—available to schools in poor communities with large concentrations of African-American and Latino students. The inequalities represent a moral— and arguably a state constitutional—problem. The issues are simple to understand. Is it fair that schools with our highest poverty students also have the poorest resources? Should schools that do not have suf-ficient resources to succeed be held accountable for goals that require success? Shouldn’t all students have a fair chance to succeed? These
questions are currently before the California courts in Williams v.
State of California, and it is important that state leaders step up to the plate and find a fair and equitable solution to the legal complaint out of court.
Moreover, the poor performance and often shaky financial con-dition of schools in even well off communities calls into question the fundamental adequacy of our school finance system across the board. To be fair, over the last seven years the state has attempted to address these problems by decreasing class size, providing money for teacher training, and holding schools accountable for student achievement. The result is that test scores have increased. But even with the gains, in the latest national assessments every group of our students (whites, Asian, Hispanic, and African American) fall below the national aver-age for similar groups in other states. A different approach is needed. Coming up with more effective solutions will be the central charge of the new bipartisan California State Quality of Education
Commis-vi California’s K–12 Public Schools: How Are They Doing?
sion. It is our hope that this and other studies will help the fledgling Commission square our school accountability system with a new fi-nance system that together provide the incentives and resources schools really need to help all California students meet the state per-formance standards.
vii
Preface
As recently as the 1970s, California’s public schools were considered to be among the nation’s best. Today, however, there is widespread recognition that the schools are no longer top performers. As a conse-quence, many Californians share a growing sense of alarm about the ineffectiveness of their public education system and the generation of children whose educational needs are not being met.
Researchers at the RAND Corporation examined California’s system of kindergarten through grade 12 (K–12) public schools on several dimensions, including student achievement and other student outcomes that schools may influence, as well as school finances, teachers, and facilities. Their goal was to describe the state of Califor-nia’s K–12 public schools, not to pinpoint why schools are in the shape they are or to advocate solutions (except where one seemed ob-vious from their findings). This descriptive report should be of inter-est to policymakers at the state and federal levels and to educators, especially in California. Parents may also benefit from the informa-tion it provides.
This research was conducted within RAND Education, a divi-sion of the RAND Corporation, with support from the William and Flora Hewlett Foundation. The statements made and views expressed are solely the responsibility of the authors.
ix
Contents
Foreword...iii
Preface...vii
Figures...xiii
Tables...xix
Summary...xxiii
Acknowledgments...xxxix
CHAPTER ONE Background, Scope, and Organization...1
This Study...2
K–12 Reforms in California...4
School Finance Reform...4
Class Size Reduction...5
Charter Schools...7
Vouchers and Open Enrollment...7
High-Stakes Testing and Accountability Systems...8
Report Overview...9
CHAPTER TWO Demographic Overview of California’s K–12 Public School Student Population...11
Historical Perspectives...11
Racial/Ethnic Diversity and Fluency in English...12
Age Composition...15
x California’s K–12 Public Schools: How Are They Doing?
Geographic Redistribution...18
School Enrollment...19
Access to Computers and the Internet...22
Conclusions...24
CHAPTER THREE California’s K–12 Public School Finances...27
Evolution of the Finance System...27
California K–12 Revenues...30
Sources of Public K–12 Revenues...30
Per-Pupil K–12 Revenues...34
Categorical Aid as a Share of K–12 Revenues...39
California K–12 School Expenditures...43
Per-Pupil Expenditures in K–12 Public Schools...44
K–12 School Spending on Various Categories...46
California’s K–12 Funding Capacity and Effort...49
Conclusions...54
CHAPTER FOUR California’s K–12 Public School Teachers...57
Teachers and Other Staff...57
Profile of Teachers...60
Teachers Without Full Credentials...62
Distribution of Teachers Without Full Credentials...67
Teacher Salaries...72
Pupil-Teacher Ratios...80
Conclusions...84
CHAPTER FIVE California’s K–12 Public School Facilities...89
Condition of Schools...92
Growth in Construction Expenditures...96
Financing of School Facilities...101
Contents xi
CHAPTER SIX California’s K–12 Public School Student Academic Achievement...109
Data Sources...110
California’s Statewide Testing Programs...110
National Assessment of Educational Progress (NAEP) ...113
Results from State Assessments, 1998–2003...117
SAT/9 Results, 1998–2002...117
CAT/6 Results, 2003...119
Performance of Students Disaggregated by Race/Ethnicity...120
Results from NAEP...122
Overall NAEP Scores...122
Performance of Students Disaggregated by Race/Ethnicity...125
Average State NAEP Scores and Family Characteristics...127
Scores for Students from Similar Families...132
Recent NAEP Score Gains...134
Average Gains Adjusted for Family Characteristics...136
California NAEP and SAT/9 Compared...139
Conclusions...140
CHAPTER SEVEN Other Indicators of Student Progress...143
Teenage Pregnancy...145
Background...145
Teenage Pregnancy in California and Other States...148
Substance Abuse...151
Background...151
Substance Abuse in California and Other States...152
Juvenile Delinquency...155
Background...155
Juvenile Delinquency in California and Other States...156
High School Graduation...158
Background...158
xii California’s K–12 Public Schools: How Are They Doing?
College Continuation...164
Background...164
College Continuation Rates in California and Other States...165
Conclusions...166
CHAPTER EIGHT Summary and Conclusions...169
Summary...169
Student Population...169
School Funding...171
Teachers...172
School Facilities...173
Student Achievement Outcomes...174
Other Indicators of Student Progress...175
Conclusions...175
APPENDIX A. Additional California Test Score Data and Analyses...177
B. Data and Methods Used to Describe Nonacademic Indicators...191
xiii
Figures
S.1. California’s K–12 Public School Per-Pupil Spending Relative to the National Average, 1969–1970 to
1999–2000...xxviii
S.2. K–12 Public School Spending as a Percentage of Personal Income, California and the United States,
1970 to 2000...xxix
S.3. Pupil-Teacher Ratios in K–12 Public Schools, California
and the United States, Fall 1969 to Fall 1999...xxxi
S.4. Cumulative Differences in Per-Pupil Construction Expenditures Between 1991–1992 and 1999–2000,
California and the United States...xxxii
S.5. Average State Performance on NAEP Reading and
Mathematics, Grades 4 and 8, 1990–2003...xxxiv
2.1. California’s Population, by Race/Ethnicity...13
2.2. Student Population Enrolled in California’s K–12
Public Schools, by Race/Ethnicity...14
2.3. California K–12 Public School Enrollment, 2003 Series...15
2.4. Selected Key Indicators of Child Well-Being, California
and the United States, 1990–2000...17
2.5. Percent Change in K–12 Enrollment, by County,
2002–2012...19
2.6. Computer and Internet Access at Home, United States,
1984–2000...23
2.7. Home Computer and Internet Use Among Children
xiv California’s K–12 Public Schools: How Are They Doing?
3.1. Sources of Public K–12 Revenues, California, 1977–1978
to 2001–2002...31
3.2. Sources of Public K–12 Revenues, United States,
1977–1978 to 2001–2002...32
3.3. Public K–12 Revenues from Federal, State, and Local
Sources, Five Most Populous States, 2000–2001...33
3.4. Revenues per Pupil, California, 1977–1978 to 2002–2003
(est.), and the United States, 1977–1978 to 2001–2002...35
3.5. Public K–12 Revenue per Pupil, by State, 2001–2002...38
3.6. Public K–12 Revenue per Pupil, Five Most Populous
States, 1990–1991 and 2001–2002 ...40
3.7. K–12 Proposition 98 Discretionary Spending Share,
1988–1989 to 2000–2001...41
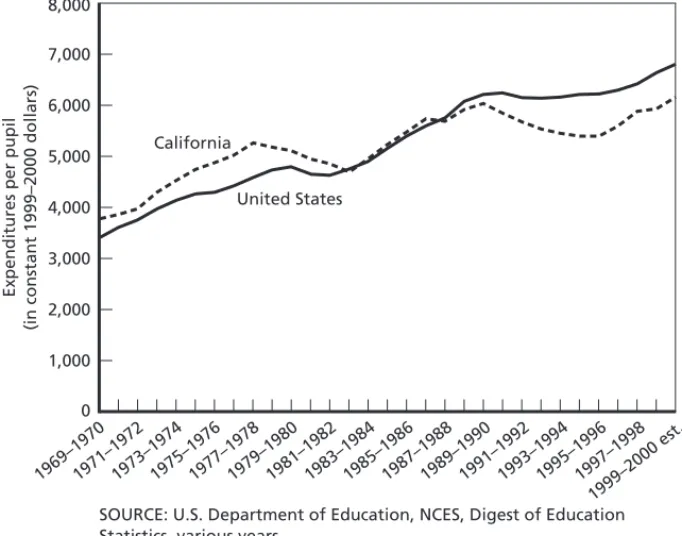
3.8. Current K–12 Public School Expenditures per Pupil, 1969–1970 to 1999–2000, California and the United
States...44
3.9. California’s K–12 Public School Per-Pupil Spending Relative to the National Average, 1969–1970 to
1999–2000...46
3.10. California’s K–12 Public School Per-Pupil Spending on Various Expenditure Categories, 1991–1992 and
1999–2000...47
3.11. Change in K–12 Public School Per-Pupil Spending Between 1991–1992 and 1999–2000, California and
the United States...49
3.12. Per Capita Personal Income, Five Most Populous States,
1999–2000...50
3.13. Relation of K–12 Public School Per-Pupil Spending to $1,000 Personal Income, Five Most Populous States,
1999–2000...51
3.14. K–12 Public School Per-Pupil Spending as a Percentage of Personal Income, California and the United States,
1970–2000...53
3.15. Per Capita Spending on Various State Functions,
Figures xv
4.1. Number of Teachers in California’s K–12 Public Schools,
Fall 1969 to Fall 2002...61
4.2. Percentage of First-Year Teachers in California, by
Credential Status...64
4.3. Gap Between Total Number of K–12 Teachers and Number of Fully Credentialed Teachers in California
Public Schools, 1991–1992 to 2002–2003...65
4.4. Distribution of California’s K–12 Public School Teachers Without Full Credentials, by Student Poverty Level,
1997–1998 to 2002–2003...70
4.5. Distribution of California’s K–12 Public School Teachers Without Full Credentials, by Percentage of Minority
Students, 1997–1998 to 2002–2003...72
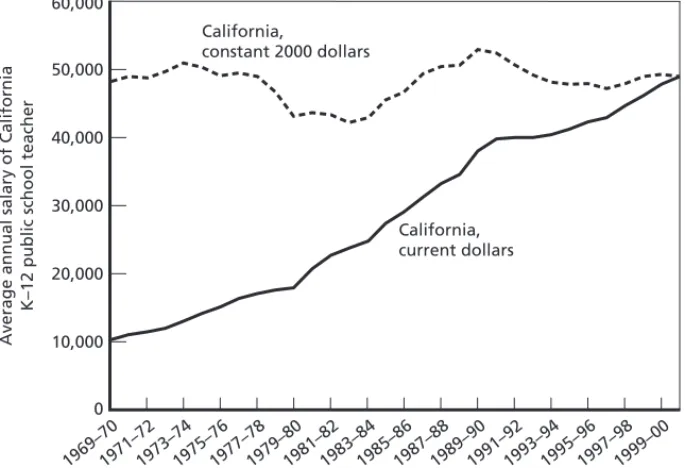
4.6. Average Annual Salaries of K–12 Public School Teachers,
California, 1969–1970 to 2000–2001...74
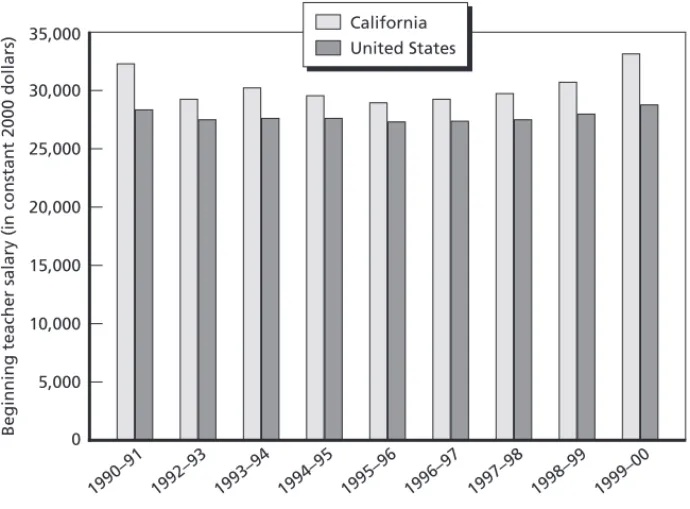
4.7. Beginning K–12 Public School Teacher Salaries, California and the United States, 1990–1991 to
1999–2000...77
4.8. Average K–12 Public School Teacher Salaries for Various Levels of Earned Degrees and Experience, California
and the United States, 1999–2000...79
4.9. Pupil-Teacher Ratios in K–12 Public Schools, California
and the United States, Fall 1969 to Fall 1999...82
4.10. Pupil-Teacher Ratios in K–12 Public Schools, California
Relative to National Average, 1969–1970 to 1999–2000...83
4.11. Median Pupil-Teacher Ratios in Public Primary, Middle, and High Schools, California and the United States,
2000–2001...84
4.12. Pupil-Teacher Ratios in K–12 Public Schools, Five Most Populous States, 1969–1970, 1979–1980, 1989–1990,
and 1999–2000...85
5.1. Percentage of K–12 Public Schools Reporting “Inadequate” Building Features, the West and the United States,
xvi California’s K–12 Public Schools: How Are They Doing?
5.2. Percentage of K–12 Public Schools Reporting “Inadequate” Environmental Factors, the West and the United States,
1994–1995 and 1999–2000...95
5.3. Percent Growth in K–12 Public School Construction Expenditures and Enrollment, United States, 1991–1992
to 1999–2000...97
5.4. Percent Growth in K–12 Public School Construction Expenditures and Enrollment, California, 1991–1992
to 1999–2000...98
5.5. K–12 Public School Construction Expenditures per Pupil, California and the United States, 1991–1992
to 1999–2000...99
5.6. Cumulative Differences in K–12 Public School Construction Expenditures per Pupil, California
and the United States, 1991–1992 to 1999–2000...100
5.7. Sources of Funds Raised for California’s K–12 Public
School Facilities, 1987–1988 to 1998–1999...103
5.8. California Voter Decisions on Statewide School Bonds,
1982 to 2002...104
5.9. California Voter Decisions on Local School Bonds,
1982 to 2002...105
5.10. Passage of Local Bond Measures in California Before
and After Proposition 39 Took Effect...106
6.1. California SAT/9 Scaled Scores, Mathematics, by Grade,
1998–2002...118
6.2. California SAT/9 Scaled Scores, Reading, by Grade,
1998–2002...119
6.3. Percentage of California Students Scoring At or Above the 50th National Percentile Rank on CAT/6,
Mathematics, by Race/Ethnicity, 2003...121
6.4. Percentage of California Students Scoring At or Above the 50th National Percentile Rank on CAT/6, Reading,
by Race/Ethnicity, 2003...122
6.5. Average State NAEP Scores, Reading and Mathematics,
Grades 4 and 8, 1990–2003...128
Figures xvii
6.7. Estimated Average NAEP Scores for Students from
Similar Families Across States...132
6.8. NAEP Gains for California and the United States, Mathematics and Reading, Grades 4 and 8,
1990–2003...136
6.9. California Students’ Annualized Gains on NAEP
and SAT/9 for Comparable Test Years...139
7.1. High School Graduation Rates, Five Most Populous
States, 1981–2000...160
A.1. CAP Mean Scaled Scores, Grades 3, 6, and 8,
Mathematics...179
A.2. CAP Mean Scaled Scores, Grades 3, 6, and 8,
Reading...180
A.3. Average State NAEP Scores, Grades 4 and 8,
Mathematics, 1990–2003...185
A.4. Average State NAEP Scores, Grades 4 and 8,
Reading, 1992–2003...185
A.5. Average State NAEP Scores, Grade 4, Reading and
Mathematics, 1992–2003...186
A.6. Average State NAEP Scores, Grade 8, Reading and
Mathematics, 1990–2003...186
A.7. Estimated Average NAEP Scores for Students with
Similar Families, Mathematics...187
A.8. Estimated Average NAEP Scores for Students with
Similar Families, Reading...187
A.9. Estimated Average NAEP Scores for Students with
Similar Families, Grade 4...188
A.10. Estimated Average NAEP Scores for Students with
xix
Tables
2.1. Number and Percentage of Related Children Under Age 18 in Poverty in 2000, by Family Type, California and the
United States...16
2.2. Projected California Public K–12 Enrollment, by County
and School Year...20
2.3. School Enrollment in 2000 for Children Ages 3–17,
California and the United States...22
3.1. Comparative Summary of California's K–12 Public School
Finances...55
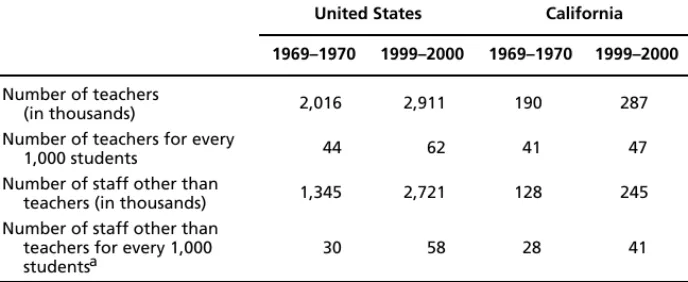
4.1. Teachers and Other Staff in K–12 Public Schools, United
States and California, 1969–1970 and 1999–2000...58
4.2. K–12 Public School Teachers Without Full Credentials, by
Assignment Area, 1997–1998 and 2002–2003...68
4.3. Percentage of Public School Districts Requiring Various Teacher Qualifications When Considering Teacher
Applicants, California and the United States, 1999–2000...73
4.4. Average K–12 Public School Teacher Salaries, Adjusted and Unadjusted, Five Most Populous States and United States,
1999–2000...80
4.5. Summary of Outcomes for California’s K–12 Public School
Teachers...87
5.1. Amount by Which California Trails the Four Other Most Populous States in K–12 Public School Construction
xx California’s K–12 Public Schools: How Are They Doing?
5.2. Summary of Outcomes for California’s K–12 Public
School Facilities...108
6.1. California’s Participation in the NAEP, 1990–2003...114
6.2. Average Percentage of California Students Scoring At or
Above the 50thNational Percentile, 2003...120
6.3. Student Performance on NAEP, Difference Between the United States and California and Difference Between Each of the Four Other Most Populous States and California,
Mathematics...123
6.4. Student Performance on NAEP, Difference Between the United States and California and Difference Between Each of the Four Other Most Populous States and California,
Reading...124
6.5. Student Performance on NAEP, Difference Between the United States and California and Difference Between Each of the Four Other Most Populous States and California,
Disaggregated by Race/Ethnicity, Mathematics...125
6.6. Student Performance on NAEP, Difference Between the United States and California and Difference Between Each of the Four Other Most Populous States and California,
Disaggregated by Race/Ethnicity, Reading...126
6.7. Demographic and Economic Statistics for California, 1990
and 2000, and California’s National Ranking, 2000...130
6.8. Estimated Annual Gains in NAEP for the Five Most Populous States, Mathematics and Reading, 1990–2003,
and Mathematics Only, 1990–2003...137
7.1. Annual Pregnancy Rates Across Racial/Ethnic Groups,
United States (per 1,000 15–17 year old females) ...146
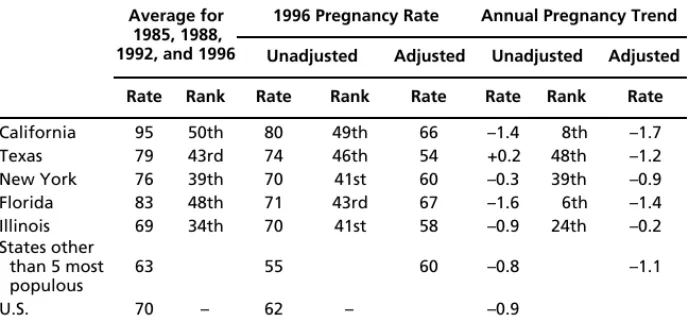
7.2. Actual and Adjusted Pregnancies, Five Most Populous
States (per 1,000 15–17 year old females) ...149
7.3. Annual Change in Actual and Adjusted Births, Five Most Populous States, 1990–2000 (per 1,000 15–17 year old
females) ...150
7.4. Teenage Substance Abuse in California, 1999–2000...154
7.5. Substance Abuse Rates of 12–17 Year Olds, the Five
Tables xxi
7.6. Juvenile Arrests for Property and Violent Crimes, 2000
(per 10,000 10–17 year olds) ...157
7.7. Annual Percent Change in Rates of Juvenile Arrests for
Property and Violent Crimes, 1994–2000...159
7.8. Actual and Adjusted High School Graduation Rates for 2000, and Annual Trends...161
7.9. Graduation Rates and Rankings, Five Most Populous States and Six Largest California School Districts, 1998...163
7.10. College Continuation Rates, 1992–2000 Biennial Data...165
7.11. Summary of Outcomes on Other Indicators of Progress for
California Students...167
A.1. Estimated National Percentile Rank of the Median
California Third Grader, Reading, 1967–1986...181
A.2. Average Percentage of California Students Scoring At or Above the 50thNational Percentile, Mathematics,
1998–2002...182
A.3. Average Percentage of California Students Scoring At or
Above the 50thNational Percentile, Reading, 1998–2002...183
B.1. Adolescent Substance Abuse Rates Across Racial/Ethnic
xxiii
Summary
As recently as the 1970s, California’s public schools were reputed to be excellent. Today, that reputation no longer stands. Instead, there is widespread concern that California’s schools have slipped in quality over the years and that they are no longer performing as well as they did previously or as well as schools in other states.
The primary objective of our study was to look closely at Cali-fornia’s public system of kindergarten through twelfth grade (K–12) schools in order to provide an accurate, comprehensive picture of the system as it is today. We describe in this report the student popula-tion and the schools’ resources, including their financial resources, teachers, and facilities. We also describe the schools’ outcomes, ini-tially focusing on student academic achievement as measured by standardized tests, and then turning to other outcomes that may be influenced by schools and are not adequately captured in test scores. These include both educational attainment measures—high school graduation and continuation on to college—and a variety of non-academic measures—teenage pregnancy, substance abuse, and juve-nile delinquency—on the grounds that the purpose of schooling goes beyond academic achievement to include students’ broader prepara-tion for adult success and citizenship.
In looking at the student population, the resources, and the various outcomes, we also analyzed trends and compared California with other states and to the nation as a whole as much as the data would allow. In some cases, the data allowed us to focus broadly on the schools since the 1970s; in other cases, however, the available data
xxiv California’s K–12 Public Schools: How Are They Doing?
limited our analyses. For example, we were able to analyze academic achievement trends only for students through eighth grade and only since 1990, because there are no appropriate data on academic achievement for high school students or for years prior to 1990.
Where the data would allow, we also compared trends and pat-terns in California to trends and patpat-terns in the four states that are comparable to California in that they had the largest populations of 5–18 year olds (presumably K–12 students) in the nation in 2000. After California, which ranks first in number of school-age children, these four other “most populous” states are Texas, New York, Flor-ida, and Illinois.
K–12 Reforms in California
To place the study in context, we discuss various educational reforms that California has considered and either adopted or rejected. These reforms include school finance reform, class size reduction, charter schools, voucher programs, and California’s standards and assessment system. The discussion is intended to provide information on what California has or has not done to reform its K–12 public schools and to serve as a backdrop for the trends reported.
California was the first state to implement comprehensive school finance reform. When it did so, nearly 30 years ago, spending per pupil became significantly more equal across California school dis-tricts. However, this reform may also have contributed to lower levels of spending on average, which led to larger class sizes in California’s K–12 public schools.
In 1992, California became the second state to enact charter school legislation. As of the 2002–2003 school year, the state’s 452 charter schools served about 2.5 percent of all public school students. In fact, California ranks fifth among all states for the highest percent-age of public school students enrolled in charter schools.
Two efforts to provide vouchers for private schools, ballot initia-tives in the 1993 and 2000 elections, failed. Neither was able to cap-ture more than one-third of the votes in California.
Summary xxv
In 1996, California enacted a popular voluntary program to re-duce class sizes for grades K–3 and 9. Although this program clearly succeeded in reducing class sizes in grades K–3, the reductions came at substantial expense, and the evidence is mixed on whether the pro-gram has improved students’ academic achievement. An unintended consequence of this effort was that the state hired many teachers lacking certification in order to meet the requirements for smaller class sizes. In addition, other programs were cut to pay for the addi-tional teachers and to provide the extra classrooms needed. And classes in the nontargeted grades remained large. Finally, despite the class size reduction program, in 2001 California still had the second highest ratio of pupils to teachers in the nation.
California legislated an accountability system in the Public School Accountability Act (PSAA) of 1999. California now tests stu-dents in more grades than most states do, but other states test in more subjects and have more-varied types of questions.
California Demographics
California is among the most racially and ethnically diverse states, and racial/ethnic diversity is especially evident among California’s youth. Moreover, the racial/ethnic distribution of the state’s youth population is rapidly changing. The available data identify K–12 public school enrollments by race/ethnicity for four groups. They show that enrollments are presently 45 percent Hispanic, 34 percent Anglo (non-Hispanic white), 12 percent Asian and other (with “other” being mostly Filipino but also including “Asian and Pacific Islander” and a small number of American Indian), and 8 percent black. The earliest comparable data show that in 1987–1988 (15 years earlier), these percentages were 30 percent Hispanic, 50 percent Anglo, 11 percent Asian and other, and 9 percent black. It is likely that by 2012–2013, the majority of California public school children will be Hispanic.
Furthermore, nearly one in every ten Californians is a recent immigrant—i.e., a foreign-born person who entered the United
xxvi California’s K–12 Public Schools: How Are They Doing?
States within the past ten years. By comparison, not even one in 20 persons nationally is a recent immigrant. Consequently, California has an abundance of English learners and linguistically isolated households, both of which are disparities that heighten educational costs for affected school districts—English learners by imposing spe-cialized and/or higher per capita staffing needs, and linguistic isola-tion by hampering two-way communicaisola-tion between schools and parents.
California has within its borders 12.8 percent of the nation’s school-age population but only 11.8 percent of the nation’s adult population—i.e., potential taxpayers. This means that California tax-payers shoulder disproportionate responsibility for persons of school age.
About one of every five children in California lives in a family whose income is below federally established poverty thresholds. Of the children in California who live in single-mother families, 39.7 percent live in poverty; the corresponding proportion for children living in married-couple families is 12.9. Furthermore, California, at 29.6 percent, trails the nation in the percentage of children living in high-poverty neighborhoods and currently displays a worsening trend.
Child poverty is most prevalent in a handful of counties in Cali-fornia’s Central Valley (e.g., Tulare, Fresno, and Madera counties). The level of child poverty places several of these counties among the poorest tenth of the nation’s 3,142 counties. Moreover, the continu-ing geographic redistribution of population within the state will am-plify public school enrollment growth in these counties and in coun-ties around Los Angeles. Inevitably, schools in these areas will be particularly strained by enrollment pressure, staffing needs, and the crowding of existing facilities.
School Funding
California has fundamentally transformed its system of public school finance. In 1970, public education in California was primarily locally
Summary xxvii
financed. School districts set their own local property tax rates, sub-ject to the approval of the voters. Districts raised more than half of their total revenues by taxing local property. Now, however, the state controls the vast majority of school district revenues. The school dis-tricts currently have few options for raising their own funds. Further, a growing share of education dollars is being distributed as categori-cal, or restricted, aid, as opposed to “revenue limit,” or general pur-pose, aid. These trends have raised concerns about a decline in local discretion.
Proposition 13, passed by California voters in 1978 (combined with Proposition 98, approved by California voters in 1988), has had significant consequences for K–12 public education funding. In gen-eral, K–12 real revenues and expenditures per pupil grew fairly rap-idly in California and the United States until the early 1980s, and California’s per-pupil spending largely tracked that of the United States. But California fell well behind the other states in the late 1980s. Beginning in the mid-1990s, California steadily added to its education funding, as did other states, with an estimated real growth of 27 percent between 1994–1995 and 2001–2002. However, after several years of more positive finances, California’s schools are again confronting the challenges that go with severe budget constraints.
Figure S.1 shows California per-pupil expenditures relative to the national average. As can be seen, spending per pupil went from about $400 above the national average in 1969–1970 to more than $600 below the national average in 1999–2000. Despite recent funding increases for K–12 education, California schools have con-tinued a decade-long pattern of spending well below the national av-erage per student.
California has a relatively high capacity to fund its schools (as measured by per capita personal income) compared with its “effort.” Figure S.2 shows public school spending as a percentage of personal income. In the early to mid-1970s, California spent about the same share of its personal income on public education as the rest of the country did, about 4.5 percent. However, in the late 1970s, the share of personal income that Californians devoted to their public schools
xxviii California’s K–12 Public Schools: How Are They Doing?
Figure S.1
California’s K–12 Public School Per-Pupil Spending Relative to the National Average, 1969–1970 to 1999–2000
SOURCE: U.S. Department of Education, NCES, Digest of Education Statistics, various years.
200
0
–200
–400
–600
–800 800
–1,000
Per-pupil expenditures relative to national average (in constant 1999–2000 dollars)
1997– 1998 1995–1996 1993
–1994 1991–1992 1989–1990 1987–
1988 1985–1986 1983
–1984 1981–1982 1979–1980 1977
–1978 1975–1976 1973–1974 1971–1972
1969–1970 1999–2000estimate
400 600
RAND MG186-S.1
fell to about 1.2 percentage points below the national average and remained well below the national average through 2000.
How does California spend its school budget? Education, espe-cially K–12 education, is labor intensive. About 85 percent of all K–12 expenditures are devoted to personnel salaries and benefits, and close to 40 percent of all expenditures are devoted to teacher salaries and benefits.
Compared to other states, California saw relatively large dollar growth in its school districts’ spending on instructional items other than teacher salaries—such as supplies, materials, and contractual services for regular, special, and vocational programs—and on school administration over the 1990s. California per-pupil spending on
Summary xxix
Figure S.2
K–12 Public School Spending as a Percentage of Personal Income, California and the United States, 1970 to 2000
1.0 0.5 5.0
0
Public school spending as a percentage
of personal income
1998 1996 1994 1992 1990 1988 1986 1984 1982 1980 1978 1976 1974 1972
1970 2000
3.0 2.5 2.0 1.5 4.5
RAND MG186-S.2
SOURCE: U.S. Bureau of Labor Statistics, and U.S. Department of Education, NCES, Digest of Education Statistics, various years.
California United States
4.0 3.5
pupil support and general administration has fallen by relatively large dollar amounts compared with spending in other states and repre-sents a relatively small share of total spending.
Teachers
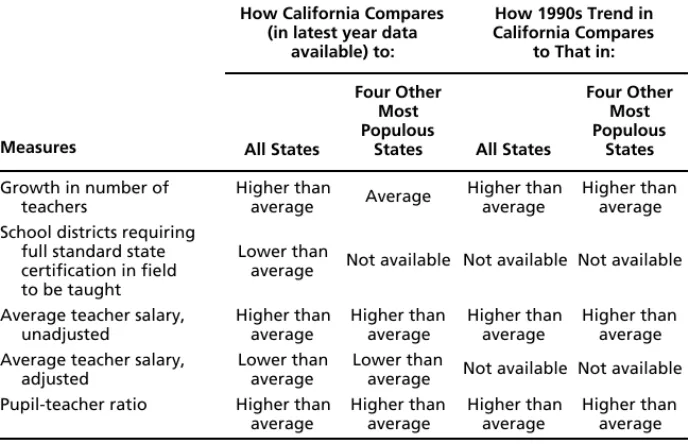
In 1999–2000, California employed 287,000 K–12 teachers, who were paid an average salary of $47,680. Real annual teacher salaries in California in 2000–2001 were on average about the same as they were in 1969–1970, and salaries had remained relatively flat over time. California’s average annual teacher salaries have consistently placed California’s teachers in the top ten in the nation over time in terms of absolute salaries. If the dollars are adjusted to reflect
pur-xxx California’s K–12 Public Schools: How Are They Doing?
chasing power, however, California’s teacher salaries are actually lower than the national average. The adjusted average annual salary of $38,845 places California last among the five most populous states and 32nd nationwide.
Figure S.3 displays the pupil-teacher ratios in California and the United States for the past 30 years. Until 1979, these state and na-tional ratios largely tracked each other. In the late 1970s, however, California’s pupil-teacher ratio grew, and it remained well above the national average through the 1980s and the early and mid-1990s. In the 1996–1997 school year, California’s pupil-teacher ratio began to fall as a reflection of Senate Bill 1777, which was passed in July 1996 to promote class size reduction and provided $650 per student for
each K–3 classroom with 20 or fewer students.1
Currently, California continues to have the second highest ratio of students per teacher of any state, about 20.9 students to one teacher. The current U.S. average is 16.1.
As a group, California’s public K–12 teachers are formally trained, state-certified professionals. However, by 1999–2000, newly employed teachers made up a substantial portion of the teacher workforce—about 15 percent—and the majority of these new teach-ers were not formally trained and state-certified. In particular, the 1990s saw a growth in those coming into teaching by way of pre-internships, pre-internships, and emergency permits. As a result, the gap between the demand for teachers and the supply of fully credentialed teachers widened over the 1990s.
Teacher qualification requirements are generally lower in Cali-fornia than in other states. For example, 82 percent of school districts in the United States require full standard state certification in the subject to be taught, compared with 46 percent of districts in Cali-fornia. Teachers in California who have not completed all require-ments for a credential are concentrated in urban schools, the lowest performing schools, and schools with high percentages of low-income and minority students.
____________
Summary xxxi
Figure S.3
Pupil-Teacher Ratios in K–12 Public Schools, California and the United States, Fall 1969 to Fall 1999
10
5 30
0
Pupil-teacher ratio
1997 1995 1993 1991 1989 1987 1985 1983 1981 1979 1977 1975 1973 1971
1969 1999
25
20
15
RAND MG186-S.3
SOURCE: U.S. Department of Education, NCES, Digest of Education Statistics, various years.
United States California
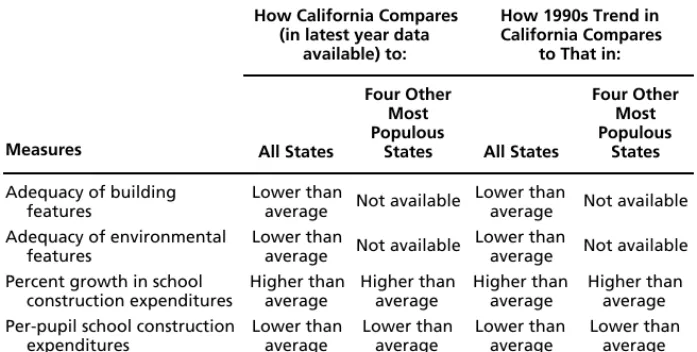
School Facilities
Concerns about K–12 public school facilities in California mirror those at the national level. A national study conducted in 1995 sug-gested that school facilities had reached the breaking point and that many schools in California were in especially bad condition. Per-pupil construction expenditures in California fell behind those of the United States—ranging from about $5 per pupil below in 1997 to about $235 per pupil below in 1995. Figure S.4 shows the differences in per-pupil construction expenditures between California and the United States when the annual differences between 1991–1992 and 1999–2000 are added up. Adding these differences together shows
xxxii California’s K–12 Public Schools: How Are They Doing?
Figure S.4
Cumulative Differences in Per-Pupil Construction Expenditures Between 1991–1992 and 1999–2000, California and the United States
Cumulative amount by which California per-pupil construction expenditures fell below those of
United States (in constant 2000 dollars)
1991–92 to 1997–98 1991–92 to
1996–97 1991–92 to
1995–96 1991–92 to
1994–95 1991–92 to
1993–94 1991–92 to
1992 –93
1991–92 to 1998–991991–92 to1999–00 1991–92
–100
–200
–300
–400
–500 0
–1,000 –600
–700
–800
–900
RAND MG186-S.4
SOURCE: U.S. Census Bureau, Public Education Finances, various years.
that cumulative California per-pupil spending on construction came to about $890 less per pupil than the national average over that period.
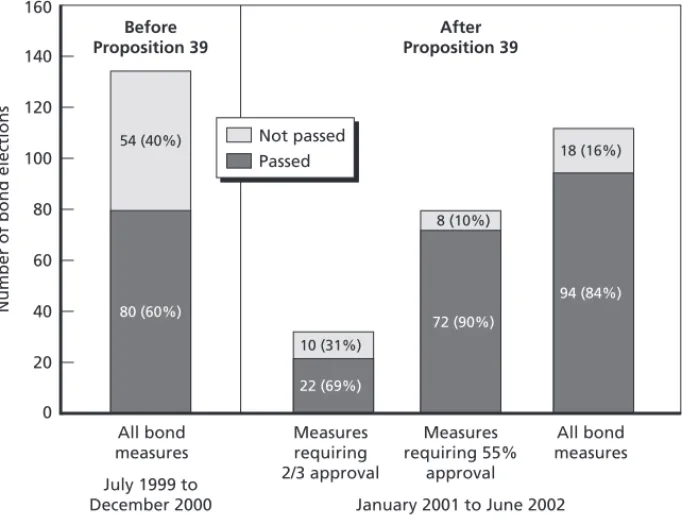
California has made progress in addressing K–12 facility needs, largely due to voter approval of several large state general obligation bonds and a variety of legislative changes that have enabled districts to approve local general obligation bonds. In 2002 alone, voters ap-proved the issuance of over $11 billion in state bonds and close to $10 billion in local bonds. The recent passage of Proposition 39 sug-gests that progress will continue to be made in addressing the state’s facility needs.
Summary xxxiii
However, even with this progress, California still lags the nation and the other large industrial states in terms of the adequacy of the school buildings’ environmental and other features, and per-pupil construction expenditures. These inadequacies are concentrated in central cities serving high minority and low-income populations, as well as in rural areas. The court decisions that lessened the financial disparities between low- and high-income districts have pertained primarily to the state’s role in providing for instruction, not build-ings. The past 25 years have seen a general increase in the state’s in-volvement in facilities-related matters; but districts still contribute to facilities costs, and the extent to which state funding will address the differences between districts is not yet clear.
Student Academic Achievement
A variety of standardized tests have been administered in California. The longest running statewide testing program was the California Assessment Program (CAP), which began in 1973 and ended in 1992. The most recent assessment program, Standardized Testing and Reporting (STAR), continues to collect standardized test score data.
The raw data from California’s CAP test are no longer available, making it impossible to track student performance from the begin-ning of statewide testing in California. A California Department of Education publication in 1986 provided some historical data on stu-dent performance in California relative to that in the nation, but these comparative analyses of early California state test scores rely on a set of outdated national norms from several different publishers and are therefore unreliable.
The only assessment that allows for reliable comparative analyses of student academic achievement among states is the National As-sessment of Educational Progress (NAEP), a national test adminis-tered in all states. Figure S.5 shows the ranking of states by average performance on NAEP tests between 1990 and 2003 (the NAEP scores have been converted to standard deviation units). The data
xxxiv California’s K–12 Public Schools: How Are They Doing?
Figure S.5
Average State Performance on NAEP Reading and Mathematics, Grades 4 and 8, 1990–2003
.3 .2 .1 –0 –.1 .5
–.4
Standard deviation units
.4
–.2 –.3
RAND MG186-S.5
VTNDMAMNNHIASDMECTMTWINENJKSINILWYOROHIDVACOUTMOMIAKWAPANYNCTXMDOKRIDEKYWV FL GA SC TN
AZ ARNVHINMALCA MSLA
Illinois
New York Texas
Florida
California
show that California performs at the bottom end of the distribution of states, just above Louisiana and Mississippi. Also depicted in the figure are the average NAEP scores for the four other most populous states. As can be seen, California falls well below these states in stu-dent performance.
Our analyses of NAEP scores show the following:
• California NAEP scores are significantly lower than the average scores in the nation and are the lowest scores of the five most populous states.
• California’s low NAEP scores cannot be accounted for by the state’s high percentage of minority students. When students’ family backgrounds are controlled for, California’s scores are the lowest in the nation (–0.18 standard deviations below the mean). This suggests that California’s low scores must be in
Summary xxxv
some part a result of the schools, rather than simply a result of family characteristics in the state.
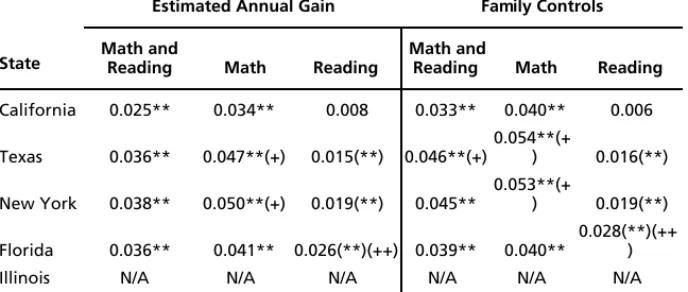
California is making gains in NAEP scores. California’s scores on the 2002 reading test and the 2003 mathematics and reading tests show some relative progress. California’s rank using the average score across the 2002 and 2003 NAEP is 45th out of 50 states. California’s rank over the period 1990 to 2002 was 48th out of 50 states. This increase in relative standing can be attributed to the large gains made on the 2003 grade 4mathematics NAEP. Between 1996 and 2003, California gains in grade 4 mathematics scores were larger than the gains made in the nation and by any of the four other most populous states. While this is promising, California is still the lowest scoring of the five most populous states.
Other Indicators of Student Progress
Academic achievement is only one measure of how well schools are serving California’s young people. Schools can influence (with health education, counseling, and after-school programs, for example) edu-cational attainment outcomes such as high school graduation and college continuation, as well as behavioral outcomes, such as teenage pregnancy, substance abuse, and juvenile delinquency.
Relative to other states, California has a low rate of students continuing on to college, but California’s trends for high school graduation are favorable compared to those of other states.
The average pregnancy rate for 15–17 year olds is higher in Cali-fornia (9.5 percent per year) than in any state except the District of Columbia. However, the teenage pregnancy rate is declining faster in California than in most states, even when racial/ethnic differences are adjusted for.
California teenagers compare favorably to teenagers in other states with respect to cigarette and alcohol use and property crime arrests. And when the racial/ethnic composition of the states is ad-justed for, California keeps its strong marks, retaining its low rates of
xxxvi California’s K–12 Public Schools: How Are They Doing?
cigarette and alcohol use and property crime arrests, and it ranks well with respect to arrests for violent crimes as well.
Conclusions
Californians were once proud of their state’s public K–12 education system, but there have been signs in the last few decades that the sys-tem has slipped badly relative to its own past performance and that of other states’ school systems. We found reason to be concerned about California’s public K–12 schools. The results are not uniformly dis-couraging; California’s schools compare favorably to those in other states in some respects. But overall, the comparisons are unfavorable to California more often than not. And in many instances, the results support the impression that California’s relative standing in the na-tion has declined over the last three decades, and especially since the finance reform legislation in the 1970s.
California’s demography presents extraordinary challenges to public education and it may be the case that these challenges cannot be effectively met unless the state’s K–12 system is funded at rela-tively high levels. However, California school districts have experi-enced comparatively low levels of funding compared to funding in most other states. California’s schools have been further stressed by extreme fluctuations in real spending per pupil. These relatively low funding levels in California’s K–12 schools reflect comparatively low effort relative to the state’s capacity.
The comparatively low funding afforded K–12 public education in California can be seen in the resources the schools are able to make available to their students. A substantial portion of the state’s teachers are not fully qualified and state certified. California continues to have the second highest pupil-teacher ratio of any state. And despite sub-stantial progress in dealing with school facilities over the past 10 years, California continues to lag the nation in addressing K–12 facility needs.
The combination of a student population with relatively great needs, relatively low funding levels, and relatively inadequate
re-Summary xxxvii
sources may have contributed to California’s comparatively low levels of student academic achievement. California NAEP scores are at the bottom of the distribution of participating states; California’s minori-ties’ scores are particularly low. There is, however, a bright spot: Cali-fornia is making statistically significant annual gains in mathematics scores.
California students’ nonacademic outcomes present a mixed pic-ture. California lags other states in terms of high school graduation rates but is catching up. California generally lags other states in col-lege continuation and is falling further behind. Teenage pregnancy rates are much higher in California than in most other states, but they are rapidly decreasing. And California is roughly similar to other states in the rates of substance abuse and teenage crime arrests.
xxxix
Acknowledgments
We are grateful to the William and Flora Hewlett Foundation, and particularly to Marshall Smith, for supporting this work.
We are greatly indebted to RAND Education colleagues Brian Gill, Cassandra Guarino, Sue Bodilly, and Sheila Kirby, who carefully reviewed earlier drafts of this report and whose comprehensive and constructive criticism improved the final product immensely. We also thank RAND Research Communicator Shelley Wiseman, who worked closely with the authors. Finally, we are grateful to Mary Wrazen in RAND’s Publications Department and to Christopher Dirks for improving the presentation of the material in this report.
1 CHAPTER ONE
Background, Scope, and Organization
Californians were once proud of their state’s public kindergarten through twelfth grade (K–12) education system, but in the last few decades they have seen signs that the system may be slipping relative to other states’ systems and to its own past performance. Both policy-makers and the general public have voiced serious concerns about the condition and performance of California’s schools.
In 1999, the California legislature evidenced the extent of these concerns when it passed California Senate Concurrent Resolution
29,1 which established a joint committee to develop a “Master Plan
for Education for California.” The resulting Plan, published in
2003,2 addresses all levels of education in California: preschool,
K–12, adult, and postsecondary. However, the committee was clearly primarily concerned with the performance of the state’s K–12 system. The Introduction to the Master Plan observes: “The sobering reality of California’s education system is that too few schools can now pro-vide the conditions in which the state can fairly ask students to learn to the highest standards, let alone prepare themselves to meet their
future learning needs.”3 The Introduction then goes on to list facts
about the educational performance of the California system, most of ____________
1Senate Concurrent Resolution No. 29, Statutes and Amendments to the Codes, Chapter 43, filed with Secretary of State, May 27, 1999.
2See http://www.sen.ca.gov/masterplan.
3http://www.sen.ca.gov/ftp/sen/committee/joint/master_plan/_home/020909_final_master_ plan_documents/020909_final_mp_intro.pdf, p. 1.
2 California’s K–12 Public Schools: How Are They Doing?
which pertain more specifically to the effectiveness of the K–12 system. It concludes: “These data are indicative of the huge gap that exists between what many Californians need from their educational
system and what they are actually receiving.”4
California policymakers and educators are also increasingly con-cerned about the state of California’s public schools in light of federal legislation called the No Child Left Behind Act of 2001 (NCLB). NCLB emphasizes accountability based on student test results, estab-lishes minimum standards for teacher quality, and imposes sanctions on states and districts that fail to comply with NCLB requirements.
This Study
The study presented in this report describes California’s current K–12 public education system. Our objective is to provide informa-tion to those concerned with the system. We focus broadly on Cali-fornia schools, grades K–12, analyzing trends within CaliCali-fornia and comparing California’s system with those of other states. We use data from the 1970s onward when they are available, and from more re-cent years when the data available do not go back that far (e.g., the data on racial/ethnic makeup enrollments only go back to 1987). Thus, for example, we analyze achievement trends only for K–8 stu-dents and only from 1990 on, because no appropriate data on achievement exists for high school students, and the data on achieve-ment for K–8 students goes back no further than 1990.
We generally compare California to the nation as a whole and, when the available data are sufficient, we compare California with the four other states that had the largest populations of 5–18 year olds (presumably, students in grades K–12) in 2000. The five states with the largest numbers of school-age children, which we refer to throughout this report as the “most populous” states, are, in order: California, Texas, New York, Florida, and Illinois. In some cases, ____________
4http://www.sen.ca.gov/ftp/sen/committee/joint/master_plan/_home/020909_final_master_ plan_documents/020909_final_mp_intro.pdf, p. 3.
Background, Scope, and Organization 3
however, depending on the topic and the data available, we also make comparisons with additional states.
California’s distinctive demographic situation presents extraor-dinary challenges to the state’s public education system. Accordingly, we begin with a description of California’s student population, ex-tending our view as far back historically as the data permit—to pro-vide racial/ethnic and language breakdowns, as well as levels of immi-gration and within-state mobility.
We then describe the inputs, or resources, the state has made available to meet students’ educational needs. We consider a variety of finance issues: expenditures per pupil, sources of school funding, and the distribution of expenditures among major expenditure cate-gories. We also consider two other major categories of resources— teachers and facilities. We describe California’s teaching force, in-cluding indicators of teacher qualifications; we also consider non-teaching professional staff—librarians, counselors, etc. With respect to facilities, we explore the status of California’s K–12 facilities and capital funding, as far as the available data allowed.
Next, we turn to students’ academic achievement. We examine achievement in California as measured by the National Assessment of Educational Progress (NAEP), broken down by both subject area and student characteristics (e.g., race/ethnicity).
To account for the fact that the purposes of schooling go be-yond educational achievement to include children’s broader prepara-tion for adult success and citizenship, we then examine other impor-tant indicators of students’ progress that may be influenced by schools. These include both educational attainment measures—the percentage of high school seniors who graduate and the percentage of high school seniors who go on to attend college—and nonacademic measures—substance abuse, teenage pregnancy, and the incidence of school and adolescent crimes. In all of these analyses, we attempt to put California’s current K–12 system into perspective. We compare it with the systems of all other states and, in particular, with the systems of the four other most populous states, along each of the dimensions listed above. And, to the extent the available data allow, we examine
4 California’s K–12 Public Schools: How Are They Doing?
changes over time in California, again along each of the dimensions listed above.
K–12 Reforms in California
To place the study in context, we review the various educational re-forms that California has considered and either adopted or rejected: school finance reform, class size reduction, charter schools, voucher programs, and California’s standards and assessment system. This discussion is intended to inform the reader about what California has and has not done to reform its schools and to provide context for the trends reported here.
School Finance Reform
School finance reform in California began in 1971, when the consti-tutionality of California’s school finance system was challenged in the
Serrano v. Priest case. The California Supreme Court agreed with the Serrano plaintiffs that the large differences in school spending per pupil across districts based on differences in per-pupil property values violated the equal protection clause of the Fourteenth Amendment. In a series of related decisions, the California legislature limited both how much school district revenues related to property wealth could vary from district to district and how much money school districts would be allowed to raise. Low-wealth districts were allowed to in-crease per-pupil spending at a greater rate than were high-wealth dis-tricts, thereby allowing the former to “catch up” to the state average over time.
In 1978, California’s Proposition 13 limited property tax rates to 1 percent and capped annual increases in the property taxes levied
on a given property.5 In response, the California legislature passed
Assembly Bill (AB) 8, under which the state took control of school district funding. In the following academic year, the percentage of ____________
Background, Scope, and Organization 5
school funding coming from the state government increased from 32 to 62 percent; in 1979–1980, it increased to 71 percent. (See Figure 3.1 in Chapter Three.)
After these developments in California, litigation challenging the constitutionality of local funding for public schools arose in 42 other states. By 1999, the school finance systems in 19 of the 42 states were overturned (Evans, Murray, and Schwab, 2001). Many of these states’ legislatures followed with equalization efforts, which often in-cluded a shift in spending from local sources to the state.
Evidence suggests that the state has equalized resources across school districts so that students in low-wealth districts are at less of a disadvantage in terms of spending per pupil than they were before. At the same time, research suggests that the new laws have had un-intended consequences. First of all, because resources were being equalized across districts, California voters had less incentive to spend as much on public schools, which contributed to a significant decline in school spending relative to that in other states. And this decline in spending likely led to the greater class sizes and, perhaps, the poor achievement levels for students in California compared to students across the nation.
Class Size Reduction
In 1994, in response to the poor performance of California’s stu-dents, the California Department of Education convened a task force to suggest reforms. Among the suggestions was a reduction in class sizes, which at the time averaged 29 students per class for elementary students. This was the largest pupil-teacher ratio in the country (Bohrnstedt and Stecher, 2002a).
In July 1996, the California legislature passed and Governor Pete Wilson signed Senate Bill (SB) 1777, which provided $650 per student for each K–3 classroom with 20 or fewer students. The incen-tive was later increased to $800 per student. The legislation also allot-ted money to build 8,000 additional classrooms as part of a one-time provision. The program cost the state about $1 billion the first year and now costs about $1.6 billion per year (Bohrnstedt and Stecher,
6 California’s K–12 Public Schools: How Are They Doing?
2002a). A less extensive program, established in 1998, offered $135 per ninth grader in courses averaging 20 or fewer students.
According to Bohrnstedt and Stecher (2002b), at least 27 states have laws that make reduced class sizes mandatory or voluntary (typi-cally through incentives). Of these, 13 states had passed legislation to reduce class sizes before California did, and eight had mandatory stipulations. California’s CSR program was voluntary, but the mone-tary incentives were initially strong enough to be nearly as effective as a mandate.
Bohrnstedt and Stecher (2002a) found that the implementation of California’s CSR program was fairly rapid except in low-income schools, for which the supply of qualified teachers and available class-rooms was inadequate. By the 2000–2001 school year, over 95 per-cent of K–3 teachers taught in reduced-size classes.
California’s CSR program did have several significant un-intended effects. First of all, it created a windfall for schools with fewer minorities and lower percentages of low-income students. The windfall gains to these schools created more inequality in school funding, counteracting to some extent the redistributive efforts of the state’s school finance reform. Second, teacher quality, as measured by teacher experience and credentials, decreased, and the gap in the per-centage of teachers who were credentialed between low-income and high-income schools grew larger over a few years (Bohrnstedt and Stecher, 2002a). Third, many schools transferred classroom space and money from other programs to help meet the CSR criteria (Bohrnstedt and Stecher, 2002a). Resources and classroom space were reported as having been cut in, among others areas, special education, music and arts, athletics, childcare programs, teacher professional development, libraries, and even facility maintenance.
Overall, California’s CSR program was one of the largest in the nation in terms of how many schools and classrooms were affected. However, California’s class size reduction efforts were intended to make up for the fact that California had the largest classes in the country.
Background, Scope, and Organization 7
Charter Schools
In 1992, California became the second state to enact charter school
legislation.6 As of the 2002–2003 school year, in which 89 charter
schools opened, there were 452 charter schools in the state. These schools served about 2.5 percent of all public school students in 2002–2003, making California fifth among all states for the highest percentage of public school students enrolled in charter schools.
California’s law states that priority for awarding charters is given to schools that would serve low-achieving students. Because minority students’ families tend to have lower incomes than do white students’ families and low-achieving students tend to be from low-income backgrounds, there were fears that charter schools would enroll dis-proportionate numbers of minority students. However, when we con-trol for racial/ethnic heterogeneity across districts, charter schools have a higher percentage of blacks, lower percentages of Hispanics and Asians, and about the same percentage of whites as do conven-tional public schools. Evidence on whether student achievement is higher in charter schools was mixed and depended on the type of charter school.
Vouchers and Open Enrollment
Two efforts to provide vouchers for private schools have failed among California voters, and no state has implemented a comprehensive voucher program. Proposition 174, a voucher initiative in 1993, would have paid $2,600 of private school tuition for California stu-dents. It lost by a 2-to-1 margin. Proposition 38, on the ballot in California’s 2000 election, would have offered every school-age child in the state a voucher worth a maximum of $4,000—one-half of the national average spending per pupil in public schools, and one-half of California’s spending per public school pupil. The vouchers would have been redeemable at any private school. The proposal received the support of only 29 percent of the voters.
____________
6 Charter schools are public schools that are sponsored and funded by the local or state pub-lic school system but are designed, organized, and operated by people or organizations dis-tinct from the sponsoring and funding school system.