Getting More for Less: Optimized Crowdsourcing with
Dynamic Tasks and Goals
Ari Kobren
∗ Google & UMass Amherst[email protected]
Chun How Tan
Google[email protected]
Panagiotis Ipeirotis
∗Google & NYU
[email protected]
Evgeniy Gabrilovich
Google[email protected]
ABSTRACT
In crowdsourcing systems, the interests of contributing par-ticipants and system stakeholders are often not fully aligned. Participants seek to learn, be entertained, and perform easy tasks, which offer them instant gratification; system stake-holders want users to complete more difficult tasks, which bring higher value to the crowdsourced application. We di-rectly address this problem by presenting techniques that optimize the crowdsourcing process by jointly maximizing the user longevity in the system and the true value that the system derives from user participation.
We first present models that predict the “survival proba-bility” of a user at any given moment, that is, the probability that a user will proceed to the next task offered by the sys-tem. We then leverage this survival model to dynamically decide what task to assign and what motivating goals to present to the user. This allows us to jointly optimize for the short term (getting difficult tasks done) and for the long term (keeping users engaged for longer periods of time).
We show that dynamically assigning tasks significantly increases the value of a crowdsourcing system. In an exten-sive empirical evaluation, we observed that our task alloca-tion strategy increases the amount of informaalloca-tion collected by up to 117.8%. We also explore the utility of motivating users with goals. We demonstrate that setting specific, static goals can be highly detrimental to the long-term user partic-ipation, as the completion of a goal (e.g., earning a badge) is also a common drop-off point for many users. We show that setting the goals dynamically, in conjunction with judi-cious allocation of tasks, increases the amount of information collected by the crowdsourcing system by up to 249%, com-pared to the existing baselines that use fixed objectives.
∗
Work done while at Google.
Copyright is held by the International World Wide Web Conference Com-mittee (IW3C2). IW3C2 reserves the right to provide a hyperlink to the author’s site if the Material is used in electronic media.
WWW 2015,May 18–22, 2015, Florence, Italy. ACM 978-1-4503-3469-3/15/05.
http://dx.doi.org/10.1145/2736277.2741681.
1.
INTRODUCTION
Crowdsourcing has become increasingly popular in recent years due to its proven success in a variety of domains in-cluding knowledge base construction, image labeling, lan-guage translation, and others. Despite its numerous suc-cesses, crowdsourcing remains more of an art than a science, as a system designer must attract users and keep them en-gaged in order to complete tasks. Various approaches for engaging users have been proposed, yet each of them has its shortcomings. Explicit monetary incentives, which are used by both Amazon Mechanical Turk (AMT) and oDesk, may incentivize participants to continue working even if they lack the necessary expertise. Systems like Duolingo [24] and Zooniverse1offer users an educational experience in ex-change for tasks that are useful to the stakeholder. Finally, some crowdsourcing systems completely ignore the goal of user engagement, and use task completion as a pre-condition to access a valuable resource (e.g., ReCAPTCHA [25] or Google Consumer Surveys2).
One of the fundamental difficulties for engaging users in crowdsourcing tasks is the lack of alignment between the in-terests of crowd users and stakeholders. For example, users often prefer to work on simple tasks requiring low cognitive loads, while the stakeholders benefit when users complete difficult tasks that demand substantial effort to complete. For example, in Zooniverse, a user may prefer to work on easy cases, which provide the immediate gratification of suc-cessfully completing a task; however, such cases may not be the ones that contribute the most towards the goal of the Citizen Science project. In Duolingo, the user may spend a lot of time completing familiar exercises, as completing such exercises are an easy way to earn “experience points”; however, these exercises may not be the ones that lead to the best educational outcomes. In Quizz [10], users prefer to answer easy questions and drop out when facing hard quiz questions. However, the goal of the system is to leverage user answers to discover the answers to the hard questions; hence answers to the easy questions has significantly less value to the stakeholder than answers to the hard questions. Past work has explored the use of goals (e.g., badges [2]) to improve user participation, and steer it towards more valuable tasks. In the setting of paid crowdsourcing, there are also previous works in determining the relationship be-tween pricing and engagement [16]. In this work, we focus 1https://www.zooniverse.org/
2
on the setting of volunteer crowdsourcing, building upon the paradigm of guided engagement and presenting two meth-ods forjointly maximizing user engagement and the value of the data collected via a crowdsourcing campaign.
To this end, we first develop usersurvival models, which predict drop out events. By considering the user’s pre-ferred task subjects, appropriate difficulty level, and other joint characteristics of the user-task pair, it is possible to train models that predict drop out events up to 77% accu-racy. Next, we presentsurvival-based dynamic task alloca-tion, which actively allocates tasks to users by balancing the value of the task with the likelihood of a user dropping out after being assigned to the task. Our method is framed as a Markov Decision Process [20] with an infinite state space and an action space consisting of all valid task allocations. Building upon [10], we model the contributions of each user as a noisy channel, and evaluate the quality of submitted responses using information theoretic metrics. We demon-strate that our survival-based task allocation demon-strategy in-creases the amount of information collected from users (as measured by information gain) by up to 117.8%.
Our second technique is focused on optimized crowdsourc-ing via adaptive deployment of goals. Although goals aim to encourage users to be more participatory, we empirically demonstrate that the overall value of certain goals may have
negative net effects on the volume of user contributions,
compared to not having a goal at all. Somewhat counter-intuitively, we discovered thatnot setting short-term goals (e.g., showing the user how many tasks are left in a single session) actually increases overall participation. This hap-pens because specific goals provide incentives for completing tasks, but at the same time they lead users to “fixate” on the goal completion and thus provide natural drop-out points af-ter the user achieves the designated goal. Motivated by this discovery, we propose survival-based dynamic goal deploy-ment—a strategy that dynamically sets reasonable goals for users who are at risk of dropping out, in order to encourage their continued participation. Similar to our proposed task allocation method, we formulate dynamic goal deployment as an MDP that optimally chooses between two possible ac-tions: to set a goal or to leave all goals unspecified. We show that this strategy can result in an improvement of up to 249% in the amount of information collected from the users.
The contributions of this work are threefold. First, we show how to integrate user survival models into an active task allocation framework, in order to optimally assign tasks that balance user engagement and task value. Second, we present empirical results demonstrating how the presence of goals affects user participation in a crowdsourcing system. We show that setting specific goals may be detrimental to long-term user participation, as users tend to drop out im-mediately upon completing the goal. Finally, we propose an adaptive framework that dynamically sets goals for users in a way that significantly increases the amount of informa-tion contributed by the users. The experiments reported in this paper were performed on real-life tasks using the Quizz crowdsourcing platform [10], and involved over 13,000 users who contributed over 128,000 answers.
2.
METHODOLOGY
User engagement plays a significant role in the effective-ness of most crowdsourcing applications. Despite this,
for-mal models of survival—or a user’s likelihood of continu-ing to work on a task—have been largely under-explored. Recently, Mao et al. [15] introduced models for predicting whether a user will drop out3 (namely, stop working on a task) in the context of Galaxy Zoo, a citizen science crowd-sourcing application.
In this section, we first introduce models of user survival, and then use those models to design dynamic approaches for task allocation and goal deployment. Throughout the paper, we use the term task to refer to a single multiple-choice question, andquizto refer to a sequence of tasks. In our work, we focus on tasks that are in the form of multiple-choice questions but future work could extend to tasks into other formats such as validation questions (yes/no), annota-tion tasks, and free-text tasks. We note that prior work on survival models has primarily focused on longer term pre-dictions, e.g., whether a user will drop out within the next 5 minutes [15]. On the other hand, models we develop have finer granularity and make shorter-term predictions, namely, whether a user will drop out given a specific task. Although we experimented with a number of models, we only present our logistic and fitted-Q models because they are fast to train and most accurate.
2.1
Logistic Survival Models
We present several logistic models to estimate the prob-ability of a user dropping out given various signals derived from the user’s state and the particular task. The complete list of signals is summarized at Table 1. Our models take the form:
P(x) = 1 1 +e−(β+wTx)
wherexis the feature vector representing the user’s state and the current task, w are the learned weights and P(x) is the probability of survival corresponding to that vector. All the models are L2-regularized and trained using scikit-learn [19]. The different models are trained on different sub-sets of the training data, as explained below.
2.1.1
Logistic-All Model (LA)
The Logistic-all model makes use of all available training data. This model was proposed in previous work [15].
2.1.2
Logistic-Middle Model (LM)
There is often high variance in user participation in crowd-sourcing tasks: some users complete a single task while oth-ers complete many more tasks. The participation level of these users may be significantly biased by factors other than the task at hand: a user who completes a single task may be unwilling to complete additional ones regardless of their content; a user who completes hundreds of tasks may be gen-erally interested in the application and would complete any task presented with the same vigor. To this end, we train the LM model by eliminating outliers and only use data from the users who complete between three and ten tasks, corre-sponding roughly to the middle 50 percentile of the users, in term of user engagement. This way, users whose interac-tions with the system are largely predetermined by external factors will not affect the model. These exclusions greatly reduces the size of the training data.
3In this work, the authors used the termdisengage instead of drop out.
2.1.3
Logistic-Sequential Model (LS)
We develop the logistic-sequential model for modeling sur-vival through a sequence of tasks. Unlike the previous mod-els, the LS model is a sequence of modmod-els, one for each task in a sequence (first task, second and so on). Each model is trained using all data collected from users working on the corresponding task (e.g., the third model is trained using data collected from tasks served third in any quiz). In-tuitively, there is a different prior probability of survival at each task index (i.e., it is more likely that a user sur-vives a task if it is the final task separating the user from a goal/badge). In addition to accounting for this bias, the LS model is able to capture the relative importance of different features at each task index (e.g., to promote user engage-ment it is much more important for the first task to be easy than the ninth). The LS model requires splitting the train-ing data into multiple groups of vastly different sizes.
2.2
Fitted-Q Survival Model (FQ)
We also train a regression model using fitted-Q iteration— a meta-algorithm borrowed from reinforcement learning [18]. Unlike the logistic models, the fitted-Q model predicts a real-valuedrewardfor each training instance instead of a number between zero and one. While this model does not produce probabilities of survival, it can predict the relative utility of allocating different tasks to any user throughout interaction with a crowdsourcing application.
We allow the space of vectors describing a user’s state (Table 1) to be infinite. Therefore the goal of training our FQ model is to learn a state-action function,Q:S×A→R, i.e., a function whose input is a user’s state and a task and whose output is a real value. To learnQ, we iteratively train a regression model using fitted-Q iteration.
We define a reward function R : S×A →R that takes a user’s state and an action (i.e. a task to allocate) and returns the reward associated with being in states∈Sand taking actiona∈A. In our case,
R(su, a) =
(
0, if userudrops out after actiona
1, otherwise
Additionally, we define a value function V : S → R that returns an estimate of the value of being in states. Then, we iteratively learn the functionQ(s, a) by training a regression model to predict the sum of the reward function, R, and the discounted future reward, V, for taking action a and transitioning to states0. We compute the value forV(s) at iteration k+ 1 using the model,Q, learned at iteration k. Assuming the state-action functionQis parameterized by a vectorθ, we iterate the following optimization:
θ(k+1)= arg min
θ l(Q(s, a;θ),[R(s, a) +γV
(k) (s0)]) = arg min
θ l(Q(s, a;θ),[R(s, a) +γQ(s
0
, a0;θ(k))]) wheresands0 areconsecutive user states,aanda0 are the tasks allocated to users in statess ands0 respectively and
l(.) is some loss function defined by the choice of model for
Q. In our work we modelQas ridge regression and initialize
Q(0)(s, a) = 0 for all states and actions. Each time we learn a newθwe refine our model; we iterate the training process until convergence.
The advantage of the FQ model is that it is trained to consider thecumulative reward of taking some action rather than the immediate reward (i.e. the logistic models, see Section 2.1). By considering future states, the FQ models could theoretically be used to construct a more engaging session for a user given his or her state.
2.3
Dynamic Task Allocation
Not all crowdsourcing tasks are created equal. Some tasks are more difficult than others; some tasks are interesting and others not; some tasks are more valuable to the system designer. Similarly, all users find tasks different in terms of interestingness, difficulty, etc. To account for this diversity, we develop models that dynamically allocate tasks to users in order to achieve higher user engagement and higher value for the task owner.
We formalize task allocation as a Markov Decision Process (MDP) [20]. An MDP is a tupleM= (S, A, P, R) whereSis the state space,Ais the action space,P :S×A×S0→[0,1] is a transition function and R:S×A×S0 →Ris the re-ward function. The (infinite) state spaceS contains vectors describing the state of a user in the midst of completing a sequence of tasks. The action space A is comprised of all tasks that the system can allocate to the user. P is a func-tion that describes the likelihood of a user transifunc-tioning to states0 after being in statesand being allocated taska. R
describes the reward associated with a user in statesand be-ing allocated taska. The goal of task allocation is to learn a
policy for allocating tasks to users that maximizes expected
reward. In our work, we use the expected information gain (Section 3.4.1) to be our reward function.
A naive policy is to greedily allocate the task with the highest reward given the user. However, this fails to con-sider the probability that a user might not be interested in the task, find the task too difficult, etc. and choose to drop out. Allocating a task that causes a user to drop out is very costly; after dropping out, the user can produce no additional reward for the system.
We propose a survival-based task allocation framework for crowdsourcing tasks (e.g., quizzes consisting of multi-ple questions). Assuming a model of survivalMs,
survival-based task allocation computes the expected reward by con-sidering the chance that a user will drop out after being served a taska:
E[R(su, a)] =Ms(su= 1|a)·R(su, a)
whereMs(su= 1|a) is the probability that a user survives
task a under model Ms, and R(su, a) is the reward that
useruin statesprovides to the system when allocated task
a. This new reward function averages the case that a user survives the task with the case that a user does not survive the task and contributes no additional reward to the system. Under this framework, we can adopt a policy of allocating the task,a∗u, with the highestexpected reward:
a∗u= argmax a∈A E
[R(su, a)]
2.4
Dynamic Goal Deployment
Many crowdsourcing platforms introduce goals (e.g., badges) to motivate the users [2]. Assuming that goals motivate users to complete tasks, survival models can then be used
to promote participation by setting attainable goals dynam-ically when users are at risk of dropping out. Similar to online task allocation, user participation can be improved throughsurvival-based dynamic goal deployment.
Like task allocation (Section 2.3), we can formalize dy-namic goal deployment as an MDP. The MDP for goal de-ployment consists of the same state spaceSas for task allo-cation, however, the action space now includes a set of goals. The transition function,P, and the reward function,R, are modified appropriately.
Again, we could employ a naive strategy and always use goals in an attempt to motivate additional participation. However, as we show empirically in Section 4.2, goals can also affect participationnegatively. Therefore, we adopt a survival-based framework for deploying goals.
Although a system could have arbitrarily many goals, we consider a simplified action space consisting of two actions: deploying a goal or leaving the goal unspecified. Under this action space, we employ the following survival-based goal deployment policy:
g∗u=
(
0, ifP(su|Ms)> τ(Ms)
1, otherwise
where gu∗ = 1 is the decision to deploy goal g to user u,
P(su|Ms) is the probability of survival for useruin states
under the modelMs, andτ(Ms) is a survival model-based
threshold. In practice, we set τ(Ms) to be the empirical
drop out rate of users at a particular task index. Thus, the policy only sets a goal if we predict the user is likely to drop out. This policy assumes that a goal deployed un-der appropriate circumstances will encourage a user to con-tinue participating. We provide empirical support for this assumption in our experimentation (Section 4.2).
3.
EXPERIMENTAL SETUP
To evaluate our proposed methodologies, we run exper-iments on Quizz—a gamified crowdsourcing platform that administers quizzes to volunteer users [10]. Quizz uses an advertising platform 4 to serve advertisements on search and display networks in order to recruit targeted volun-teers [10]. When a user first arrives at the site, she is pre-sented with a quiz, which is a collection of multiple choice, factual questions. After the user chooses an answer (or skips the given question), the system displays the correct answer to the question, which was either specified by the system de-signer in advance or computed using answer resolution tech-niques [7, 21, 27]. After answering a question, the system immediately presents the user with an additional question or signals the end of a quiz (quizzes are typically comprised of ten questions). Upon completion of a quiz, the system presents a summary of the user’s performance and offers the user the option to begin another quiz. A user may drop out—or stop answering questions—at any time.
For each of our experiments, we apply the same advertis-ing settadvertis-ings when recruitadvertis-ing volunteers. This is necessary to minimize the effects of specific volunteer groups biasing the final results. Settings that we explicitly control for include: advertising keywords, cost per click, total budget for each task, time and duration, geographical location, and etc. 4for more information about recruiting users for crowdsourc-ing through advertisements see [10].
3.1
Data Set
The training dataset (used to train the models described in Section 3.3) consists of question-answer pairs collected by crowdsourcing answers for question in four different do-mains: movie actors, musical artists, disease symptoms and effects of medical treatment. In total, there are 16,824 train-ing instances—12,795 of them are positive instances (i.e., the user survives the question) and 4,029 are negative instances (i.e., the user drops out after seeing this question).
We collect a separate test dataset for each experiment. The datasets are comprised of question-answer pairs. There are (the same) 200 unique questions in each test set; these questions were drawn uniformly at random from question sets in the following nine domains: book authors, business CEOs, disease symptoms, soccer players, geography, movie actors, organization headquarters, American football players and effects of medical treatments. We term this set of 200 questions the Mixed Quiz. For some experiments we also collected test datasets using 200 questions drawn from a single domain. These additional datasets help us evaluate how well our models generalize across different tasks and question domains. In total, we collect 13,123 volunteer users and 128,466 answers in our system for the evaluation results.
3.2
Preprocessing
The set of typical Quizz users includes many users who answer a single question and then drop out. Since it is dif-ficult to reason about users who contribute few answers, we exclude them from our evaluation results on the test dataset, unless otherwise specified. Specifically, we only compute our results using answers provided by users who submitat least
three answers (not including skip actions).
3.3
Learning Survival Models for Quizz
We experiment with the Quizz crowdsourcing platform [10]. When interacting with Quizz a user answers an arbitrary, positive number of quiz questions. Our task is to learn a model that predicts whether a user will drop out given the user’s state and a question (to serve the user). Therefore, we convert each displayed question into a training instance by representing it as the concatenation of features described in Table 1. The label of each training instance is a binary variable taking the value zero if the user drops out after see-ing the question and the value one if the user survives (i.e. answers the current question seen). We construct training instances similar to those described in previous work except that our labels represent whether users drop out after the current task (i.e. Quizz question) while the previous work labels instances based on drop out after a number of addi-tional tasks or minutes spent working [15].3.3.1
Factors that Affect User Survival
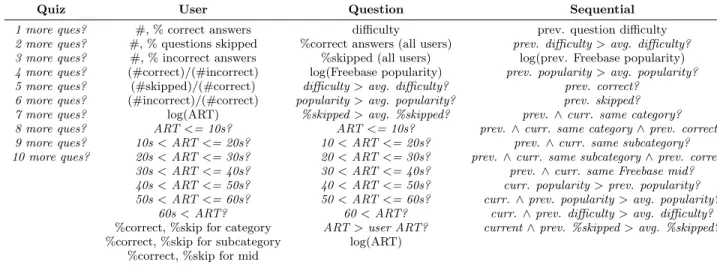
We present features that are likely to affect user engage-ment in Table 1. Our User and Question features are in-spired by those discussed in previous work [15]. We also include a number of platform specific features (i.e., features related to the Quizz platform) and features describing se-quences of tasks served by the system. These additional features help to improve our ability to make accurate short term predictions (of users dropping out).
We divide the features affecting user survival into four main categories:
Quiz User Question Sequential
1 more ques? #, % correct answers difficulty prev. question difficulty
2 more ques? #, % questions skipped %correct answers (all users) prev. difficulty>avg. difficulty? 3 more ques? #, % incorrect answers %skipped (all users) log(prev. Freebase popularity)
4 more ques? (#correct)/(#incorrect) log(Freebase popularity) prev. popularity>avg. popularity? 5 more ques? (#skipped)/(#correct) difficulty>avg. difficulty? prev. correct?
6 more ques? (#incorrect)/(#correct) popularity>avg. popularity? prev. skipped?
7 more ques? log(ART) %skipped>avg. %skipped? prev. ∧curr. same category?
8 more ques? ART<= 10s? ART<= 10s? prev. ∧curr. same category∧prev. correct? 9 more ques? 10s<ART<= 20s? 10<ART<= 20s? prev.∧curr. same subcategory? 10 more ques? 20s<ART<= 30s? 20<ART<= 30s? prev. ∧curr. same subcategory∧prev. correct?
30s<ART<= 40s? 30<ART<= 40s? prev. ∧curr. same Freebase mid? 40s<ART<= 50s? 40<ART<= 50s? curr. popularity>prev. popularity? 50s<ART<= 60s? 50<ART<= 60s? curr.∧prev. popularity>avg. popularity?
60s<ART? 60<ART? curr.∧prev. difficulty>avg. difficulty?
%correct, %skip for category ART>user ART? current∧prev. %skipped>avg. %skipped?
%correct, %skip for subcategory log(ART) %correct, %skip for mid
Table 1: Features used to train survival models by feature group. Features initalics are binary features. All times are computed in seconds. We abbreviate average response time with ART. “Category” refers to the domain of the question (e.g. geography), “subcategory” refers to the notable type of the question subject (e.g. mountain, river) and “mid” refers to the question subject (e.g. Mount Everest).
• Quiz: features in this group capture the amount of a task that a user has completed.
• User: features in this group help represent a user working on a task. Some user features include: a user’s average quality, domain expertise and average response time.
• Question: features in this group capture character-istics of a Quizz question. This group includes user-independent features (e.g., question difficulty, popu-larity, etc.) and user-dependent features (e.g., rate at which this question is skipped among all users, average response time, etc.).
• Sequential: features in this group represent ques-tion sequences and capture diversity of topic, difficulty, popularity, etc. in sequential questions.
3.4
Measuring Efficacy of Crowdsourcing
A crowdsourcing system designer strives to collect as much high quality data as possible at low cost. As such, we eval-uate our methods using three metrics: information gain, ef-ficiency, and user participation.3.4.1
Information Gain
Previous work in crowdsourcing argues for information theoretic evaluation metrics (especially for tasks similar to question-answering) [10, 22, 26]. We adopt the notion of information gain presented in previous work on Quizz [10]. The entropy of a Quizz question is computed by:
H(q;A) =− X
a∈Aq
P(a) logP(a)
where q is the question, Aq is the set of multiple choice
answers forqandP(a) is the probability that answer choice
ais correct. Theoretically, we can computeP(a) using any arbitrary method (e.g. majority voting or other state of the art methods [7, 21, 27]). In practice we computeP(a) using the number of votes collected for answerain addition to the
estimatedquality of each user. Specifically, a user’s quality,
ru, is the (smoothed) fraction of correct answers that user
has submitted. When a user submits an answer a ∈ Aq
the user contributesIG(ru) bits in support of that answer,
where theruis computed on the fly, based on her previous
answers:
IG(ru) =H(r0)−H(ru)
where H(r0) = 1
n (i.e., the entropy of the distribution
of answer submissions for a user who chooses answers at random). To compute P(a) we simply divide the number of bits submitted in support of answer a∈Aq by the total
number of bits submitted for all answers inAq. As we receive
more contributions from the users,P(a) is updated and the entropy of the question changes. The lower a question’s entropy, the more confident we are in our prediction of its correct answer.
With these definitions, we can compute the initial en-tropy in a question set Q by summing the entropy of all questions (before any bits in support of answers have been contributed). We measure the improvement due to crowd-sourcing via theinformation gain in the question set:
IG(Q, A) =X
q∈Q
[H0(q)−H(q;Aq)]
whereQis a set of questions andH0(q) is the initial en-tropy of questionq(where all answers are equally probable). Absolute information gain is significantly affected by the number of participants who submit responses. Therefore we compute theaverage information gain(AIG) per user when comparing two systems.
3.4.2
Efficiency
While a crowdsourcing application can achieve high AIG, it might not beefficientcompared to the AIG it could theo-retically achieve given the same user engagement and qual-ity. For example, assigning a user with perfect quality in
domainDto a question in domainD0 could be wasteful (in terms of information gain). To measure how efficient our task allocation is, we define theefficiency of the system to be the quotient of the information gain obtained from crowd-sourcing to the total information gain the users could have theoretically contributed:
EF= PIG(Q, A)
u∈UIG(u)
whereIG(u) is the total information gain provided by the useru. We define the information gain of a user to be:
IG(u) =|Au| ·IG(ru)
where|Au|is the number of answers contributed by user
uandIG(ru) is information gain foruwith qualityr.
3.4.3
User Participation
Significant user engagement (and participation) can im-prove the efficacy of a crowdsourcing application. As such, a system designer could craft a task to maximize the average contributions per user. However, the average can be highly skewed by users who submit an extraordinary large num-ber of contributions. Therefore, we propose a metric that attempts to minimize such effects which we termfractional
participation(FP):
F Px(U, x) =
|U≥x|
|U|
whereU≥x denotes the set of users who contribute at least
xanswers andU is the set of all users.
Sweeping the FP curve for x from [0,∞) yields a more complete profile of participation for a quiz. Comparing par-ticipation in two quizzes can then be done by plotting the FP curves for each and visually checking whether one strictly dominates the other (i.e. higher and to the right). We can also compare two FP curves by computing the area under the FP curve (FP-AUC) for each.
3.5
Methods Compared
We experiment with a number of dynamic task allocation and goal deployment strategies. We compare our model-based methods to a model-free, greedy baseline. The base-line operates by allocating the task with the highest entropy (i.e., largest potential for information gain) (note that the task with the highest entropy changes as users submit re-sponses). We use the following notation when referring to our methods of task allocation:
• TA: the greedy baseline; quiz has length ten.
• TA-INF: the greedy baseline; quiz has unspecified length (i.e., potentially infinite length).
• TA-x: survival-based dynamic task allocation using modelx∈ {LA, LM, LS, F Q}; quiz has length ten.
• TA-INF-x: similar to TA-x, but quiz has unspecified length (i.e., potentially infinite length).
• TA-INF-DG-x: similar to TA-INF-x, but also em-ploys survival-based dynamic goal deployment.
Quiz TA-LA TA-LM TA-LS TA-FQ
Geography 93.1% 71.5% 78.8% 24.8%
Symptom 23.3% 5.5% 28.7% 25.4%
Mixed 90.8% 48.4% 117.8% 73.3%
Table 2: Percent improvement of AIG for dynamic task allocation strategies over the baseline (TA).
4.
EXPERIMENTAL RESULTS
4.1
Dynamic Task Allocation
We compare the performance of the greedy baseline and four dynamic task allocation strategies: TA-LA, TA-LM, TA-LS, and TA-FQ (Section 3.3). We evaluate all task al-location strategies on the Mixed Quiz and two other quizzes: one is comprised of questions about disease symptoms (Symp-toms Quiz) and the other is comprised of geography ques-tion (Geography Quiz). Each of these additional quizzes tests how well the strategies generalize across different tasks with more specialized information. We recruit about 100 users for each quiz that answer at least three questions. We measure performance using all the three metrics described in Section 3.4.
4.1.1
Information Gain
We evaluate the information gain due to crowdsourcing under each task allocation strategy (including the baseline). Table 2 summarizes the percent improvement in AIG (Sec-tion 3.4) over the baseline for each task alloca(Sec-tion strategy. The results show that all four dynamic task allocation strategies improve upon the baseline, in some cases by more than 100%. Both the TA-LA and TA-LS models tend to perform the best while the TA-LM model tends to perform the worst. We believe the reason for this to be twofold: first, the TA-LM model is trained on less data than the other models and second, the data left out of the training set for the TA-LM model is important: many users (i.e.
∼50%) drop out before question three and therefore selecting appropriate questions for them will dramatically enhance performance. Users who answer an extraordinary number of questions can also contribute significant information gain and should therefore not be left out of training. We believe that the TA-LS model performs well in part due to its ability to learn the bias at each question index.
The TA-FQ model works well compared to the baseline method but is not a top performer. Recall that in train-ing this model the reward function returns the value one if the user does not drop out after being shown questionq
and zero otherwise. Thus our model is trained to predict a reward associated with the expected number of questions a user will answer but not the expected information gain. For future work, we believe that training the FQ model to predict expected information gain and then using a task al-location strategy that selects the question with the highest expected information gain (i.e. argmaxq∈QM
0
(q, u)) could perform much better and take advantage of the power of the fitted-Q meta-algorithm.
4.1.2
Efficiency
While all dynamic task allocation strategies achieve higher AIG than the baseline, it is important to understand the
Quiz TA TA-LA TA-LM TA-LS TA-FQ
Geo. 0.40 0.45 0.68 0.53 0.41
Sym. 0.55 0.50 0.48 0.49 0.41
Mix. 0.35 0.64 0.62 0.62 0.66
Table 3: Efficiency of various task allocation strate-gies on the Geography, Symptoms and Mixed quizzes.
Quiz TA TA-LA TA-LM TA-LS TA-FQ
Geo. 17.4 16.8 11.5 16.3 13.3
Sym. 19.1 20.9 20.4 22.2 23.2
Mix. 17.3 15.0 13.8 15.7 15.9
Table 4: FP-AUC of different task allocation strate-gies on the Geography, Symptoms and Mixed quizzes. Most of the task allocation strategies do worse than the TA baseline, suggesting that the im-proved information gain does not stem from more answers but rather better allocation of tasks to users.
theoretical improvement that can be achieved by aperfect
task allocation strategy given the same user qualities and
participation. Table 3 summarizes the efficiency of each task allocation strategy, defined in Section 3.4.2.
Our results show that none of the dynamic task allocation strategies are consistently top performers. This could be due to inaccuracies in our models of user quality and user information gain (Section 3.4.1), especially for users who submit few answers.
For dynamic task allocation strategies, efficiency tends to be higher for the Mixed Quiz. We believe that this is due to the dynamic strategies appropriately allocating tasks in different domains to users based on their inferred interests and expertise. This suggests that grouping crowdsourcing tasks by domain is not always optimal; instead, system de-signers should use dynamic methods to select a task from an appropriate domain for each user.
Finally, the highest efficiency achieved by any of our meth-ods is 0.68, which is still far from the theoretical maximum efficiency (1.0). This suggests that it is possible to further improve the efficiency of our dynamic task allocation tech-niques and increase AIG by up to 50%.
4.1.3
User Participation
We also evaluate our methods in terms of user partici-pation to understand whether the increase in AIG can be attributed to better task allocation or simply better user engagement. Table 4 presents the measured FP-AUC (Sec-tion 3.4.3) for each quiz.
We observe that none of the dynamic task allocation strate-gies have consistently higher FP-AUC than the baseline model, despite all dynamic methods achieving higher AIG. This im-plies that the higher AIG of the dynamic models is due to better task allocation rather than increased levels of partic-ipation. The dynamic methods are better able to balance asking appropriate questions on a per user basis and asking questions that are likely to yield high information gain.
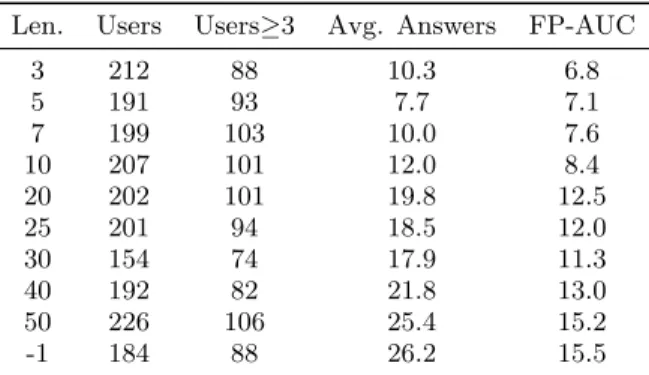
Len. Users Users≥3 Avg. Answers FP-AUC
3 212 88 10.3 6.8
5 191 93 7.7 7.1
7 199 103 10.0 7.6
10 207 101 12.0 8.4
20 202 101 19.8 12.5
25 201 94 18.5 12.0
30 154 74 17.9 11.3
40 192 82 21.8 13.0
50 226 106 25.4 15.2
-1 184 88 26.2 15.5
Table 5: Effects of varying stated quiz length. In-creasing the quiz length tends to increase the area under the FP curve. “Users≥3” refers to users who answer ≥3 questions. The average number of an-swers submitted is highest when the quiz length is not specified (last row, labeled “-1”).
Figure 1: Fractional participation as a function of stated quiz length, plotted with shaded area repre-senting one standard deviation away from the mean for both sides. Leaving quiz length unspecified (“-1”) yields the highest fraction of users submitting more than 50 answers.
4.2
Static Goal Deployment
Quizz administers quizzes of length ten to incentivize users to contribute at least ten answers. Quiz length is clearly displayed to the users: a statistics bar on the task page reports the index of the current question out of ten. In this experiment we explore the effect of the displayed quiz length on user participation. We measure participation for quizzes of length up to 50 questions. We also repeat the experiment without displaying the quiz length at all. In each case, the stated length is the true length of the quiz; when no length is stated, questions are served until the user drops out. In all cases, when a user completes a quiz (i.e., answers ten questions in a quiz of length ten), the system immediately prompts the user to begin a new quiz. The results are summarized in Table 5 and Figure 1 (we omit displaying data for quizzes of lengths 3, 7, 20, 25 and 40 to improve readability; see Table 5 for all data).
Although previous research [2] suggests that humans work more effectively when trying to accomplish a goal, we find
that, on average, users contribute the most answers when quizzes have an unspecified length (Table 5). Figure 1 shows that the FP curve corresponding to the quiz with unspecified length does not always dominate the other curves, but it has the highest fraction of users who contribute more than 50 answers. We find that our results are statistically significant using a sign test (with p-value<0.0001).
Figure 1 exhibits a clear trend that helps explain this sur-prising result: for all quizzes with a specified quiz length, the FP curve drops dramatically at the stated quiz length. For example, the curve that corresponds to quiz length 50 drops from about 0.15 to 0.04 between questions 50 and 51. Note that for the smaller quiz lengths (e.g., 10), there are similarly large drops at multiples of the quiz length (e.g., 20, 30 and so on). We hypothesize that this drop occurs because completing a quiz is a natural stopping point for users. The curve corresponding to the quiz of unspecified length has no large drops because there is no clear point at which users should stop working. In this way, leaving quiz length unspecified does not provide any encouragement to drop out for users with potential to answer a large number of questions.
However, in certain cases specifying quiz length does have some positive effects. As we can see in Figure 1, very few users drop off immediately before the stated quiz length. We hypothesize this happens because the goal seems so close and within reach. This implies that users are unlikely to drop out immediately before achieving goals. Although they provide natural points for users to drop out, in an appropriate con-text goals can be strong motivators for completing several additional tasks.
4.3
Dynamic Goal Deployment
Based on the results of the previous experiment (Sec-tion 4.2) we test dynamically setting quiz length (i.e. the goal) using the MDP for dynamic goal deployment (Sec-tion 2.4). In this experiment, setting a goal corresponds to specifying the number of questions remaining in the cur-rent quiz. We test setting the quiz length to an additional
x∈ {1,2,3,4,5}questions (e.g. setting the goal to be com-pleting three additional questions). We compare the results to two baselines: the TA baseline and the TA-INF baseline. It is important to compare our methods with the TA-INF baseline because the previous results (Section 4.2) show that leaving quiz length unspecified significantly boosts user par-ticipation. We recruit about 350 users for each experiment setting, which corresponds to about 150 users that submit at least three answers. We experiment with all task alloca-tion strategies except for TA-LM (which does not perform well in practice).
4.3.1
Information Gain
Table 6 summarizes the improvement in AIG compared to the TA baseline method.
While all dynamic goal deployment strategies outperform the TA baseline, only a few of the dynamic strategies out-perform the TA-INF baseline. Although setting goals dy-namically can yield improvements in participation, inappro-priately setting dynamic goals isworse than leaving goals unspecified. Intuitively, this result makes sense: setting a dynamic goal could trigger an early drop out.
Our results show that the INF-DG-LS beats the TA-LS baseline regardless of the specific dynamic goal. This
Goal (Ques. Remaining) LA LS FQ
-1 141.3% 133.7% 147.8%
1 42.5% 249% 102%
2 156.4% 154.7% 101.8%
3 127.4% 203.6% 27.6%
4 96.8% 232.9% 21.2%
5 122.6% 221.5% 74.4%
Table 6: Percent improvement in AIG for dynamic goal deployment over the TA baseline. “-1” corre-sponds to the TA-INF baseline.
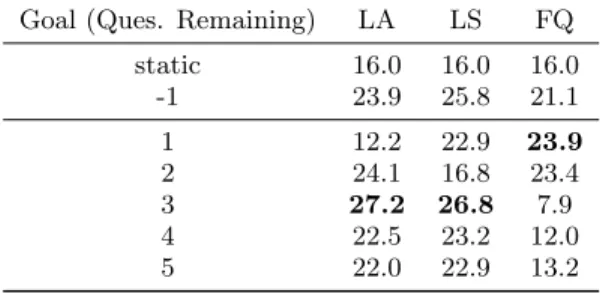
Goal (Ques. Remaining) LA LS FQ
static 16.0 16.0 16.0
-1 23.9 25.8 21.1
1 12.2 22.9 23.9
2 24.1 16.8 23.4
3 27.2 26.8 7.9
4 22.5 23.2 12.0
5 22.0 22.9 13.2
Table 7: FP-AUC under different models and ad-justments in the dynamic goal deployment frame-work. “Static” corresponds to the TA baseline; “-1” corresponds to the TA-INF baseline.
agrees with our information gain results in Section 4.1. The success of the LS model is in large part due to it being well calibrated (Section 4.4). A well calibrated model makes accurate estimates of a user’s probability of survival allowing it to realistically compute expected information gain for task allocation.
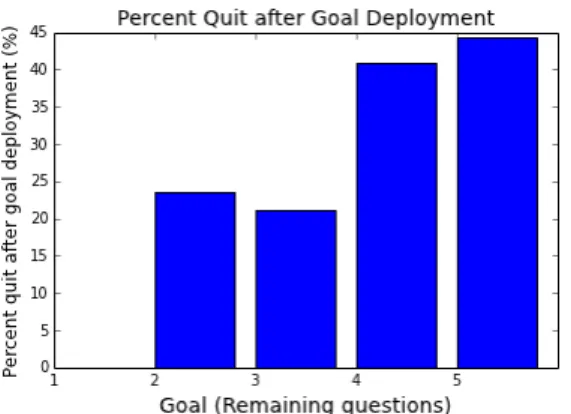
Dynamic goal deployment using the FQ model performs the worst, with all the dynamic goals achieving lower infor-mation gain than leaving the goal unspecified. Upon further investigation, we discover that the FQ model triggers acti-vating the dynamic goaltoo eagerly. Specifically, it deploys the dynamic goal five times as often as the other strategies. This causes 27.3% of the users to drop out immediately af-ter the dynamic goal is triggered, compared to 11.5% in TA-INF-DG-LS model and 2.7% in TA-INF-DG-LA model. However, because the FQ model is not trained to predict a user’s probability of survival, it is not well calibrated.
4.3.2
Effects of Dynamic Goal Deployments
Table 7 summarizes the affect of different dynamic goal deployment strategies on user participation.
The results show that not all the dynamic goal deploy-ment strategies outperform the TA-INF baseline (i.e. no dynamic goal). We believe this to be the case for two rea-sons. First, these results are significantly impacted by model calibration (i.e. uncalibrated models can be highly detri-mental). Second, dynamically setting goals that are difficult to attain (e.g. setting a goal to be answering five additional questions) can cause users to become frustrated and drop out prematurely. This hypothesis is supported by Figure 2, which shows the percent of users who drop out immediately after a dynamic goal is triggered.
Based on our results, dynamically setting quiz length to be three additional questions performs the best, with the
ex-Figure 2: Percent of users who drop out after a dy-namic goal is deployed. No users drop out if the dynamic goal is one additional question.
Model Prediction accuracy
LA 77.5%
LM 69.8%
LS-1 65.2%
LS-2 70.8%
LS-3 71.9%
LS-4 71.0%
LS-5 70.9%
LS-6 75.3%
LS-7 69.8%
LS-8 73.3%
LS-9 70.8%
LS-10 74.3%
Table 8: Accuracy of survival model in 5-fold cross validation with instance reweighting to account for the imbalanced training data. Here, LS-N is the LS model trained for question N.
ception of the FQ model (as discussed previously, this could be due to the FQ model being uncalibrated for predicting survival probabilities).
4.4
Survival Models
As discussed in Section 3.3, our survival models are trained to predict the probability of a user dropping out given his or her state and the current question (except for the FQ model) . Table 8 summarizes the prediction accuracy of each sur-vival model in 5-fold cross validation. The LA model per-forms the best with a prediction accuracy of 77.51%. The LS model also preforms well, with prediction accuracy ranging from 69.84% to 75.33%. We believe that the LS model has a worse prediction accuracy than the LA model because each of its ten predictors is trained with significantly less train-ing data (than the LA model). The LM model performs the worst among the models presented and we believe it is because of the exclusion of the highly engaged users, where the prediction task could be easier.
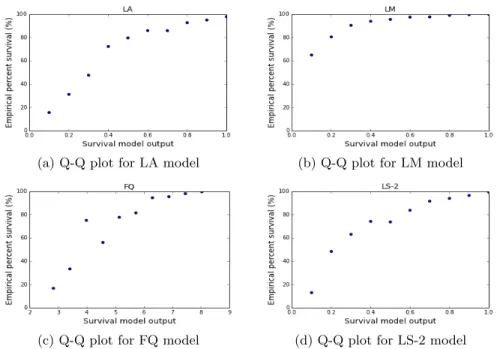
We also examine how well each of the survival models is calibrated using Q-Q plots [28], which allows us to visual-ize two probability distributions by plotting their quantiles against each other. The results are shown in Figure 3. We find that all the models produce reasonable results in which
the empirical survival probability increases almost monoton-ically with the model’s output score. The LA and LS mod-els are both better calibrated than the LM and FQ modmod-els. We present the Q-Q plot for LS-2 only (because of space limitations) but the Q-Q plots for the other LS models are similarly calibrated.
To better understand the performance of our survival mod-els, we train a decision tree to evaluate the importance of each feature. The top five most important features are
• Whether there are 10 more questions in the quiz
• User’s % correct for the current question’s category
• The log(average response time) of the current question
• The log(average response time) of the user
• The % users who skipped the current question. The importance of these features is intuitive. For exam-ple, average response time of a given question, if too long, might imply that the question is difficult and will negatively affect a user’s probability of survival. If a user has an affin-ity for a particular question category, that user is likely to provide valuable contributions when served questions in that category.
5.
RELATED WORK
One component of our work explores factors that affect user participation in crowdsourcing tasks. We focus on goals (e.g. quiz length) and dynamically adapting tasks based on models of user survival. Some recent work also builds mod-els of user survival but does not use these modmod-els to inform task adaptation [15]. Other work proposes a variety of incen-tives and static task modifications to increase engagement without using user models. In one example, the authors in-troduce the notion of micro-breaks—short periods of time during which users participate in something other than the crowdsourcing task—and show that integrating them into long tasks can increase overall participation [23]. There has been some other work in user engagement with the web but these models are not immediately relevant for crowdsourc-ing [13]. Researchers have also studied participation pat-terns of Wikipedia editors [11].
A significant amount of recent work explores incentiviz-ing participation withbadges. Badges are awards that users earn through completion of arbitrary goals including both
absolute goals (e.g., reaching some level of participation)
andrelativegoals (e.g., becoming the top contributor in an
online community). Researchers have analyzed the use of these badge types from an economic perspective in an effort to understand how to create mechanisms to encourage con-tributions [8]. In similar work, the authors build a model of user activity in the presence of badges and formalize a badge placement problem—a problem of creating a set of badges to incentivize users to participate according to the desires of a system designer [2]. Like our results, this work shows that users close to a goal are likely to work hard to achieve it (i.e., in our work, users are very unlikely to drop out when they are close to finishing a quiz). Unlike our work, these projects often do not focus on jointly incentivizing participation and the overall value of user contributions.
A related method of improving user engagement explored in the literature is that of personalization. Many researchers
(a) Q-Q plot for LA model (b) Q-Q plot for LM model
(c) Q-Q plot for FQ model (d) Q-Q plot for LS-2 model
Figure 3: Q-Q plots for the survival models drawn by splitting the model output score into 10 buckets. The x-axis is the model output score and the y-axis is the empiricial survival probability of the data instances.
have identified the benefits of building human-computer in-terfaces that dynamically adapt to user preferences [17, 12]. This is similar tocomputer adaptive testingwhich describes tests in which questions are selected online based on the test-taker’s performance. Adaptive testing can shorten tests, help gauge the user’s ability quickly and make the test-taking experience better for the test-taker [14]. Our survival models facilitate a form of adaptive testing and personaliza-tion (i.e. dynamic task allocapersonaliza-tion) but our strategies con-sider more than task difficulty. There is also a significant body of work exploring various techniques for personaliza-tion of the web in order to improve user satisfacpersonaliza-tion [1, 9].
Like much of the recent crowdsourcing literature, our work focuses on improving user contribution quality. Like our work, there has been a significant amount of research de-veloping methods for inferring user reliabilities and accu-racy of collected labels. Some practitioners use expectation-maximization to jointly infer the reliability of users and the accuracy of the labels they submit [7, 27]. In another ex-ample, the authors propose a method for inferring the cor-rect answers to multiple-choice questions by selecting an-swers that minimize a distance among all submitted anan-swers (weighted by user reliability) [3]. Many of these studies have demonstrated the importance of modeling task difficulty [4] and user ability. Unlike our work, most of these methods are applicable after the data has been collected and thus cannot consider user participation.
Cosely et. al develop intelligent task routing for solicit-ing contributions from users for a movie database [5]. Their work is similar to our dynamic task allocation however each of their strategies is based on a single feature and none con-sider user survival. Other previous work makes use of a MDPs and partially observable MDPs (POMDPs) to ac-tively modify crowdsourcing tasks. In one such project, the presented POMDP is used to actively modify
crowdsourc-ing workflows to increase quality in the data collected [6].
Although this work does not explicitly focus on improving participation, it should be possible to train their POMDP considering both participation and contribution quality.
6.
CONCLUSIONS
In this paper, we presented methods for realigning the interests of participants and designers of a crowdsourcing system. To this end, we introduced techniques that dynam-ically allocate tasks and goals in an optimal way in order to promote long-term user engagement. We presented four survival models for predicting when users will drop out from crowdsourcing tasks; these models form the basis of our dy-namic techniques. We tested our survival-based dydy-namic task allocation in the context of Quizz—a gamified crowd-sourcing platform [10]. The results show thatsurvival-based
task allocation always yields higher information gain than
the baseline that greedily allocates tasks with the highest entropy. With our best model we are able to improve upon the baseline by 117.8%.
This work also explored the effects of using specific goals on user participation. Surprisingly, we found that certain goals provide users with natural drop out points that de-crease overall participation. We also found that users are very unlikely to drop out when close to achieving a goal. These findings inspired the development of survival-based
dynamic goal deployment. In this approach, when users start
a new quiz they are at first not shown any goal. When one of our models predicts that a user is likely to drop out, we deploy a goal in the form of an explicit limit on the quiz length (i.e., we show the user that she has only a few more tasks to complete). Coupling dynamic goal deployment with the our task allocation method, we jointly optimize user par-ticipation and quality. Using these techniques together, we increase the amount of information collection by the crowd-sourcing system by up to 249% (compared to the baseline, as measured by the information gain).
7.
REFERENCES
[1] S. S. Anand and B. Mobasher. Intelligent techniques for web personalization. InProceedings of the 2003
international conference on Intelligent Techniques for Web Personalization, pages 1–36. Springer-Verlag, 2003. [2] A. Anderson, D. Huttenlocher, J. Kleinberg, and
J. Leskovec. Steering user behavior with badges. In
Proceedings of the 22nd international conference on World Wide Web, pages 95–106. International World Wide Web Conferences Steering Committee, 2013.
[3] B. I. Aydin, Y. S. Yilmaz, Y. Li, Q. Li, J. Gao, and M. Demirbas. Crowdsourcing for multiple-choice question answering. InTwenty-Sixth IAAI Conference, 2014. [4] Y. Bachrach, T. Graepel, T. Minka, and J. Guiver. How to
grade a test without knowing the answers—a bayesian graphical model for adaptive crowdsourcing and aptitude testing. InProceedings of the 29th International Conference on Machine Learning (ICML-12), pages 1183–1190, 2012. [5] D. Cosley, D. Frankowski, L. Terveen, and J. Riedl. Using
intelligent task routing and contribution review to help communities build artifacts of lasting value. InProceedings of the SIGCHI conference on Human Factors in computing systems, pages 1037–1046. ACM, 2006.
[6] P. Dai, C. H. Lin, D. S. Weld, et al. Pomdp-based control of workflows for crowdsourcing.Artificial Intelligence, 202:52–85, 2013.
[7] A. P. Dawid and A. M. Skene. Maximum likelihood estimation of observer error-rates using the em algorithm.
Applied statistics, pages 20–28, 1979.
[8] D. Easley and A. Ghosh. Incentives, gamification, and game theory: an economic approach to badge design. In
Proceedings of the fourteenth ACM conference on Electronic commerce, pages 359–376. ACM, 2013. [9] M. Eirinaki and M. Vazirgiannis. Web mining for web
personalization.ACM Transactions on Internet Technology (TOIT), 3(1):1–27, 2003.
[10] P. G. Ipeirotis and E. Gabrilovich. Quizz: targeted crowdsourcing with a billion (potential) users. In
Proceedings of the 23rd international conference on World wide web, pages 143–154. International World Wide Web Conferences Steering Committee, 2014.
[11] M. Krieger, E. M. Stark, and S. R. Klemmer. Coordinating tasks on the commons: designing for personal goals, expertise and serendipity. InProceedings of the SIGCHI Conference on Human Factors in Computing Systems, pages 1485–1494. ACM, 2009.
[12] P. Langley. Machine learning for adaptive user interfaces. InKI-97: Advances in artificial intelligence, pages 53–62. Springer, 1997.
[13] J. Lehmann, M. Lalmas, E. Yom-Tov, and G. Dupret. Models of user engagement. InUser Modeling, Adaptation, and Personalization, pages 164–175. Springer, 2012. [14] J. M. Linacre et al. Computer-adaptive testing: A
methodology whose time has come.Chae, S.-Kang, U.–Jeon, E.–Linacre, JM (eds.): Development of Computerised Middle School Achievement Tests, MESA Research Memorandum, (69), 2000.
[15] A. Mao, E. Kamar, and E. Horvitz. Why stop now? predicting worker engagement in online crowdsourcing. In
First AAAI Conference on Human Computation and Crowdsourcing, 2013.
[16] W. Mason and D. J. Watts. Financial incentives and the performance of crowds.ACM SigKDD Explorations Newsletter, 11(2):100–108, 2010.
[17] S. McBurney, E. Papadopoulou, N. Taylor, and H. Williams. Adapting pervasive environments through machine learning and dynamic personalization. InParallel and Distributed Processing with Applications, 2008. ISPA’08. International Symposium on, pages 395–402. IEEE, 2008.
[18] G. Neumann and J. R. Peters. Fitted q-iteration by advantage weighted regression. InAdvances in neural information processing systems, pages 1177–1184, 2009. [19] F. Pedregosa, G. Varoquaux, A. Gramfort, V. Michel,
B. Thirion, O. Grisel, M. Blondel, P. Prettenhofer, R. Weiss, V. Dubourg, J. Vanderplas, A. Passos,
D. Cournapeau, M. Brucher, M. Perrot, and E. Duchesnay. Scikit-learn: Machine learning in Python.Journal of Machine Learning Research, 12:2825–2830, 2011. [20] M. L. Puterman.Markov decision processes: discrete
stochastic dynamic programming, volume 414. John Wiley & Sons, 2009.
[21] V. C. Raykar, S. Yu, L. H. Zhao, G. H. Valadez, C. Florin, L. Bogoni, and L. Moy. Learning from crowds.The Journal of Machine Learning Research, 11:1297–1322, 2010. [22] S. Robertson, M. Vojnovic, and I. Weber. Rethinking the
esp game. InCHI’09 Extended Abstracts on Human Factors in Computing Systems, pages 3937–3942. ACM, 2009. [23] J. M. Rzeszotarski, E. Chi, P. Paritosh, and P. Dai.
Inserting micro-breaks into crowdsourcing workflows. In
First AAAI Conference on Human Computation and Crowdsourcing, 2013.
[24] L. von Ahn. Duolingo: learn a language for free while helping to translate the web. InProceedings of the 2013 international conference on Intelligent user interfaces, pages 1–2. ACM, 2013.
[25] L. Von Ahn, B. Maurer, C. McMillen, D. Abraham, and M. Blum. recaptcha: Human-based character recognition via web security measures.Science, 321(5895):1465–1468, 2008.
[26] T. P. Waterhouse. Pay by the bit: an information-theoretic metric for collective human judgment. InProceedings of the 2013 conference on Computer supported cooperative work, pages 623–638. ACM, 2013.
[27] J. Whitehill, T.-f. Wu, J. Bergsma, J. R. Movellan, and P. L. Ruvolo. Whose vote should count more: Optimal integration of labels from labelers of unknown expertise. In
Advances in neural information processing systems, pages 2035–2043, 2009.
[28] M. B. Wilk and R. Gnanadesikan. Probability plotting methods for the analysis for the analysis of data.