Ranking on Data Manifolds
Dengyong Zhou, Jason Weston, Arthur Gretton, Olivier Bousquet, and Bernhard Sch¨olkopf
Max Planck Institute for Biological Cybernetics, 72076 Tuebingen, Germany {firstname.secondname}@tuebingen.mpg.de
Abstract
The Google search engine has enjoyed huge success with its web page ranking algorithm, which exploits global, rather than local, hyperlink structure of the web using random walks. Here we propose a simple universal ranking algorithm for data lying in the Euclidean space, such as text or image data. The core idea of our method is to rank the data with respect to the intrinsic manifold structure collectively revealed by a great amount of data. Encouraging experimental results from synthetic, image, and text data illustrate the validity of our method.
1 Introduction
The Google search engine [2] accomplishes web page ranking usingPageRankalgorithm, which exploits the global, rather than local, hyperlink structure of the web [1]. Intuitively, it can be thought of as modelling the behavior of a random surfer on the graph of the web, who simply keeps clicking on successive links at random and also periodically jumps to a random page. The web pages are ranked according to the stationary distribution of the random walk. Empirical results show PageRank is superior to the naive ranking method, in which the web pages are simply ranked according to the sum of inbound hyperlinks, and accordingly only the local structure of the web is exploited.
Our interest here is in the situation where the objects to be ranked are represented as vectors in Euclidean space, such as text or image data. Our goal is to rank the data with respect to the intrinsic global manifold structure [6, 7] collectively revealed by a huge amount of data. We believe for many real world data types this should be superior to a local method, which rank data simply by pairwise Euclidean distances or inner products.
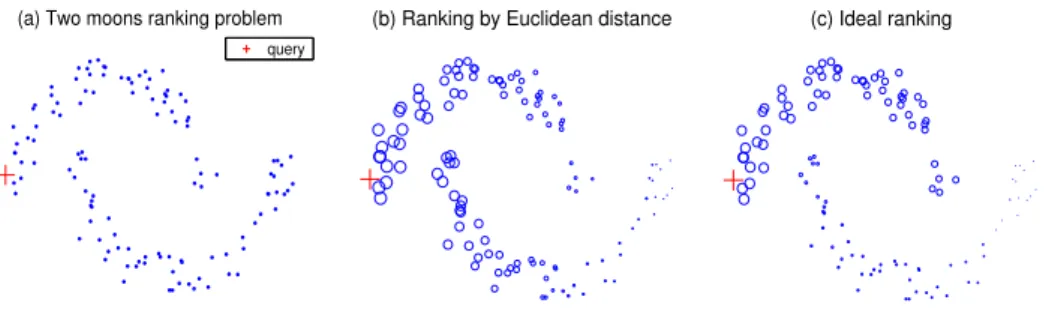
Let us consider a toy problem to explain our motivation. We are given a set of points constructed in two moons pattern (Figure 1(a)). A query is given in the upper moon, and the task is to rank the remaining points according to theirrelevancesto the query. Intuitively, the relevant degrees of points in the upper moon to the query should decrease along the moon shape. This should also happen for the points in the lower moon. Furthermore, all of the points in the upper moon should be more relevant to the query than the points in the lower moon. If we rank the points with respect to the query simply by Euclidean distance, then the left-most points in the lower moon will be more relevant to the query than the right-most points in the upper moon (Figure 1(b)). Apparently this result is not consistent with our intuition (Figure 1(c)).
(a) Two moons ranking problem query
(b) Ranking by Euclidean distance (c) Ideal ranking
Figure 1: Ranking on the two moons pattern. The marker sizes are proportional to the ranking in the last two figures. (a) toy data set with a single query; (b) ranking by the Euclidean distances; (c) ideal ranking result we hope to obtain.
structure of data. This method is derived from our recent research on semi-supervised learn-ing [8]. In fact the ranklearn-ing problem can be viewed as an extreme case of semi-supervised learning, in which only positive labeled points are available. An intuitive description of our method is as follows. We first form a weighted network on the data, and assign a positive ranking score to each query and zero to the remaining points which are ranked with respect to the queries. All points then spread their ranking score to their nearby neighbors via the weighted network. The spread process is repeated until a global stable state is achieved, and all points except queries are ranked according to their final ranking scores.
The rest of the paper is organized as follows. Section 2 describes the ranking algorithm in detail. Section 3 discusses the connections with PageRank. Section 4 further introduces a variant of PageRank, which can rank the data with respect to the specific queries. Finally, Section 5 presents experimental results on toy data, on digit image, and on text documents, and Section 6 concludes this paper.
2 Algorithm
Given a set of pointX ={x1, ..., xq, xq+1, ..., xn} ⊂Rm,the firstqpoints are the queries
and the rest are the points that we want to rank according to their relevances to the queries. Letd: X × X −→ Rdenote a metric onX, such as Euclidean distance, which assigns each pair of pointsxi andxi a distanced(xi, xj).Let f : X −→ Rdenote a ranking function which assigns to each point xi a ranking valuefi.We can viewf as a vector
f = [f1, .., fn]T. We also define a vectory = [y1, .., yn]T, in whichyi = 1 ifxi is a
query, andyi= 0otherwise. If we have prior knowledge about the confidences of queries, then we can assign different ranking scores to the queries proportional to their respective confidences.
The algorithm is as follows:
1. Sort the pairwise distances among points in ascending order. Repeat connecting the two points with an edge according the order until a connected graph is ob-tained.
2. Form the affinity matrixW defined byWij = exp[−d2(xi, xj)/2σ2]if there is
an edge linkingxiandxj.Note thatWii = 0because there are no loops in the graph.
3. Symmetrically normalizeW byS=D−1/2W D−1/2in whichDis the diagonal
4. Iteratef(t+ 1) =αSf(t) + (1−α)yuntil convergence, whereαis a parameter
in[0,1).
5. Letf∗
i denote the limit of the sequence{fi(t)}.Rank each pointxiaccording its
ranking scoresf∗
i (largest ranked first).
This iteration algorithm can be understood intuitively. First a connected network is formed in the first step. The network is simply weighted in the second step and the weight is symmetrically normalized in the third step. The normalization in the third step is necessary to prove the algorithm’s convergence. In the forth step, all points spread their ranking score to their neighbors via the weighted network. The spread process is repeated until a global stable state is achieved, and in the fifth step the points are ranked according to their final ranking scores. The parameterαspecifies the relative contributions to the ranking scores from neighbors and the initial ranking scores. It is worth mentioning thatself-reinforcement is avoided since the diagonal elements of the affinity matrix are set to zero in the second step. In addition, the information is spreadsymmetricallysinceSis a symmetric matrix.
About the convergence of this algorithm, we have the following theorem:
Theorem 1 The sequence{f(t)}converges tof∗=β(I−αS)−1y,whereβ= 1−α.
See [8] for the rigorous proof. Here we only demonstrate how to obtain such a closed form expression. Supposef(t)converges tof∗. Substitutingf∗ forf(t+ 1) andf(t)in the
iteration equationf(t+ 1) =αSf(t) + (1−α)y,we have f∗
=αf∗
+ (1−α)y, (1)
which can be transformed into
(I−αS)f∗
= (1−α)y.
Since(I−αS)is invertible, we have
f∗
= (1−α)(I−αS)−1
y.
Clearly, the scaling factorβdoes not make contributions for our ranking task. Hence the
closed form is equivalent to
f∗
= (I−αS)−1
y. (2)
We can use this closed form to compute the ranking scores of points directly. In large-scale real-world problems, however, we prefer using iteration algorithm. Our experiments show that a few iterations are enough to yield high quality ranking results.
3 Connection with Google
LetG= (V, E)denote a directed graph with vertices. LetW denote then×nadjacency matrixW,in whichWij= 1if there is a link inEfrom vertexxito vertexxj,andWij = 0
otherwise. Note thatW is possibly asymmetric. Define a random walk onGdetermined
by the following transition probability matrix
P = (1−)U+D−1
W, (3)
whereUis the matrix with all entries equal to1/n. This can be interpreted as a probability
of transition to an adjacent vertex, and a probability1−of jumping to any point on the
graph uniform randomly. Then the ranking scores overV computed by PageRank is given by the stationary distributionπof the random walk.
In our case, we only consider graphs which are undirected and connected. Clearly,W is
symmetric in this situation. If we also rank all points without queries using our method, as is done by Google, then we have the following theorem:
Theorem 2 For the task of ranking data represented by a connected and undirected graph without queries,f∗and PageRank yield the same ranking list.
Proof.We first show that the stationary distributionπof the random walk used in Google is
proportional to the vertex degree if the graphGis undirected and connected. Let1denote the1×nvector with all entries equal to 1. We have
1DP = 1D[(1−)U+D−1
W] = (1−)1DU+1DD−1
W
= (1−)1D+1W = (1−)1D+1D=1D.
Let vol Gdenote the volume ofG, which is given by the sum of vertex degrees. The
stationary distribution is then
π=1D/volG. (4)
Note thatπdoes not depend on. Henceπis also the the stationary distribution of the
random walk determined by the transition probability matrixD−1W.
Now we consider the ranking result given by our method in the situation without queries. The iteration equation in the fourth step of our method becomes
f(t+ 1) =Sf(t). (5)
A standard result [4] of linear algebra states that iff(0)is a vector not orthogonal to the principal eigenvector, then the sequence{f(t)} converges to the principal eigenvector of
S. Let1denotes then×1vector with all entries equal to1.Then
SD1/21
=D−1/2
W D−1/2
D1/21
=D−1/2
W1=D−1/2
D1=D1/21
.
Further, noticing that the maximal eigenvalue ofS is 1 [8], we know the principal
eigen-vector ofSisD1/21.Hence
f∗
=D1/21
. (6)
Comparing (4) with (6), it is clear thatf∗andπgive the same ranking list. This completes
our proof.
4 Personalized Google
Although PageRank is designed to rank all points without respect to any query, it is easy to modify for query-based ranking problems. LetP =D−1W.The ranking scores given by
PageRank are the elements of the convergence solutionπ∗of the iteration equation π(t+ 1) =αPTπ(t). (7)
By analogy with the algorithm in Section 2, we can add a query term on the right-hand side of (7) for the query-based ranking,
π(t+ 1) =αPTπ(t) + (1−α)y. (8)
This can be viewed as thepersonalizedversion of PageRank. We can show that the se-quence{π(t)} converges toπ∗
= (1−α)(I−αPT)−1y as before, which is equivalent
to
π∗
= (I−αPT)−1
y. (9)
Now let us analyze the connection between (2) and (9). Note that (9) can be transformed into
π∗
= [(D−αW)D−1
]−1
y=D(D−αW)−1
y.
In addition,f∗can be represented as f∗
= [D−1/2
(D−αW)D−1/2
]−1
y=D1/2
(D−αW)−1
D1/2
Hence the main difference betweenπ∗andf∗is that in the latter the initial ranking score yiof each queryxiis weighted with respect to its degree.
The above observation motivates us to propose a more general personalized PageRank algorithm,
π(t+ 1) =αPTπ(t) + (1−α)Dky, (11)
in which we assign differentimportanceto queries with respect to their degree. The closed form of (11) is given by
π∗
= (I−αPT)−1
Dky. (12)
Ifk= 0,(12) is just (9); and ifk= 1,we have
π∗
= (I−αPT)−1Dy=D(D−αW)−1Dy,
which is almost as same as (10).
We can also use (12) for classification problems without any modification, besides setting the elements ofyto 1 or -1 corresponding to the positive or negative classes of the labeled
points, and 0 for the unlabeled data. This shows the ranking and classification problems are closely related.
We can do a similar analysis of the relations to Kleinberg’s HITS [5], which is another popular web page ranking algorithm. The basic idea of this method is also to iteratively spread the ranking scores via the existing web graph. We omit further discussion of this method due to lack of space.
5 Experiments
We validate our method using a toy problem and two real-world domains: image and text. In our following experiments we use the closed form expression in whichαis fixed at0.99.
As a true labeling is known in these problems, i.e. the image and document categories (which is not true in real-world ranking problems), we can compute the ranking error using the Receiver Operator Characteristic (ROC) score [3] to evaluate ranking algorithms. The returned score is between 0 and 1, a score of 1 indicating a perfect ranking.
5.1 Toy Problem
We consider the toy ranking problem mentioned in the introduction section. The connected graph described in the first step of our algorithm is shown in Figure 2(a). The ranking scores with different time steps: t = 5,10,50,100are shown in Figures 2(b)-(e). Note that the
scores on each moon decrease along the moon shape away from the query, and the scores on the moon containing the query point are larger than on the other moon. Ranking by Euclidean distance is shown in Figure 2(f), which fails to capture the two moons structure. It is worth mentioning that simply ranking the data according to the shortest paths [7] on the graph does not work well. In particular, we draw the reader’s attention to the long edge in Figure 2(a) which links the two moons. It appears that shortest paths are sensitive to the small changes in the graph. The robust solution is to assemble all paths between two points, and weight them by a decreasing factor. This is exactly what we have done. Note that the closed form can be expanded asf∗=P
iαiSiy.
5.2 Image Ranking
We address a task of ranking on the USPS handwritten 16x16 digits dataset. Only a subset of digits from1to6is considered in this experiments. There are 1269, 929, 824, 852, 716 and 834 examples for each class, for a total of 5424 examples.
(a) Connected graph
Figure 2: Ranking on the pattern of two moons. (a) connected graph; (b)-(e) ranking with the different time steps:t= 5,10,50,100;(f) ranking by Euclidean distance.
2 4 6 8 10
0.99 0.992 0.994 0.996 0.998 1 # queries ROC
(a) Query digit 1
Manifold ranking Euclidean distance
2 4 6 8 10
0.6 0.65 0.7 0.75 0.8 0.85 0.9 0.95 1 # queries ROC
(b) Query digit 2
Manifold ranking Euclidean distance
2 4 6 8 10
0.6 0.65 0.7 0.75 0.8 0.85 0.9 0.95 1 # queries ROC
(c) Query digit 3
Manifold ranking Euclidean distance
2 4 6 8 10
0.6 0.65 0.7 0.75 0.8 0.85 0.9 0.95 1 # queries ROC
(d) Query digit 4
Manifold ranking Euclidean distance
2 4 6 8 10
0.6 0.65 0.7 0.75 0.8 0.85 0.9 0.95 1 # queries ROC
(e) Query digit 5
Manifold ranking Euclidean distance
2 4 6 8 10
0.6 0.65 0.7 0.75 0.8 0.85 0.9 0.95 1 # queries ROC
(e) Query digit 6
Manifold ranking Euclidean distance
Figure 3: ROC on USPS for queries from digits 1 to 6. Note that this experimental results also provide indirect proof of the intrinsic manifold structure in USPS.
Figure 4: Ranking digits in USPS. The top-left digit in each panel is the query. The left panel shows the top 99 by the manifold ranking; and the right panel shows the top 99 by the Euclidean distance based ranking. Note that there are many more2s with knots in the right panel.
We randomly select examples from one class of digits to be the query set over 30 trials, and then rank the remaining digits with respect to these sets. We use a RBF kernel with the widthσ= 1.25to construct the affinity matrixW,but the diagonal elements are set to
zero. The Euclidean distance based ranking method is used as the baseline: given a query set{xs}(s∈S), the pointsxare ranked according to that the highest ranking is given to the pointxwith the lowest score of mins∈Skx−xsk.
The results, measured as ROC scores, are summarized in Figure3; each plot corresponds to a different query class, from digit 1 to6 respectively. Our algorithm is comparable to the baseline when a digit1 is the query. For the other digits, however, our algorithm significantly outperforms the baseline. This experimental result also provides indirect proof of the underlying manifold structure in the USPS digit dataset [6, 7].
The top ranked 99 images obtained by our algorithm and Euclidean distance, with a random digit2 as the query, are shown in Figure4.The top-left digit in each panel is the query.
Note that there are some3s in the right panel. Furthermore, there are many curly2s in the right panel, which do not match well with the query: the2s in the left panel aremore similarto the query than the2s in the right panel. This subtle superiority makes a great deal of sense in the real-word ranking task, in which users are only interested in very few leading ranking results. The ROC measure is too simple to reflect this subtle superiority however.
5.3 Text Ranking
In this experiment, we investigate the task of text ranking using the 20-newsgroups dataset. We choose the topicrecwhich containsautos, motorcycles, baseballandhockeyfrom the version 20-news-18828.
The articles are processed by the Rainbow software package with the following options: (1) passing all words through the Porter stemmer before counting them; (2) tossing out any token which is on the stoplist of the SMART system; (3) skipping any headers; (4) ignoring words that occur in 5 or fewer documents. No further preprocessing was done. Removing the empty documents, we obtain 3970 document vectors in a 8014-dimensional space. Finally the documents are normalized into TFIDF representation.
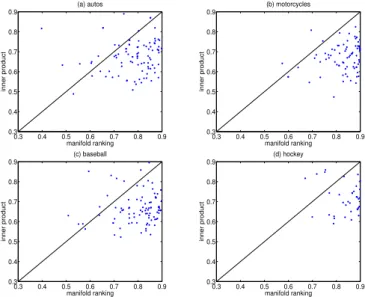
We use the ranking method based on normalized inner product as the baseline. The affinity matrixW is also constructed by inner product, i.e. linear kernel. The ROC scores for 100 randomly selected queries for each class are given in Figure5.
0.3 0.4 0.5 0.6 0.7 0.8 0.9 0.3
0.4 0.5 0.6 0.7 0.8
0.9 (a) autos
inner product
manifold ranking 0.3 0.4 0.5 0.6 0.7 0.8 0.9 0.3
0.4 0.5 0.6 0.7 0.8
0.9 (b) motorcycles
inner product
manifold ranking
0.3 0.4 0.5 0.6 0.7 0.8 0.9 0.3
0.4 0.5 0.6 0.7 0.8
0.9 (c) baseball
inner product
manifold ranking 0.3 0.4 0.5 0.6 0.7 0.8 0.9 0.3
0.4 0.5 0.6 0.7 0.8
0.9 (d) hockey
inner product
manifold ranking
Figure 5: ROC score scatter plots of 100 random queries from the categoryautos, motor-cycles, baseballandhockeycontained in the 20-newsgroups dataset.
6 Conclusion
Future research should address model selection. Potentially, if one was given a small la-beled set or a query set greater than size 1, one could use standard cross validation tech-niques. In addition, it may be possible to look to the theory of stability of algorithms to choose appropriate hyperparameters. There are also a number of possible extensions to the approach. For example one could implement aniterative feedbackframework: as the user specifies positive feedback this can be used to extend the query set and improve the ranking output. Finally, and most importantly, we are interested in applying this algorithm to wide-ranging real-word problems.
References
[1] R. Albert, H. Jeong, and A. Barabsi. Diameter of the world wide web. Nature, 401:130–131, 1999.
[2] S. Brin and L. Page. The anatomy of a large scale hypertextual web search engine. InProc. 7th International World Wide Web Conf., 1998.
[3] R. Duda, P. Hart, and D. Stork.Pattern Classification. Wiley-Interscience, 2nd edition, 2000. [4] G. H. Golub and C. F. Van Loan.Matrix Computations. Johns Hopkins University Press,
Balti-more, 1989.
[5] J. Kleinberg. Authoritative sources in a hyperlinked environment.JACM, 46(5):604–632, 1999. [6] S. T. Roweis and L. K. Saul. Nonlinear dimensionality reduction by locally linear embedding.
Science, 290:2323–2326, 2000.
[7] J. B. Tenenbaum, V. de Silva, and J. C. Langford. Global geometric framework for nonlinear dimensionality reduction.Science, 290:2319–2323, 2000.
[8] D. Zhou, O. Bousquet, T. N. Lal, J. Weston, and B. Sch¨olkopf. Learning with local and global consistency. In18th Annual Conf. on Neural Information Processing Systems, 2003.