Falling Behind or
Moving Up?
The Intergenerational
Progress of
Mexican Americans
• • •Jeffrey Grogger Stephen J. Trejo
2002
Library of Congress Cataloging-in-Publication Data Grogger, Jeffrey, 1959–
Falling behind or moving up? : the intergenerational progress of Mexican Americans / Jeffrey Grogger, Stephen J. Trejo.
p. cm.
Includes bibliographical references. ISBN 1-58213-049-3
1. Mexican Americans—Economic conditions. 2. Mexican Americans—Social conditions. 3. Mexican American families— Economic conditions. 4. Mexican American families—Social conditions. 5. Intergenerational relations—Economic aspects— United States. 6. Mexican Americans—Statistics. 7. United States—Economic conditions—2001- 8. United States—Social conditions—1980- I. Trejo, Stephen J., 1959– II. Title. E184.M5 G79 2002
305.868'72073—dc21 2002067929
Research publications reflect the views of the authors and do not necessarily reflect the views of the staff, officers, or Board of Directors of the Public Policy Institute of California. Copyright © 2002 by Public Policy Institute of California All rights reserved
San Francisco, CA
Short sections of text, not to exceed three paragraphs, may be quoted without written permission provided that full attribution is given to the source and the above copyright notice is included.
Foreword
The power of intergenerational progress is a central tenet of the American Dream: Each generation stands on the shoulders of the preceding one, and improvement in health, income, and well-being is assured through education and hard work. For immigrants,
intergenerational improvement is taken for granted—whether European immigrants at the turn of the twentieth century or Latino and Asian immigrants at the turn of the twenty-first century. With California’s population growing by 10 million residents in the past twenty years, and immigrants accounting for well over half of that growth, it has never been more important that the American Dream not lose its luster. Yet we face the prospect that future generations of Californians may not experience the rapid progress that earlier generations took for granted.
Building on earlier studies of Mexican Americans in California, Jeffrey Grogger and Stephen Trejo conclude that “intergenerational progress for Mexican Americans appears to stall after the second generation, with only modest improvement in educational attainment and no wage growth observed between the second and third
generations.” This is an important finding, and it needs further study to determine the precise nature and causes of the problem.
The authors analyze Mexican immigrants and U.S.-born Mexican Americans separately (as others should do when looking at California’s demographic trends), and they find that educational improvement is crucial to the earnings progress of all Mexican Americans because the schooling levels of people of Mexican descent lag behind those of almost all other groups in America.
There is no doubt that California faces a significant challenge in the coming decades. The burden will fall squarely on the shoulders of the K–12 education system to make sure that the schools, teachers, and curriculum are there to keep the American Dream alive for Mexican Americans, both immigrants and native born. And the ongoing public
iv
debate over the merits of immigration will rely heavily on a clear
understanding of how each new wave of arrivals is doing in achieving the dream.
Calculating the costs and benefits of immigration to California and the nation has become a regular exercise for special committees, commissions, and research centers and institutes. If intergenerational improvement in education, jobs, and earnings does not occur at a predictably high rate, the political pressure to more carefully monitor immigration will surely intensify. The findings in this report are a new and important contribution for those making the calculations, because Grogger and Trejo focus exclusively on Mexican Americans. Their initial findings do not present an especially hopeful portrait.
The findings also raise the prospect that widening income disparity in California will continue well into the future and perhaps will even generate a further widening of the gap between the top and bottom levels of the state’s income distribution. PPIC research fellow Deborah Reed concluded in her most recent analysis of income disparity in the state that the “growing overrepresentation of immigrants in the bottom categories [of wages] has contributed strongly to rising income inequality in California.” While many Mexican American immigrants start out at the bottom of the wage scale, it is neither desirable nor expected that they will languish there for two more generations. Grogger and Trejo suggest that this prospect is a real possibility for some, and that public policy must be finely tuned to offset this possibility.
Numerous studies have focused on the rate and degree to which current waves of immigrants are integrated into the political economy of America. One review, carried out by the National Research Council in a
report entitled The New Americans: Economic, Demographic, and Fiscal
Effects of Immigration, concludes that the integration of new immigrants and subsequent generations is highly correlated with education and the wage gains that are associated with returns to skill. Again, all roads lead to education—whether the roads relate to higher earnings, reduced income disparity, or participation in civic life.
This work by Grogger and Trejo is a substantial contribution to our understanding of the intergenerational progress of Mexican Americans and the issues that are raised by the prospect that, for some families, the
American Dream might be a bridge too far. There is much to be learned from future work on this subject, and Grogger and Trejo have already focused the spotlight on a key topic for the economic, social, and political future of California: What are the prospects for Mexican Americans and what role will public policy play in keeping the California version of the American Dream alive? The authors’ findings suggest that the challenge is great and that there is every good reason to focus public attention on the resources that are needed to educate current and future generations of Mexican Americans.
David W. Lyon President and CEO
Summary
Mexican immigrants and their descendants constitute a sizable and rapidly growing segment of the U.S. population. This is particularly true in California, where over 20 percent of the population is of Mexican descent.
Mexican Americans are also one of the most economically disadvantaged groups in the United States, with an average household income that is more than 40 percent below the comparable average for
non-Hispanic whites.1 Disagreement persists over the prospects for
Mexican Americans joining the economic mainstream of American society. Chavez (1991) claims that the large influx of recent immigrants from Mexico creates a deceptively pessimistic picture of Mexican-origin workers in the U.S. labor market, and that U.S.-born, English-speaking Mexican Americans have enjoyed rapid progress over the last couple of decades and are approaching the labor market status of non-Hispanic whites. According to Chavez, Mexican Americans are climbing the economic ladder across generations in the same way as earlier waves of white immigrants from Europe. In contrast, Chapa (1990) sees little evidence that Mexican Americans are making steady progress toward economic parity with non-Hispanic whites, and he worries about the emergence of a Chicano underclass with many of the same problems faced by inner-city blacks.
To better understand the current and future economic prospects of Mexican Americans, we analyze the intergenerational progress of
Mexican-origin workers in the California and U.S. labor markets. In the first part of our report, we use recent data from the Current Population Survey (CPS) to compare the educational attainment and hourly earnings
_________
1In this report, we refer to people of Mexican descent living in the United States as
Mexican Americans. We distinguish between Mexican immigrants and U.S.-born Mexican Americans only when the distinction is germane to the discussion.
viii
of whites, blacks, and three generations of Mexican Americans (with the first generation consisting of Mexican immigrants, the second generation including the U.S.-born children of Mexican immigrants, and the third generation referring to their grandchildren and later descendants). We find that people of Mexican descent acquire much less schooling than other groups in the United States, and that this educational deficit is the main reason for the relatively low earnings of Mexican-origin workers. Thus, the fundamental economic problem confronting Mexican
Americans is insufficient schooling. In the second part of our report, we try to learn more about this important problem. We use data from the National Education Longitudinal Study (NELS) to examine in detail the determinants of racial and ethnic differences in a key educational
outcome: high school graduation.2
Education and Wage Patterns
The main empirical findings of the first part of our report are as follows:
1. Mexican Americans experience dramatic gains in education and earnings between the first and second generations. On average, U.S.-born Mexican Americans have three and a half years more schooling and at least 30 percent higher wages than do Mexican immigrants.
2. Intergenerational progress for Mexican Americans appears to stall after the second generation, with only modest improvement in educational attainment and no wage growth observed between the second and third generations. A possible reason is that the intergenerational transmission of education is much weaker among Mexican Americans than among other groups. As a result, the dramatic gains between immigrants and their children do not translate into additional gains for subsequent generations. 3. Substantial education and wage deficits persist between
U.S.-born Mexican Americans and other Americans. Among the _________
2Both the CPS and NELS surveys include data from undocumented immigrants,
third generation, for example, Mexican Americans average a year and a half less schooling and about 25 percent lower wages than non-Hispanic whites.
4. The educational disadvantage of Mexican-origin workers is the principal reason why they earn less than other U.S. workers. Among men and women born in the United States, racial/ethnic differences in observable indicators of skill—in this case, age and years of schooling—explain from one-half to three-quarters of the wage gaps between Mexican and white workers, with
schooling accounting for most of the difference.3 By contrast,
observable skill differences account for only about one-third of black-white wage gaps.
5. The labor market payoff to acquiring a high school diploma through an equivalency exam such as the GED, rather than through the usual coursework, is substantially higher for Mexican immigrants than for U.S.-born workers of any race/ethnicity.
Determinants of High School Graduation
Immigration plays a tremendous role in the white-Mexican graduation gap, even among young cohorts of workers. Youths who immigrate to the United States between the ages of 15 and 21 have high school completion rates of only 28 percent, in contrast to the 87 percent completion rate of U.S.-born whites and the 78 percent completion rate of U.S.-born blacks. Mexican youths who arrive in the United States between the ages of 5 and 15 do only a bit better, eventually completing high school at a rate of only 40 percent.Children who arrive before age 5 do much better; about 78 percent eventually complete high school. Indeed their graduation rates are similar to those of both U.S.-born students of Mexican heritage and blacks. Within their age cohort, these U.S.-born and “near-native” students of Mexican heritage compose about 65 percent of all persons of
_________
x
Mexican heritage in the United States. We analyze a number of factors to understand why this group graduates at lower rates than whites.
Consistent with prior findings on minority-white attainment differentials, we find that family income plays an important role, explaining as much as 75 percent of the white-Mexican graduation gap. However, independent of income, maternal education plays a very small role, despite the fact that the parents of Mexican American students have very low education levels. The reason is that, for this group, maternal education has little independent effect on students’ graduation prospects. This finding helps resolve the heretofore puzzling observation that the educational progress of Mexican Americans seems to stall between the second and third generations. If the intergenerational transmission of education were as strong among Mexican Americans as among other groups, then the dramatic gains in education between immigrants and their children would translate into further progress among later
generations. Since the transmission mechanism for Mexican Americans is so weak, educational progress largely stops with the children of immigrants. These results contrast to those for blacks, for whom maternal education strongly predicts graduation and explains an important fraction of the black-white graduation gap, even controlling for family income.
We also consider the role of a number of variables that may reflect the results of parents’ actions to influence the educational environment facing their children. Familial communication, social capital, and after-school care arrangements prove helpful both in predicting graduation and in explaining the family income effect for students of Mexican heritage. Some literacy-related measures such as library use and the possession of reading and reference materials are less important for Mexican American students than they are for whites and blacks, however. There is some indirect evidence that part of the family income effect for Mexican American families operates through the schools that their children attend.
In general, our results point to the importance of family background for explaining graduation rates and graduation rate differentials. We identify some of the factors that underlie the link between parental education, family income, and children’s educational success. The results
leave many further questions, however, such as why certain family characteristics matter more for some racial/ethnic groups than for others. Although it is fairly clear that family characteristics bear importantly on children’s educational success, more work is needed to better understand why.
Conclusions and Implications
An important implication of our findings is that Mexican
immigrants and U.S.-born Mexican Americans are distinct groups with very different skills and labor market opportunities. Therefore, analyses that do not distinguish between these groups can give a misleading impression of Mexican economic progress in the United States.
Although perhaps an obvious point, and not a new one, it bears repeating because many media and policy discussions of Mexican Americans continue to lump together immigrants and U.S. natives. Given the strikingly low education and wages of Mexican immigrants, aggregation masks the substantial intergenerational gains that occur. The experiences of second- and third-generation Mexican Americans reveal the long-term economic prospects of the Mexican-origin population, and these
prospects are considerably brighter than what is suggested by statistics that do not distinguish between foreign-born immigrants and U.S.-born Mexican Americans.
Our findings also indicate that increasing educational attainment is the key to improving the economic status of Mexican Americans. That more and better schooling would help any group has the ring of a truism, especially in times of rising demand for skilled workers. But educational improvements are crucial to the earnings progress of Mexican Americans to a much larger extent than for blacks and other disadvantaged groups, because their schooling levels lag behind those of almost all other groups in America. Moreover, the economic payoff to educational investments is about as high for U.S.-born Mexican Americans as for other U.S. natives, especially in California. Finding a way to somehow eliminate the educational disadvantage of Mexican Americans would go a long way toward bringing this group into the economic mainstream. For Mexican immigrants who arrive as teenagers or adults, the GED is a promising avenue for increasing education and ultimate earnings. The GED seems
xii
to provide a mechanism through which immigrants can certify their educational qualifications for U.S. employers who do not know how to evaluate credentials earned in Mexico or other foreign countries.
Contents
Foreword... iii
Summary... vii
Tables... xv
Acknowledgments ... xix
1. INTRODUCTION... 1
2. EDUCATIONAL PATTERNS ... 5
Data... 5
Educational Outcomes ... 11
3. LABOR MARKET SUCCESS ... 19
Data... 19
Wage Comparisons... 21
Wage Determinants ... 26
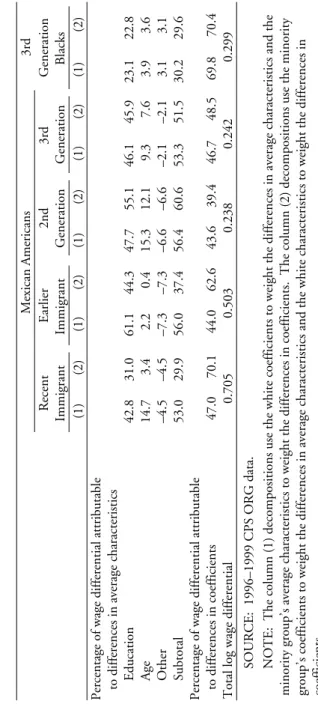
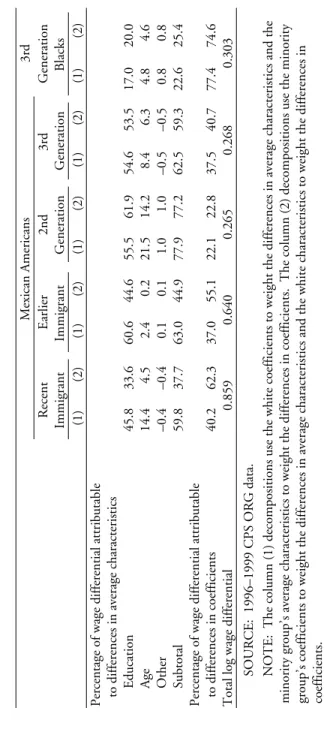
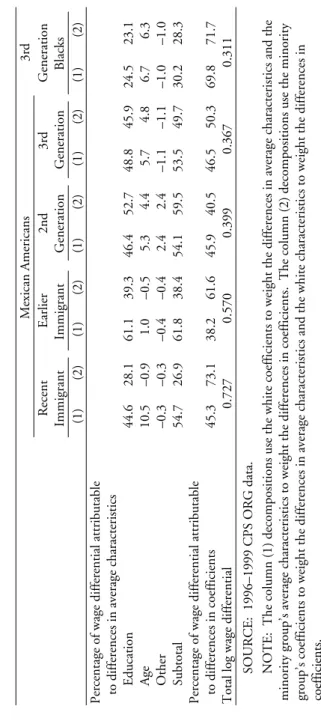
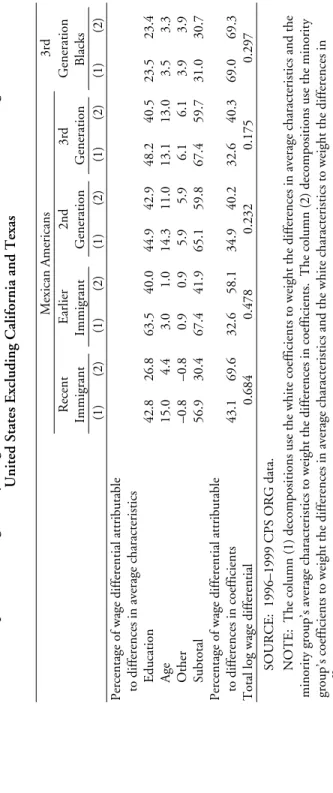
Wage Decompositions ... 36
4. DETERMINANTS OF HIGH SCHOOL GRADUATION... 51
Data... 52
Some Background on the NELS... 52
High School Graduation and Family Background... 54
Regression Results ... 56
The Importance of Family Background ... 56
The Role of Parental Influences ... 62
The Role of Schools... 72
Conclusions ... 77
5. CONCLUSIONS AND IMPLICATIONS FOR POLICY.. 79
Education and Wage Patterns... 79
Determinants of High School Graduation ... 81
Appendix A. Supplementary Tables... 83
xiv
Bibliography ... 103
About the Authors... 109
Tables
2.1. Race/Ethnicity Among Men and Women Ages 15 and
Older, United States and California ... 9
2.2. Race/Ethnicity and Generation Among Men and Women Ages 15 and Older, United States and
California... 9
2.3. Educational Attainment, by Race/Ethnicity and
Generation, Ages 25–59, U.S. Total ... 12
2.4. Educational Attainment, by Race/Ethnicity and
Generation, Ages 25–59, California ... 14
2.5. Educational Attainment, by Race/Ethnicity and
Generation, Ages 25–59, Texas ... 15
2.6. Educational Attainment, by Race/Ethnicity and Generation, Ages 25–59, United States Excluding
California and Texas... 16
3.1. Percentage Employed During Survey Week, by
Race/Ethnicity and Generation, Ages 25–59... 20
3.2. Log Hourly Wage Differentials, Relative to 3rd+ Generation Whites, by Race/Ethnicity and Generation,
Ages 25–59, U.S. Total ... 22
3.3. Log Hourly Wage Differentials, Relative to 3rd+ Generation Whites, by Race/Ethnicity and Generation,
Ages 25–59, California... 25
3.4. Log Hourly Wage Differentials, Relative to 3rd+ Generation Whites, by Race/Ethnicity and Generation,
Ages 25–59, Texas ... 25
3.5. Log Hourly Wage Differentials, Relative to 3rd+ Generation Whites, by Race/Ethnicity and Generation, Ages 25–59, United States Excluding California and
Texas... 26
3.6. Linear Returns to Education, by Race/Ethnicity and
xvi
3.7. Nonlinear Returns to Education, by Race/Ethnicity
and Generation, Ages 25–59, U.S. Total ... 29
3.8. Nonlinear Returns to Education, by Race/Ethnicity
and Generation, Ages 25–59, California ... 30
3.9. Nonlinear Returns to Education, by Race/Ethnicity
and Generation, Ages 25–59, Texas ... 31
3.10. Nonlinear Returns to Education, by Race/Ethnicity and Generation, Ages 25–59, United States Excluding
California and Texas... 32
3.11. Returns to a GED, by Race/Ethnicity and Generation,
Ages 25–59, U.S. Total ... 33
3.12. Returns to Age, by Race/Ethnicity and Generation,
Ages 25–59, U.S. Total ... 35
3.13. Returns to Age, by Race/Ethnicity and Generation,
Ages 25–59, California... 36
3.14. Returns to Age, by Race/Ethnicity and Generation,
Ages 25–59, Texas ... 37
3.15. Returns to Age, by Race/Ethnicity and Generation, Ages 25–59, United States Excluding California and
Texas... 38
3.16. Decomposition of Log Hourly Wage Differentials Relative to 3rd+ Generation Whites, Men Ages 25–59,
U.S. Total... 40
3.17. Decomposition of Log Hourly Wage Differentials Relative to 3rd+ Generation Whites, Men Ages 25–59,
California... 43
3.18. Decomposition of Log Hourly Wage Differentials Relative to 3rd+ Generation Whites, Men Ages 25–59,
Texas... 44
3.19. Decomposition of Log Hourly Wage Differentials Relative to 3rd+ Generation Whites, Men Ages 25–59,
United States Excluding California and Texas... 45
3.20. Decomposition of Log Hourly Wage Differentials Relative to 3rd+ Generation Whites, Women Ages
25–59, U.S. Total... 46
3.21. Decomposition of Log Hourly Wage Differentials Relative to 3rd+ Generation Whites, Women Ages
3.22. Decomposition of Log Hourly Wage Differentials Relative to 3rd+ Generation Whites, Women Ages
25–59, Texas... 48
3.23. Decomposition of Log Hourly Wage Differentials Relative to 3rd+ Generation Whites, Women Ages
25–59, United States Excluding California and Texas ... 49
4.1. Means of Family Characteristics, by Race and
Ethnicity ... 55
4.2. High School Graduation Regressions, by
Race/Ethnicity... 57
4.3. Oaxaca Decomposition of High School Graduation
Differentials ... 60
4.4. Indicators of Parental Influence on Students’ Education,
by Maternal Education and Family Income ... 63
4.5. Indicators of Parental Influence on Students’ Education,
by Race/Ethnicity... 65
4.6. High School Graduation Regressions Including Indicators of Parental Influence on Students’
Education... 67
4.7. Oaxaca Decomposition of High School Graduation Differentials from Regressions that Control for Parental
Influences... 71
4.8. High School Graduation Regressions with School Fixed
Effects... 73
4.9. Decomposition of High School Graduation Differentials from Regressions That Control for Parental Influences
and School Fixed Effects ... 76
A.1. Sample Sizes for CPS Education and Employment
Analyses in Tables 2.3 to 3.1, Ages 25–59 ... 83
A.2. Sample Sizes for CPS Wage Analyses in Tables 3.2 to
3.23, Wage and Salary Workers, Ages 25–59 ... 84
A.3. Standard Errors for Hourly Wage Differentials in Table
3.2, U.S. Total... 85
A.4. Standard Errors for Hourly Wage Differentials in Table
3.3, California... 85
A.5. Standard Errors for Hourly Wage Differentials in Table
xviii
A.6. Standard Errors for Hourly Wage Differentials in Table
3.5, United States Excluding California and Texas... 86
A.7. Standard Errors for Linear Returns to Education in
Table 3.6 ... 87
A.8. Standard Errors for Nonlinear Returns to Education
Table 3.7, U.S. Total... 88
A.9. Standard Errors for Nonlinear Returns to Education in
Table 3.8, California... 89
A.10. Standard Errors for Nonlinear Returns to Education in
Table 3.9, Texas... 90
A.11. Standard Errors for Nonlinear Returns to Education in Table 3.10, United States Excluding California and
Texas... 91
A.12. Standard Errors for Returns to Age in Table 3.12, U.S.
Total... 92
A.13. Standard Errors for Returns to Age in Table 3.13,
California... 93
A.14. Standard Errors for Returns to Age in Table 3.14,
Texas... 94
A.15. Standard Errors for Returns to Age in Table 3.15,
United States Excluding California and Texas... 95
B.1. High School Completion Rates in the October 1994
CPS and the NELS... 98
B.2. High School Completion Rates, by Race/Ethnicity and
Acknowledgments
This report has benefited from advice and comments by Melissa Binder, Gary Bjork, Hans Johnson, Meredith Phillips, Deborah Reed, Cordelia Reimers, and Belinda Reyes. We are grateful for their help and also for the outstanding research assistance of Duncan MacRae.
Nevertheless, the authors are solely responsible for the content of this report.
1. Introduction
Mexican immigrants and their descendants constitute a sizable and rapidly growing segment of the U.S. population. This is particularly true in California, where over 20 percent of the population is Mexican American.1 Mexican Americans are also one of the most economically disadvantaged groups in the United States, with an average household income that is more than 40 percent below the comparable average for non-Hispanic whites.2
Disagreement persists over the prospects for Mexican Americans joining the economic mainstream of American society. Chavez (1991) claims that the large influx of recent immigrants from Mexico creates a deceptively pessimistic picture of Mexican-origin workers in the U.S. labor market and that U.S.-born, English-speaking Mexican Americans have enjoyed rapid progress over the last couple of decades and are approaching the labor market status of non-Hispanic whites. According to Chavez, Mexican Americans are climbing the economic ladder across generations in the same way as earlier waves of white immigrants from Europe. In contrast, Chapa (1990) sees little evidence that Mexican Americans are making steady progress toward economic parity with non-Hispanic whites, and he worries about the emergence of a Chicano underclass with many of the same problems faced by inner-city blacks.
Existing research provides some empirical support for each side of this debate. On the one hand, as stressed by Chavez (1991), dramatic improvements in human capital and earnings take place between Mexican immigrants and the U.S.-born children of immigrants (Smith, 1991). On the other hand, intergenerational progress appears to stall
____________
1In this report, we refer to people of Mexican descent living in the United States as
Mexican Americans. We distinguish between Mexican immigrants and U.S.-born Mexican Americans only when the distinction is germane to the discussion.
2This income comparison is based on calculations from March 1996–1999 Current
2
after the second generation (Trejo, 1997), leaving third- and higher-generation Mexican Americans trailing the education and earnings of the average American to an extent that justifiably concerns Chapa (1990).
To better understand the current and future economic prospects of Mexican Americans, we analyze in detail the intergenerational progress of Mexican-origin workers in the California and U.S. labor markets, focusing on the key issues raised by previous research. Using microdata from the CPS and the National Education Longitudinal Study (NELS), we seek to shed light on the following questions:
1. How do the education and earnings of Mexican Americans change across generations in the United States (i.e., as we compare first-generation immigrants with their second-generation children and third-second-generation grandchildren)? 2. Why do Mexican-origin workers earn low wages in the U.S.
labor market?
3. Why do Mexican Americans, even those born in the United States, acquire less schooling than almost any other ethnic group in America?
4. In terms of educational and labor market outcomes, do Mexican Americans fare differently in California than elsewhere in the United States?
Given the large and growing presence of Mexican Americans in California’s population, workforce, and schools, answers to these questions are crucial for state policy. Indeed, recent economic
transformations have heightened the policy significance of the research reported here. In particular, earnings inequality and the labor market returns to various dimensions of worker skill have increased dramatically in the United States over the past two decades (Levy and Murnane, 1992; Murphy and Welch, 1992; Juhn, Murphy, and Pierce, 1993). These trends have been even more prominent in California, where there has been a sharper decline in income at the middle to lowest levels of the distribution (Reed, Haber, and Mameesh, 1996; Reed, 1999; Betts, 2000). The low levels of education and other skills possessed by Mexican-origin workers make them especially vulnerable to these ongoing changes in the wage structure. As a result, it is imperative to
understand how the economic opportunities available to California’s Mexican population evolve across generations. Equally important, we need to know why high school dropout rates remain stubbornly high for Mexican Americans even as the labor market prospects for less-educated workers become more and more limited.3
Our study proceeds as follows. Using 1996–1999 data from the CPS, the next two chapters describe the economic situation of Mexican Americans in California and the United States. Chapter 2 documents the substantial educational disadvantage of Mexican Americans, and Chapter 3 shows that this schooling deficit is the principal reason why Mexican-origin workers earn low wages. In Chapter 4, we analyze NELS data to examine in detail the determinants of racial and ethnic differences in a key educational outcome: high school graduation. Chapter 5 summarizes our findings and highlights the potential implications for public policy.
____________
3Reyes (2001) provides a wealth of descriptive information on economic and social
2. Educational Patterns
In this and the following chapter, we use the latest available data to describe the economic situation of Mexican Americans in California and the United States. This chapter highlights the low schooling level of this group, even U.S.-born Mexican Americans, and the following chapter shows that this education deficit is primarily responsible for the relatively low wages earned by Mexican-origin workers in the U.S. labor market. In both chapters, we explore patterns of intergenerational progress, using comparisons between Mexican immigrants, the U.S.-born children of Mexican immigrants, and the later generations of Mexican Americans.
Data
In this chapter and the next, we analyze microdata from the 1996– 1999 outgoing rotation group (ORG) files of the CPS. The CPS is a monthly survey of about 50,000 households that the U.S. government uses to estimate unemployment rates and other indicators of labor market activity. In addition to the detailed demographic and labor force data reported for all respondents, the CPS collects earnings information from one-quarter of the sample. The data we analyze come from these monthly earnings samples.1
Unlike the decennial Census, which in 1980 began collecting birthplace information only for the respondent, recent CPS data also report the countries of birth of the respondent’s parents. With the CPS data, we can distinguish between three generation groups. The first generation consists of immigrants: foreign-born individuals whose parents were also born outside the United States. The second generation includes U.S.-born individuals who have at least one foreign-born parent. The designation “third and higher generation” applies to U.S. natives
____________
1The CPS data come from national probability samples, and all of the calculations we report in this chapter and the next make use of the CPS sampling weights.
6
whose parents are also natives.2 For ease of exposition, we will often refer to this last group as the “3rd+ generation” or simply the third
generation.3
Before turning to the empirical analysis, let us mention a few issues that may affect interpretation of the intergenerational comparisons reported here. First, our intergenerational comparisons are cross-sectional because they do not attempt to match immigrant parents with their U.S.-born children who enter the labor market a couple of decades later. Instead, we compare first-, second-, and third-generation Mexican Americans at a single point in time (1996–1999). An alternative
approach would be to use data from successive time periods and compare immigrant adults in some initial period with their grown-up descendants 20 or more years later. Each approach has advantages and disadvantages. One benefit of the cross-sectional approach is that using data from a single time period holds constant the social and economic environment, whereas the alternative approach can give misleading results when conditions change over time. For example, the civil rights movement may have generated economic gains for all generations of Mexican Americans over the 1970s and 1980s. If so, then the improvements in education and earnings observed between Mexican immigrants in the 1960s and their U.S.-born children in the 1990s would overstate the amount of progress that is solely due to being a second-generation Mexican who grew up in the United States, rather than a first-generation Mexican who grew up south of the border.
On the other hand, Borjas (1993) cautions that cross-sectional comparisons of generations can be misleading if there are important skill differences between immigrant cohorts and these differences are at least partially transmitted to the U.S.-born children of immigrants. In particular, there is evidence that recent cohorts of Mexican immigrants
____________
2A few individuals were born abroad of American parents. We treat these individuals as U.S. natives, because they automatically receive U.S. citizenship as the children of Americans. Therefore, these individuals are assigned to our so-called “third generation” category consisting of U.S. natives whose parents are also natives.
3For Mexicans, this group consists primarily of individuals who are indeed third generation, whereas among non-Hispanic whites, most people we refer to as third generation actually belong to higher generations (Borjas, 1994, Tables 1 and 2).
came to the United States with fewer skills than preceding cohorts (Borjas, 1995). Consequently, cross-sectional comparisons between first-and second-generation Mexican Americans may exaggerate the amount of intergenerational progress, because second-generation Mexican Americans currently in the labor market inherited their abilities and skills from earlier immigrant cohorts who were more successful than the immigrant cohorts now at work are likely to be. For the same reason, cross-sectional comparisons between second- and third-generation Mexican Americans may be biased in favor of the third generation, although this presumes that the skill decline observed for postwar cohorts of Mexican immigrants continues back well into the first half of the 20th century.
Selective return migration can produce similar biases. If, for example, unsuccessful immigrants have a greater tendency to return eventually to their home country, then as an immigrant arrival cohort ages in the United States, it becomes increasingly represented by more successful, higher-earning individuals. This process can generate inflated estimates of immigrant labor market assimilation and might also distort intergenerational comparisons, to the extent that the children of immigrants who remain here inherit some of their parents’ selectivity. Available evidence on the selectivity of return migration is mixed, however. Overall, most research suggests that the least successful immigrants are most likely to leave the United States (Borjas, 1989; Hu, 1999; Lubotsky, 2000), but Jasso and Rosenzweig (1988) find the opposite. Of greatest relevance for the current study, Hu (1999) reports that return migration selectivity is important for non-Hispanic
immigrants but not for Hispanic immigrants, whereas Reyes (1997) finds that the least-educated and lowest-paid immigrants from western Mexico are most likely to return.
Another issue is that ethnic identification is to some extent endogenous, especially among people at least one or two generations removed from immigration to the United States (Waters, 1990). Consequently, the descendants of Mexican immigrants who continue to identify themselves as Mexican-origin in the third and higher generations may be a select group. In particular, if the most successful Mexican Americans are more likely to intermarry or for other reasons cease to
8
identify themselves or their children as Hispanic, then available data may understate human capital and earnings gains between the second and third generations. Although outside the scope of the current report, an important question for future research is whether this phenomenon can explain why the economic progress of Mexican Americans appears to stall after the second generation.
To set the stage for our analysis, Tables 2.1 and 2.2 show how the population varies by race/ethnicity and generation in the 1996–1999 CPS data, both for the nation as a whole and separately for California. These calculations are for men and women ages 15 and older.4 The racial/ethnic categories are defined to be mutually exclusive.5
For the United States as a whole, non-Hispanic whites compose almost three-quarters of the population, with the largest minority groups being blacks (12 percent) and Hispanics (10 percent). Asians and Native Americans represent much smaller segments of the U.S. population. Among Hispanics, Mexican Americans are the dominant subgroup, comprising over 60 percent of all Hispanics in the United States.
In California, Hispanics constitute more than one-quarter of the population, and Asians also account for a sizable share (12 percent). Over 80 percent of California’s Hispanics are of Mexican descent, implying that one in five Californians is Mexican American. Other Hispanics in California originate primarily from Central and South America (representing 14 percent of California’s Hispanic population and 4 percent of the overall California population).
____________
4The calculations in Table 2.1 are based on a sample of 1,139,207 individuals for the entire United States, with 94,301 of these individuals residing in California. The sample sizes for Table 2.2 are 878,980 whites, 110,877 blacks, and 56,054 Mexicans for the entire United States, and 50,595 whites, 6,018 blacks, and 20,096 Mexicans for California alone.
5Like the Census, the CPS has separate questions regarding race and “Spanish origin.” We label as Hispanic any respondents who indicate membership in a origin group, and we further designate as Mexican those who choose one of the Spanish-origin categories “Mexican American,” “Chicano,” or “Mexican (Mexicano).” Non-Hispanics are assigned an ethnic category on the basis of their response to the race question. Therefore, our categorization of “ethnic” groups is really a categorization of “racial/ethnic” groups, but we will use the terms “ethnic” or “ethnicity” as shorthand for this categorization.
Table 2.1
Race/Ethnicity Among Men and Women Ages 15 and Older, United States and California
Racial/Ethnic Group
% of U.S. Population
% of California Population
White 73.9 54.3
Black 11.6 6.5
Native American 0.7 0.8
Asian 3.6 11.8
Hispanic 10.1 26.6
Total 100.0 100.0
Hispanic Group
% of U.S. Hispanics
% of California Hispanics
Mexican 62.1 81.1
Puerto Rican 10.1 1.1
Cuban 5.0 0.8
Central/South American 15.4 13.8
Other Hispanic 7.4 3.2
Total 100.0 100.0
SOURCE: 1996–1999 CPS ORG data.
NOTE: Numbers in the tables throughout this report may not sum to 100.0 percent because of rounding.
Table 2.2
Race/Ethnicity and Generation Among Men and Women Ages 15 and Older, United States and California (in percent)
Racial/Ethnic Group
Recent Immigrant
Earlier Immigrant
2nd Generation
3rd+
Generation Total
United States
Whites 1.3 2.8 8.6 87.2 100.0
Blacks 2.8 4.1 2.3 90.8 100.0
Mexican Americans 21.3 27.6 22.2 28.9 100.0
California
Whites 2.8 6.2 12.0 79.0 100.0
Blacks 2.4 3.0 2.6 92.0 100.0
Mexican Americans 21.9 35.2 23.5 19.5 100.0
SOURCE: 1996–1999 CPS ORG data.
NOTE: Recent immigrants are defined as those who arrived in the United States within approximately 10 years of the survey date.
10
In this report, we study the Mexican-origin population, and for comparison purposes we include whites and blacks in the analyses. Table 2.2 presents the distribution of the population across generations for these three racial/ethnic groups. We split the first generation into “recent immigrants” who have been in the United States for 10 years or less and “earlier immigrants” who have spent more than 10 years here. This table reveals that the overwhelming majority of Mexican Americans come from families that have been in this country for no more than two generations. In particular, about half of Mexican Americans are foreign-born and another fifth have at least one immigrant parent. By contrast, only 13 percent of whites and 9 percent of blacks are of the first or second generation. The pattern is similar but accentuated in California, where the Mexican American population has a larger proportion of earlier immigrants and a smaller proportion of third-generation individuals than in the entire United States. Among whites, California also has higher population shares in the first and second generations than does the nation as a whole.
In addition to being dominated by immigrants and the sons and daughters of immigrants, the Mexican-origin population in the United States has another important feature—its geographic concentration. California is the state of residence for 41 percent of Mexican Americans in the United States and Texas is home to another 30 percent.
Therefore, over 70 percent of the Mexican-origin population in the United States lives in just two states. If we also include the sizable clusters of Mexican Americans residing in Arizona, Illinois, Colorado, and New Mexico, we find that more than 85 percent of the Mexican American population is concentrated in six states.6 To explore geographic variation in Mexican American outcomes, many of the analyses presented below for the United States as a whole are also reported for the following three regions: California, Texas, and the remainder of the country. However, our discussion focuses on the results for the entire United States, because these results are based on the largest samples and also because the region-specific results can be affected by selective migration within the United States. If, for example,
second-____________
and later-generation Mexican Americans tend to move away from the enclaves favored by Mexican immigrants, then intergenerational comparisons of those Mexican Americans confined to a particular state such as California or Texas might yield misleading patterns.
Educational Outcomes
Tables 2.3 to 2.6 examine educational attainment, which is a key determinant of how workers fare in the U.S. labor market.7 We here limit the sample to individuals ages 25–59, and we report separate calculations for men and women. These tables show average completed years of schooling, as well as the distribution of the population across various mutually exclusive and exhaustive education categories.8 Mexican Americans are disaggregated by generation, and comparable statistics are presented for third-generation whites and blacks. Third-generation whites provide a yardstick for measuring Mexican American outcomes against those of the primary native “majority” group in American society, and third-generation blacks are an important native “minority” group that is instructive to compare with Mexican Americans.
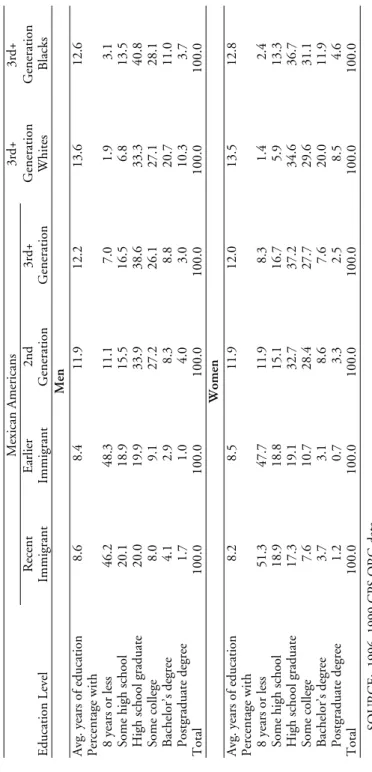
Table 2.3 reports these education statistics for the United States as a whole. The patterns for men and women are similar. First, the
educational attainment of Mexican immigrants is strikingly low. Foreign-born Mexican immigrants possess on average only about eight and a half years of schooling, with over 65 percent of this population lacking a high school diploma and less than 5 percent having completed
____________
7Sample sizes for the gender, race/ethnicity, and generation cells in Tables 2.3 to 2.6 are reported in Appendix Table A.1. For the United States as a whole, the sample sizes are large, yielding precise estimates of outcomes. In the top half of Table 2.3, for example, sample sizes for the various generations of Mexican men range from 2,500 to 6,500. The sample size is 25,000 for third-generation black men and over 200,000 for third-generation white men. The sample sizes for women are similar. Of course, sample sizes are smaller for subregions of the United States.
8In CPS data, the category “high school graduate” includes those who completed high school by means of an equivalency exam (such as the General Equivalency Diploma, or GED) in addition to those who followed the traditional route of taking a set of courses that culminates in graduation at the end of twelfth grade. The category “postgraduate degree” represents those who completed college and subsequently earned a graduate or professional degree.
Table 2.3
Educational Attainment, by Race/Ethnicity and Generation, Ages 25–59, U.S. Total
Mexican Americans 3rd+ 3rd+ Education Level Recent Immigrant Earlier Immigrant 2nd Generation 3rd+ Generation Generation Whites Generation Blacks Men
Avg. years of education
8.6 8.4 11.9 12.2 13.6 12.6
Percentage with 8 years or less
46.2 48.3 11.1 7.0 1.9 3.1
Some high school
20.1 18.9 15.5 16.5 6.8 13.5
High school graduate
20.0 19.9 33.9 38.6 33.3 40.8 Some college 8.0 9.1 27.2 26.1 27.1 28.1 Bachelor’s degree 4.1 2.9 8.3 8.8 20.7 11.0 Postgraduate degree 1.7 1.0 4.0 3.0 10.3 3.7 Total 100.0 100.0 100.0 100.0 100.0 100.0 Women
Avg. years of education
8.2 8.5 11.9 12.0 13.5 12.8
Percentage with 8 years or less
51.3 47.7 11.9 8.3 1.4 2.4
Some high school
18.9 18.8 15.1 16.7 5.9 13.3
High school graduate
17.3 19.1 32.7 37.2 34.6 36.7 Some college 7.6 10.7 28.4 27.7 29.6 31.1 Bachelor’s degree 3.7 3.1 8.6 7.6 20.0 11.9 Postgraduate degree 1.2 0.7 3.3 2.5 8.5 4.6 Total 100.0 100.0 100.0 100.0 100.0 100.0
SOURCE: 1996–1999 CPS ORG data. NOTE: Recent immigrants are defined as those who arrived in the United States within approximately 10 years of the survey date
.
college. Second, enormous educational improvement takes place between first- and second-generation Mexican Americans. Indeed, average schooling levels are about three and a half years higher for the second generation than for Mexican immigrants. Therefore, a large portion of the overall education deficit for Mexican Americans derives from the presence of large numbers of Mexican immigrants with very low education levels. The U.S.-born children of Mexican immigrants close most but not all of this education gap.
Finally, intergenerational progress in schooling among Mexican Americans appears to slow considerably after the second generation. The modest education gains observed between the second and third
generations are largely attributable to the third generation having a lower proportion with less than nine years of schooling and a higher proportion of high school graduates. Nevertheless, the educational attainment of third- and higher-generation Mexican Americans trails that of non-Hispanics by an alarming amount. Within the third generation, Mexican Americans average a year and a half less schooling than whites, are three times as likely to not complete high school (roughly 24 percent for Mexican Americans versus 8 percent for whites), and are about one-third as likely to earn a bachelor’s degree (roughly 11 percent for Mexican Americans versus 30 percent for whites). Compared to blacks, third-generation Mexican Americans average 0.4 fewer years of schooling among men and 0.8 fewer years of schooling among women. Mexican Americans are also more likely than blacks to not finish high school (24 percent versus 16 percent) and have lower rates of college completion (11 percent versus 15 percent). Consequently, the educational attainment of U.S.-born Mexican Americans is low not just in comparison with the white majority but also in comparison with disadvantaged minority groups such as native blacks.
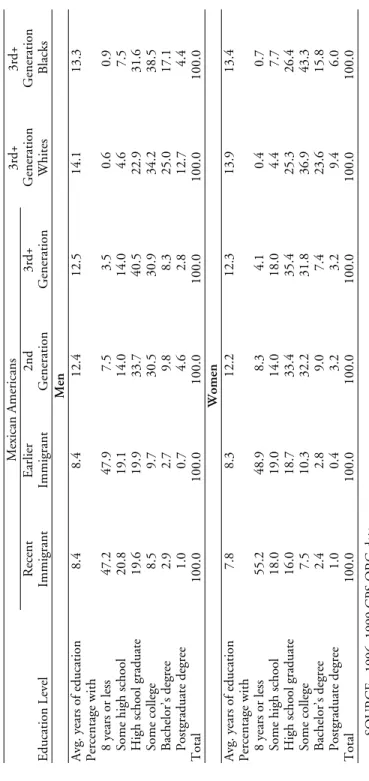
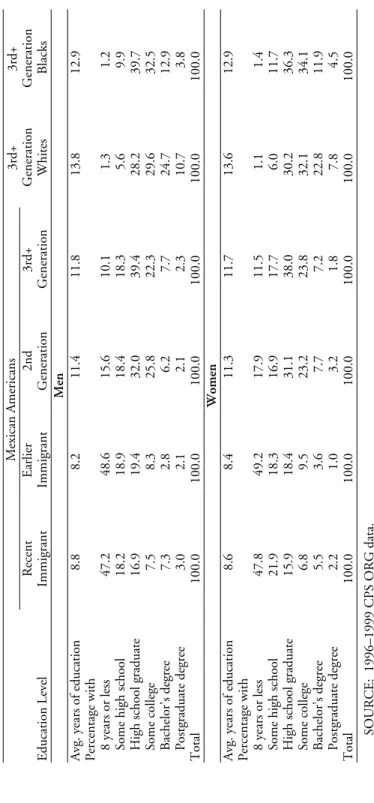
Tables 2.4–2.6 present these same education statistics for California, Texas, and the rest of the United States. Although the schooling levels of U.S.-born Mexican Americans are lower in Texas than elsewhere, the general patterns described above for the entire United States also show up in each of the regions. Everywhere, Mexican Americans experience huge educational gains between the first and second generations but little further improvement after the second generation, leaving substantial
Table 2.4
Educational Attainment, by Race/Ethnicity and Generation, Ages 25–59, California
Mexican Americans 3rd+ 3rd+ Education Level Recent Immigrant Earlier Immigrant 2nd Generation 3rd+ Generation Generation Whites Generation Blacks Men
Avg. years of education
8.4 8.4 12.4 12.5 14.1 13.3
Percentage with 8 years or less
47.2 47.9 7.5 3.5 0.6 0.9
Some high school
20.8 19.1 14.0 14.0 4.6 7.5
High school graduate
19.6 19.9 33.7 40.5 22.9 31.6 Some college 8.5 9.7 30.5 30.9 34.2 38.5 Bachelor’s degree 2.9 2.7 9.8 8.3 25.0 17.1 Postgraduate degree 1.0 0.7 4.6 2.8 12.7 4.4 Total 100.0 100.0 100.0 100.0 100.0 100.0 Women
Avg. years of education
7.8 8.3 12.2 12.3 13.9 13.4
Percentage with 8 years or less
55.2 48.9 8.3 4.1 0.4 0.7
Some high school
18.0 19.0 14.0 18.0 4.4 7.7
High school graduate
16.0 18.7 33.4 35.4 25.3 26.4 Some college 7.5 10.3 32.2 31.8 36.9 43.3 Bachelor’s degree 2.4 2.8 9.0 7.4 23.6 15.8 Postgraduate degree 1.0 0.4 3.2 3.2 9.4 6.0 Total 100.0 100.0 100.0 100.0 100.0 100.0
SOURCE: 1996–1999 CPS ORG data. NOTE: Recent immigrants are defined as those who arrived in the United States within approximately 10 years of the survey date
.
Table 2.5
Educational Attainment, by Race/Ethnicity and Generation, Ages 25–59, Texas
Mexican Americans 3rd+ 3rd+ Education Level Recent Immigrant Earlier Immigrant 2nd Generation 3rd+ Generation Generation Whites Generation Blacks Men
Avg. years of education
8.8 8.2 11.4 11.8 13.8 12.9
Percentage with 8 years or less
47.2 48.6 15.6 10.1 1.3 1.2
Some high school
18.2 18.9 18.4 18.3 5.6 9.9
High school graduate
16.9 19.4 32.0 39.4 28.2 39.7 Some college 7.5 8.3 25.8 22.3 29.6 32.5 Bachelor’s degree 7.3 2.8 6.2 7.7 24.7 12.9 Postgraduate degree 3.0 2.1 2.1 2.3 10.7 3.8 Total 100.0 100.0 100.0 100.0 100.0 100.0 Women
Avg. years of education
8.6 8.4 11.3 11.7 13.6 12.9
Percentage with 8 years or less
47.8 49.2 17.9 11.5 1.1 1.4
Some high school
21.9 18.3 16.9 17.7 6.0 11.7
High school graduate
15.9 18.4 31.1 38.0 30.2 36.3 Some college 6.8 9.5 23.2 23.8 32.1 34.1 Bachelor’s degree 5.5 3.6 7.7 7.2 22.8 11.9 Postgraduate degree 2.2 1.0 3.2 1.8 7.8 4.5 Total 100.0 100.0 100.0 100.0 100.0 100.0
SOURCE: 1996–1999 CPS ORG data. NOTE: Recent immigrants are defined as those who arrived in the United States within approximately 10 years of the survey date
Table 2.6
Educational Attainment, by Race/Ethnicity and Generation, Ages 25–59, United States Excluding California and Texas
Mexican Americans 3rd+ 3rd+ Education Level Recent Immigrant Earlier Immigrant 2nd Generation 3rd+ Generation Generation Whites Generation Blacks Men
Avg. years of education
8.8 8.4 12.1 12.4 13.5 12.5
Percentage with 8 years or less
44.9 48.7 10.9 6.0 2.1 3.4
Some high school
20.2 18.6 14.3 16.1 7.0 14.3
High school graduate
21.5 20.2 36.5 35.6 34.6 41.7 Some college 7.7 8.4 24.4 27.2 26.2 26.7 Bachelor’s degree 3.9 3.4 8.6 11.1 20.0 10.2 Postgraduate degree 1.9 0.8 5.4 4.0 10.1 3.6 Total 100.0 100.0 100.0 100.0 100.0 100.0 Women
Avg. years of education
8.5 9.0 12.1 12.2 13.5 12.8
Percentage with 8 years or less
48.3 43.6 9.8 7.5 1.5 2.6
Some high school
18.7 18.7 14.7 14.0 6.1 13.9
High school graduate
19.5 20.6 33.7 37.6 35.8 37.5 Some college 8.0 12.8 29.2 29.7 28.7 29.9 Bachelor’s degree 4.5 3.1 8.9 8.3 19.5 11.6 Postgraduate degree 1.1 1.2 3.7 2.9 8.5 4.6 Total 100.0 100.0 100.0 100.0 100.0 100.0
SOURCE: 1996–1999 CPS ORG data. NOTE: Recent immigrants are defined as those who arrived in the United States within approximately 10 years of the survey date
.
schooling deficits for third-generation Mexican Americans relative to whites or blacks. In fact, the average schooling gaps between third-generation Mexican Americans and blacks are particularly large (on the order of a year) in California and Texas, the two states where most Mexican Americans live.
The relatively modest amount of educational progress observed between second- and third-generation Mexican Americans is a puzzle for the following reason. Previous studies have consistently found parental education to be one of the most important determinants of an
individual’s educational attainment and ultimate labor market success (Haveman and Wolfe, 1994). Through this mechanism, the huge educational gain between first- and second-generation Mexican Americans should produce a sizable jump in schooling between the second and third generations, because on average the third generation has parents who are much better educated than those of the second
generation. Yet the improvement in schooling we expect to find between the second and third generations is largely absent. We will return to this puzzle in Chapter 4, where we examine in detail the determinants of educational outcomes.
3. Labor Market Success
In this chapter, we explore the extent and determinants of earnings differences between Mexican Americans, whites, and blacks. Our focus is on hourly earnings because previous research indicates that the income disadvantage of Mexican-origin households stems primarily from low wages rather than from low rates of labor force participation, high rates of unemployment, or reduced workweeks (Abowd and Killingsworth, 1984; Borjas, 1984; Reimers, 1984; Bean and Tienda, 1987). We show that the educational disadvantage of Mexican Americans documented in the previous chapter is the principal reason why average wages are low for Mexican-origin workers in the U.S. labor market.
Data
We begin with the same data analyzed in the preceding chapter: 1996–1999 CPS samples of Mexican American, third-generation white, and third-generation black men and women ages 25–59. Because earnings information is available only for those with jobs, we must now further limit the sample to individuals who were employed during the CPS survey week. To give an idea how this affects the samples, Table
3.1 reports employment rates for the relevant groups.1
Among men, employment rates approach 90 percent for Mexican immigrants, similar to the rates for third-generation whites. The employment rates of U.S.-born Mexican American men tend to be a few percentage points lower than this but substantially higher than the corresponding rates for black men. For women, employment rates are around 70 percent for U.S.-born Mexican Americans and for blacks,
____________
1Table 3.1 is based on the same data used in Tables 2.3 to 2.6. Sample sizes for the relevant gender, race/ethnicity, and generation cells are reported in Appendix Table A.1. Self-employed workers remain in these samples used to compare education levels and employment rates, but, as explained below, by necessity they are excluded from the samples used to analyze wages.
20
Table 3.1
Percentage Employed During Survey Week, by Race/Ethnicity and Generation, Ages 25–59
Race/Ethnicity/Generation U.S. Total California Texas
United States Excluding California and Texas Men
Mexican Americans
Recent immigrant 90.1 88.7 90.9 91.0 Earlier immigrant 87.3 86.0 88.3 89.3 2nd generation 84.9 84.3 84.1 86.7 3rd+ generation 85.1 81.4 86.8 86.3 3rd+ generation whites 89.3 87.7 91.5 89.3 3rd+ generation blacks 77.1 73.6 82.9 77.0
Women Mexican Americans
Recent immigrant 40.0 41.6 36.3 40.0 Earlier immigrant 53.0 53.2 50.7 54.8 2nd generation 68.0 71.4 62.4 69.8 3rd+ generation 69.1 67.5 68.5 71.5 3rd+ generation whites 75.0 73.4 74.6 75.2 3rd+ generation blacks 70.9 67.2 75.0 70.8
SOURCE: 1996–1999 CPS ORG data.
NOTE: Recent immigrants are defined as those who arrived in the United States within approximately 10 years of the survey date.
with somewhat higher rates for whites and much lower rates for Mexican immigrants.
The fact that earnings information is unavailable for those without jobs can distort wage comparisons such as those we make in this chapter. For example, suppose that individuals with lower earnings potential are less likely to be employed than those with higher skills and better labor market opportunities. In this case, the average wages we observe, in the sample of people with jobs, are higher than they would be if we somehow had earnings data for all individuals, including those without jobs. Most important, the upward bias to average wages will be bigger for groups with relatively low employment rates, such as black men and Mexican-born women, because for these groups a larger share of potentially low-wage individuals will be excluded from the earnings sample. To mitigate
this problem, we present wage comparisons that control for observable indicators of skill such as education and age, but the problem remains to the extent that there exist other important, unobserved determinants of labor market skills and wages that are correlated with employment rates. This point should be kept in mind when interpreting the results reported
below.2
The basic monthly CPS does not collect earnings information from self-employed workers, and therefore only so-called “wage and salary”
employees are included in the wage analyses.3 For each worker, hourly
earnings are computed as the ratio of usual weekly earnings to usual weekly hours of work. Workers with computed hourly wages below $1 or above $500 are considered outliers and excluded. Finally, to ensure that workers satisfy a minimum level of labor force attachment, the wage
analyses include only those who work at least 10 hours per week.4
Wage Comparisons
Multiple regression provides a convenient way to systematically investigate the influence of various factors on wage differences between race/ethnicity/generation groups. For the United States as a whole, Table 3.2 reports the results of hourly wage regressions, estimated by ordinary least squares, that show how minority-white wage gaps change as control variables are added in succession. Separate regressions were run for men and women. These regressions allow intercepts to differ across race/ethnicity/generation groups (with third-generation whites as the reference group), but other coefficients are restricted to be the same for all groups. The dependent variable is the natural logarithm of hourly earnings, so the estimated coefficients on the race/ethnicity/generation
____________
2Under certain circumstances, statistical techniques can be used to adjust wage averages for the effects of employment differences across groups (Heckman, 1979), but the CPS data that we analyze here do not provide the information necessary to make credible adjustments of this type.
3Self-employment rates are lower for Mexican Americans and blacks than for whites (Bean et al., 2001, Table 21). Therefore, self-employment selectivity has the potential to distort wage comparisons in the manner described in the preceding paragraph.
22
Table 3.2
Log Hourly Wage Differentials, Relative to 3rd+ Generation Whites, by Race/Ethnicity and Generation, Ages 25–59, U.S. Total
Men Women
Race/Ethnicity/Generation (1) (2) (3) (1) (2) (3) Mexican Americans
Recent immigrant –.757 –.662 –.357 –.696 –.665 –.297 Earlier immigrant –.564 –.554 –.240 –.547 –.546 –.205 2nd generation –.273 –.239 –.110 –.228 –.212 –.074 3rd+ generation –.264 –.243 –.116 –.222 –.216 –.077 3rd+ generation blacks –.289 –.282 –.210 –.160 –.158 –.090 Controls for
Survey month/year Yes Yes Yes Yes Yes Yes Geographic location Yes Yes Yes Yes Yes Yes
Age No Yes Yes No Yes Yes
Education level No No Yes No No Yes SOURCE: 1996–1999 CPS ORG data.
NOTE: The reported figures are estimated coefficients from ordinary least squares regressions in which the dependent variable is the natural logarithm of average hourly earnings. Recent immigrants are defined as those who arrived in the United States within approximately 10 years of the survey date.
indicator variables represent approximate percentage wage differentials
between each group and third-generation whites.5
In the first regression specification—the columns labeled (1) in Table 3.2—the control variables include indicators for the month and year of the CPS survey that the observation comes from and also a vector
of geographic variables.6 In effect, these estimates provide wage
comparisons at a single point in time between workers who live in the same place, as a way of standardizing for intertemporal and interregional
____________
5For ease of exposition, we will refer to log wage differences as if they represent percentage wage differentials. Strictly speaking, however, log wage differences closely approximate percentage wage differentials only when the log wage differences are on the order of .25 or less in absolute value. For larger differences, the implied percentage wage differential can be calculated as ec– 1, where c is the log wage difference (i.e., the
estimated coefficient on the relevant ethnicity/generation indicator variable). 6The geographic controls are indicators for metropolitan status (central city, elsewhere in a metropolitan statistical area, not in a metropolitan statistical area, and metropolitan status not identified), the nine Census divisions, and the states of California and Texas.
variation in the cost-of-living and labor market conditions.7 Among men, average wages are virtually the same for second- and third-generation Mexican Americans, with both groups earning about 27 percent less than third-generation whites, which is similar to the corresponding wage deficit of 29 percent for blacks. Average wages are much lower for Mexican immigrants. The implication is that Mexican Americans enjoy wage growth of 30 percent or more between the first and second generations. Intergenerational progress appears to stall after the second generation, however, as no further wage growth is evident between the second and third generations, despite the substantial wage gap that persists between U.S.-born Mexican Americans and whites. The patterns for women are similar, except that the wage deficit of blacks (16 percent) is lower than the 22 percent deficit for U.S.-born Mexican Americans.
In the second regression specification—the columns labeled (2) in Table 3.2—we control for age by adding a set of indicator variables identifying the five-year age cohort to which each worker belongs. Other than attenuating somewhat the male wage gap for recent Mexican immigrants, who tend to be young, controlling for age has only a minor effect on the wage differentials.
In the final regression specification—the columns labeled (3) in Table 3.2—we add a set of indicator variables for educational
attainment, using the same six schooling categories that we employed in ____________
7Standard errors indicate how precisely regression coefficients are estimated. Sampling error arises because estimates are calculated using samples that represent only a small fraction of the underlying population. If the only source of error is sampling error (as opposed to other types of error that impart systematic bias), then the chances are about 95 percent that the true coefficient is within two standard errors (plus or minus) of its estimate. An estimated coefficient is said to be “statistically significant” when it is at least twice the size of its standard error, because this makes it unlikely that the true coefficient is zero. In tables, standard errors are often displayed in parentheses below the corresponding coefficient. To avoid clutter, however, we will omit standard errors from most of the tables in this report. Instead, Appendix A reports standard errors for those regression coefficients whose standard errors are not displayed in the same table. For example, Appendix Table A.3 provides standard errors for the estimates in Table 3.2. Note that all of the minority-white wage gaps in Table 3.2 are statistically significant.
24
Tables 2.3 to 2.6.8 Controlling for education shrinks the wage deficit
(relative to third-generation whites) for all groups but much more so for Mexican Americans than for blacks. Among men, the wage gap for U.S.-born Mexican Americans is more than halved (from 24 percent to 11 percent) as we move from specification (2) to specification (3), whereas the corresponding wage gap for blacks falls by only one-quarter (from 28 percent to 21 percent). Among women, the wage gap declines by almost two-thirds for U.S.-born Mexican Americans (from 21 percent to 8 percent) but by less than half for blacks (from 16 percent to 9 percent). These results highlight the prominent role that education plays in accounting for the relatively low wages earned by Mexican-origin workers in the United States.
The estimates in Table 3.2 also imply that education is a key determinant of the substantial wage differential between Mexican immigrants and U.S.-born Mexican Americans. For both men and women, the wage gap of more than 30 percent observed in column (2) between earlier immigrants and the second generation shrinks to just 13 percent in column (3). This pattern indicates that much of the wage progress across generations for Mexican Americans is driven by the intergenerational improvements in schooling that we documented in the previous chapter.
After simultaneously controlling for geographic location, age, and education, the remaining wage deficit of 11 percent for second- and third-generation Mexican men is much smaller than the 21 percent wage deficit of black men. For women, the analogous wage deficits are similar for the two groups (8 percent for U.S.-born Mexican Americans and 9 percent for blacks). These findings suggest that differences in labor market skills, as measured by crude indicators such as age and especially years of schooling, account for a large portion of the wage gaps between U.S.-born Mexican Americans and whites.
Tables 3.3 to 3.5 repeat this analysis for each of the three regions. In general, the same patterns arise as for the United States as a whole, with
____________
8The six mutually exclusive and exhaustive education categories are as follows: eight years or less, some high school, high school graduate, some college, bachelor’s degree, and postgraduate degree.
Table 3.3
Log Hourly Wage Differentials, Relative to 3rd+ Generation Whites, by Race/Ethnicity and Generation, Ages 25–59, California
Men Women
Race/Ethnicity/Generation (1) (2) (3) (1) (2) (3) Mexican Americans
Recent immigrant –.862 –.752 –.403 –.799 –.759 –.346 Earlier immigrant –.640 –.626 –.275 –.612 –.607 –.235 2nd generation –.263 –.210 –.077 –.258 –.236 –.081 3rd+ generation –.270 –.249 –.111 –.216 –.208 –.064 3rd+ generation blacks –.300 –.286 –.236 –.135 –.132 –.100 Controls for
Survey month/year Yes Yes Yes Yes Yes Yes Geographic location Yes Yes Yes Yes Yes Yes
Age No Yes Yes No Yes Yes
Education level No No Yes No No Yes SOURCE: 1996–1999 CPS ORG data.
NOTE: The reported figures are estimated coefficients from ordinary least squares regressions in which the dependent variable is the natural logarithm of average hourly earnings. Recent immigrants are defined as those who arrived in the United States within approximately 10 years of the survey date.
Table 3.4
Log Hourly Wage Differentials, Relative to 3rd+ Generation Whites, by Race/Ethnicity and Generation, Ages 25–59, Texas
Men Women
Race/Ethnicity/Generation (1) (2) (3) (1) (2) (3) Mexican Americans
Recent immigrant –.731 –.668 –.372 –.698 –.683 –.332 Earlier immigrant –.572 –.565 –.246 –.571 –.571 –.231 2nd generation –.387 –.371 –.198 –.288 –.275 –.120 3rd+ generation –.372 –.352 –.181 –.321 –.317 –.148 3rd+ generation blacks –.314 –.297 –.222 –.179 –.173 –.100 Controls for
Survey month/year Yes Yes Yes Yes Yes Yes Geographic location Yes Yes Yes Yes Yes Yes
Age No Yes Yes No Yes Yes
Education level No No Yes No No Yes SOURCE: 1996–1999 CPS ORG data.
NOTE: The reported figures are estimated coefficients from ordinary least squares regressions in which the dependent variable is the natural logarithm of average hourly earnings. Recent immigrants are defined as those who arrived in the United States within approximately 10 years of the survey date.