This
report
has
been
commissioned
by
the
Smart
Energy
for
Europe
Platform
(SEFEP).
Policy Makers 1
Decarbonisation Scenarios
leading to the EU Energy
Roadmap 2050.
SEFEP working paper 2012
Authors
Öko
‐
Institut
Hannah
Förster,
Sean
Healy,
Charlotte
Loreck,
Felix
Matthes
Wuppertal
Institute
Manfred
Fischedick,
Sascha
Samadi,
Johannes
Venjakob
2
Table of Contents
Table of Contents ... 2 List of Figures ... 4 List of Tables ... 4 About the Authors (alphabetical order) ... 5 About SEFEP ... 7 Summary ... 8 1. Introduction ... 9 2. Shared vision of a decarbonised Europe ... 12 2.1 Emission trajectories ... 12 2.2 Electricity consumption ... 13 2.3 Sources of electricity production ... 15 3. Comparison of decarbonisation scenarios ... 16 3.1 Methodology ... 16 3.2 Results ... 17 4. Cost assumptions of the scenarios ... 23 4.1 Fossil fuel prices ... 23 4.2 Capital expenditure ... 24 4.3 Electricity generation costs ... 25 4.4 Cost assumptions on nuclear power ... 26 4.5 Explanation of the difference in cost assumptions ... 26 5. Window of opportunity for political action ... 28 6. Conclusion ... 31 7. References ... 33 8. Annex ... 34 8.1 Shares of causal factors on gross CO2 emission reductions in each scenario ... 343
8.2 Climate Policies in the EU ... 35 8.3 Energy models used in the studies considered ... 36 8.4 Suggested standard for data reporting ... 38
4
List of Figures
Figure 1 EU Roadmap 2050 decarbonisation pathway ... 10 Figure 2 CO2 emission trajectories for reference and decarbonisation scenarios ... 13
Figure 3 A comparison of the electricity consumption between the base year and the year 2050 for the decarbonisation scenarios ... 14 Figure 4 Share of electricity from renewable sources compared to the share of electricity from nuclear energy / CCS electricity generation for the decarbonisation scenarios by 2050 ... 15 Figure 5 Overview of the contribution of different causal factors to emission changes in 2050 compared to the base year (top) accompanied by the electricity generation mix within the different scenarios (bottom) ... 18 Figure 6 Overview of the contribution to emission change from the base year of different causal factors in the decarbonisation scenarios between 2020 and 2050 ... 22 Figure 7 Capital expenditure (in €2010/kW) for various fossil and renewable energy technologies in the ECF Roadmap 2050 and Energy Revolution scenarios in 2030 and 2050 ... 24 Figure 8 Generation costs (in €‐cent2010/kWh) for various fossil and renewable energy technologies in the Power Choices and Energy Revolution scenarios in 2030 and 2050 ... 25 Figure 9 Shares of causal factors on gross emission reductions in 2050. ... 34
List of Tables
Table 1 Decomposition results of CO2 emission reduction in 2050 for decarbonisation scenarios. . 19
Table 2 Fossil fuel import prices (in €2005) in the ECF Roadmap 2050 and Energy Revolution scenarios in 2015, 2030 and 2050 ... 23 Table 3 The contribution of existing abatement measures to CO2 emission change compared to the
base year of each scenario between 2020 and 2050. ... 29 Table 4 The contribution of key innovations to CO2 emission change compared to the base year of
each scenario between 2020 and 2050. ... 30 Table 5 Models used in the studies considered ... 36 Table 6 Key assumptions of the studies considered that influence the decarbonisation pathways 37
5
About the Authors (alphabetical order)
Prof. Manfred Fischedick Prof. Dr. Ing. Manfred Fischedick is the director of the research group 1 “Future Energy and Mobility Structures” at the Wuppertal Institute for Climate, Environment and Energy. In 2006 he was appointed Vice President of the Wuppertal Institute. Between February 2008 and February 2010 he was the acting scientific head of the institute. In November 2008 he was appointed Professor at the Schumpeter School of Business and Economics at the University of Wuppertal. Manfred Fischedick earned a PhD at the University of Stuttgart (integration of renewable energies into the existing power plant system). He has more than 20 years of experience in energy system analysis, is adviser to the EU and the German government, author of various publications and peer reviewed articles. He is coordinating lead author for the IPCC and member of several scientific boards. Dr. Hannah Förster Dr. Hannah Förster is Research Fellow in the Energy and Climate Change Division of Öko‐Institut in Berlin. Prior to joining the Öko‐Institut Hannah worked for 10 years at the Potsdam Institute for Climate Impact Research. During her time as a PhD student she collaborated on the development of an agent‐based general disequilibrium model of the German economy. After finishing her PhD thesis, she gained insights into interdisciplinary research in various fields related to climate change, including the analysis of impacts of climate change on key economic sectors (CIRCE project), adaptation research and the representation of scientific content to non‐scientific audiences (ci:grasp project). Hannah’s main fields of research at Öko‐Institut include modelling and model‐based analyses in the areas of climate change, energy security and climate policy. Sean Healy Sean Healy is a research assistant in the Energy and Climate Division of the Öko‐Institut in Berlin. He studied BA Geography at Oxford University and subsequently obtained an MSc in Environmental Technology from Imperial University in 2009. Prior to joining the Öko‐Institut, Sean worked as a project co‐ordinator at Creative Environmental Networks (CEN) in the biomass energy team. Sean Healy has contributed to research that focuses on effort sharing in a Post 2012 climate regime, reforming the Clean Development Mechanism (CDM) and assessing the risk of carbon leakage from the EU ETS. Charlotte Loreck Charlotte Loreck studied Engineering Science at TU Berlin and Technion, Israel. From 2007 to July 2010 she worked in the German Federal Environment Agency with a focus on security of supply and greenhouse gas mitigation in the electricity system and assessment of climate change mitigation policies. Since August 2010 she is a researcher at Öko‐Institut, Berlin, and works on energy system modeling.
6 Dr. Felix Christian Matthes Dr. Felix Matthes (Senior Staff) has been a Researcher at Öko‐Institut since 1991. From 1991 to 1997 he was a senior scientist in the Energy and Climate Protection Division, from 1997 to 2008 he was the Coordinator of the division and since 2008 he has been Research Coordinator for Energy and Climate Policy. From 2002 to 2004 he served as Deputy Director of the Institute. He has more than 17 years professional experience in research and consultancy, concentrating on energy and climate change issues. He has published numerous studies and publications on German and international energy policy, as well as on environment and climate policy. Key topics of his work include the design, the comparison and the implementation of emissions trading schemes, energy market modelling and technology‐specific policies (e.g. regarding cogeneration, nuclear energy) as well as the comprehensive assessment and monitoring of energy and climate policy packages. His key topic of interest in recent years has been the implementation of the EU ETS, including the phase‐in of auctioning in phase 2 and 3 of the scheme. He has served as a member of the in‐depth review teams for National Communications under the United Nations Framework Convention on Climate Change (UNFCCC) for several occasions. From 2000 to 2002 he was a Scientific Member of the Study Commission ‘Sustainable Energy in the Framework of Globalization and Liberalization” of the German Federal Parliament (German Bundestag). In 2007 and 2008 he was a visiting scientist at the Joint Program on the Science and Policy of Global Change of the Massachusetts Institute of Technology (MIT) in Cambridge, MA. Sascha Samadi Sascha Samadi is a research fellow at research group 1 “Future Energy and Mobility Structures” at the Wuppertal Institute for Climate, Environment and Energy. He studied economics with emphasis on environmental issues at the University of Oldenburg, Germany. In his work at the Wuppertal Institute he focuses on the analysis of German, European and global energy scenario studies as well as on the benefits and costs of renewable energy policies. Sascha Samadi is currently working on a PhD thesis on modelling of renewable energy costs in global energy models. Johannes Venjakob Johannes Venjakob is a project coordinator at research group 1 “Future Energy and Mobility Structures” at the Wuppertal Institute for Climate, Environment and Energy. He studied Geography at the University of Bonn. Johannes Venjakob joined the Wuppertal Institute in 2001. His main fields of expertise are the energy systems of Central and Eastern Europe and the development of low carbon strategies for municipalities. He recently submitted his PhD thesis on long‐term scenarios of the Polish energy system.
7
About SEFEP
SEFEP, the Smart Energy for Europe Platform, is an independent, non‐profit organisation founded by the European Climate Foundation and the Stiftung Mercator. Based in Berlin, SEFEP offers a platform to stimulate cooperation and synergies among all European actors who aim to build a fully de‐ carbonised, predominantly renewable power sector.8
Summary
With growing concerns about climate change, energy import dependency and increasing fuel costs, a political consensus has formed in Europe in recent years about the need to transform the way we supply and consume energy. However, there is less political consensus on the specific steps that need to be taken in order to achieve a future sustainable energy system. Questions about which technologies should be used to what extent and how fast changes in the energy system should be instituted are being discussed on the European Union as well as on the Member State level. Energy scenarios are seen as a helpful tool to guide and inform these discussions. Several scenario studies on the European energy system have been released in recent years by stakeholders like environmental NGOs and industry associations. A number of these studies have recently been analysed by the Öko Institut and the Wuppertal Institute within an ongoing project commissioned by the Smart Energy for Europe Platform (SEFEF). The project aims to advance the debate on the decarbonisation of the energy system in the European Union as well as the EU Member States during the course of 2012 and to make contributions to the scientific literature on this topic. Analysis within the project focuses on the development of the electricity system, as this system today is the main source for CO2 emissions and is widely regarded to be the key system to any future decarbonisation pathway. The paper at hand presents the results of an in‐depth analysis and a comparison of six mitigation scenarios from three important scenario studies released since 2009 by Greenpeace, EURELECTRIC and the European Climate Foundation (ECF) respectively. A decomposition method is applied to show the extent to which technologies and strategies contribute to CO2 emission reductions in the individual scenarios.1 The authors conclude that there are a few technologies and strategies in the electricity sector, which are key in any mitigation pathway. This consensus especially concerns the need for stronger improvements in energy efficiency to reduce future increases in electricity demand and the rapid deployment of renewable energy technologies, especially onshore and offshore wind. Disagreements in the scenarios analysed mostly deal with the two mitigation options Carbon Capture and Storage (CCS) and nuclear energy. The level of public acceptance towards these technologies, their future costs (especially compared to renewable energy technologies) and in the case of CCS also the technological feasibility is assessed differently in the scenario studies considered here. Despite the differences in the scenarios, the analysis makes clear that political action is needed today to ensure that there will be no delays in the transition towards a sustainable energy system. One reason for this is because major infrastructural changes are required in regard to the electricity grid and any such measures (especially building storage facilities and new transmission lines) are characterised by considerable lead times. The same holds true for the more controversial and uncertain mitigation option of CCS, which would require a significant pipeline infrastructure and ready‐to‐use CO2 storage sites. As long as uncertainty about such key infrastructural changes remains, investments will likely not be sufficient to realise any ambitious mitigation pathway.1 In a next step within the SEFEP funded project a similar analysis will be conducted for the scenarios
developed within the European Commission’s Roadmap 2050 study, which was released in December
9
1. Introduction
At the UN climate conference in Cancún in December 2010, all Parties expressed support for a target to limit global warming to a maximum of 2°C above pre‐industrial levels, which is generally considered to be the threshold for global temperature rise to prevent the catastrophic consequences of climate change. The European Council subsequently reconfirmed in February 2011 that the objective of the European Union (EU) is to reduce greenhouse gas emissions (GHGs) by 80 to 95 % below 1990 levels by 2050.2 Although the EU is already committed to GHG emission reductions of at least 20 % below 1990 levels by 2020 as part of the Energy and Climate Package3, longer‐term policies are now required to ensure that the ambitious reduction target for 2050 is achieved. The European Commission has therefore published a ‘Roadmap for moving to a competitive low‐carbon economy in 2050’4, providing guidance on how the EU can decarbonise the economy. The process around this document which finally led to the EU Energy Roadmap 20505, published in December 2011, is based on economic modeling and scenario analysis, which considers how the EU can move towards a low carbon economy assuming continued global population growth, increasing global GDP and by varying trends in terms of international climate action, energy and technological development.6 The outcome of the analysis is a recommendation that the EU should reduce GHG emissions by 80 % below 1990 levels by 2050 and that this target is technically feasible and financially viable using proven technologies if strong incentives (i.e. carbon pricing) exist. The cost efficient pathway to achieve the 2050 target calls for domestic GHG reductions below 1990 levels of 25 % in 2020, 40 % in 2030 and 60 % in 2040 and this would require an additional annual investment of €270 billion for the next 40 years. This is equivalent to ‘an additional investment of 1.5 % of EU GDP per annum on top of the overall current investment representing 19 % of GDP in 2009.’7 The extent and timing of these GHG reduction targets are differentiated by sector reflecting the different abatement potentials that exist within the EU (Figure 1).2 European Council (2011): Conclusions – 4 February 2011.
http://www.consilium.europa.eu/uedocs/cms_data/docs/pressdata/en/ec/119175.pdf
3
The objective of the Energy and Climate Package is to reduce GHGs by at least 20% by 2020 relative to
1990 emission levels, increase the share of renewable energy in meeting final energy demand in the
EU to 20% and to reduce energy consumption by 20% compared to projected trends. See the annex
for more information on how these policy objectives are to be achieved.
4 COM (2011): A Roadmap for moving to a competitive low carbon economy in 2050. 112 final.
5 COM(2011) 885/2.
6
COM (2011): A Roadmap for moving to a competitive low carbon economy in 2050. 112 final.
10
Figure 1 EU Roadmap 2050 decarbonisation pathway
0% 10% 20% 30% 40% 50% 60% 70% 80% 90% 100% 1990 2005 2030 2050 Pe rc e n t GHG co m p are d to 1990 le ve ls
Other Non CO2 Agriculture Transport Industry Residential & Tertiary Power Sector
Source: COM (2011) and adapted by Öko‐Institut / Wuppertal Institut (2012)
As part of the development of the EU Energy Roadmap 2050, the impact assessment accompanying the communication8 included a stakeholder consultation whereby a selection of decarbonisation studies up until the year 2010 were reviewed in order to compare different views on how the EU can decarbonise its economy. For example, a decarbonisation scenario may differ based upon the use of technologies to generate electricity (i.e. renewable energy, nuclear and CCS) or may also differ due to how energy is used (i.e. rates of consumption and efficiency improvements). The objective of this policy paper is to provide a quantitative analysis of the similarities and differences of the decarbonisation scenarios for three studies that were previously analysed qualitatively by the European Commission. The decomposition scenarios analysed in this policy paper include:
Greenpeace, European Renewable Energy Council (2010). Energy revolution ‐ a sustainable
world energy outlook: Energy Revolution and Advanced Energy Revolution Scenario.
ECF (2010). Roadmap 2050 ‐ A practical guide to a prosperous, low‐carbon Europe. Technical
analysis: 40%, 60% and 80% RES scenarios.
8 COM (2011) Impact assessment accompanying document to the Communication entitled ‘A Roadmap
11
Eurelectric (2009). Power Choices. Pathways to carbon‐neutral electricity in Europe by 2050: Power Choices Scenario. The scenarios considered in this policy paper advocate a ‘shared vision’ for a decarbonised power sector in 2050 with a similar level of ambition with regards to CO2 emission reductions in 2050. However, the scenarios under consideration have different views on the technology mix and levels of energy consumption and these differences are reviewed in Section 2. To provide further insights into the similarities and differences between the decarbonisation scenarios a decomposition analysis is completed in Section 3. The added value of this decomposition analysis is the ability to attribute the CO2 emission reductions from a decarbonisation scenario to important causal factors such as the increase of wind power in the energy mix. The cost assumptions underlying these decarbonisation scenarios are considered in Section 4. The implications of the similarities and differences identified between all of the decarbonisation scenarios will then be discussed in Section 0 focusing especially on the timing of political action needed to realise the decarbonisation pathways. The paper concludes with Section 6. In December 2011, the final EU Energy Roadmap 20509 was published and additional scenarios have been produced and simulated based on the PRIMES model. These scenarios will be subsequently analysed in a future policy paper. 9 COM(2011) 885/2.
12
2. Shared vision of a decarbonised Europe
Differences between the scenarios can be explained by differences in key assumptions, like those on future technology and fuel costs (see Section 4) as well as by different modelling approaches (see the Annex). In some scenarios explicit normative assumptions have a direct and significant effect on the evolution of the energy system. For example in the Greenpeace scenarios the use CCS technology is ruled out and the use of nuclear power is phased out, as the organization does not see these two mitigation options as sustainable solutions. At the same time the ECF Roadmap 2050 scenarios set a fixed share for renewable energy sources in electricity generation in 2050 of 40 %, 60 % and 80 % respectively. The following section provides an overview of the similarities and differences between the decarbonisation scenarios considered in this policy paper with regards to emission trajectories, electricity consumption and electricity supply projections until the year 2050.
2.1
Emission
trajectories
The decarbonisation scenarios all achieve CO2 emission reductions in the power sector of at least 90 % below 1990 emission levels by 2050. The bullet point list below illustrates the hierarchy of ambition (i.e. emission reductions below 1990 levels by 2050) for the decarbonisation scenarios: Greenpeace: Advanced Energy Revolution Scenario (‐ 97 %)10 ECF Roadmap 2050: 40 % RES, 60 % RES and 80 % RES Scenarios (‐ 96 %)11 Greenpeace: Energy Revolution Scenario (‐ 90 %)12 Eurelectric: Power Choices Scenario (‐ 90 %)13 Some studies that develop decarbonisation pathways first establish a reference scenario (i.e. emissions development without climate action). According to the reference scenarios in both the Greenpeace and ECF Roadmap 2050 studies, CO2 emissions would decline to a level of roughly 20 % below their respective base years by 2020. However, afterwards CO2 emissions in both scenarios stagnate so that by 2050 CO2 emissions would still be only about 20 % lower than in 1990. The CO2 emission‐reducing effects of higher contributions of renewable energy sources and lower shares of coal in electricity generation are largely offset in these reference scenarios by growing electricity production (Figure 2). The CO2 emission reduction pathways in all of the decarbonisation scenarios illustrated in Figure 2 are similar. However, in comparison to the other pathways the Power Choices scenario exhibits slower CO2 emission reductions until 2020 followed by relatively deep reductions between 2020 and 2030. The main reason for this is the high relevance of CCS power plant technology in this scenario, which in the study is not assumed to be commercially available until 2025. The ECF Roadmap 2050 decarbonisation scenarios, especially the ECF 40 % and ECF 60 % scenarios also use CCS to a significant extent. Here CCS is assumed to be progressively available from 2020 onwards. Although all
10 Hereafter: Greenpeace Adv. Rev.
11 Hereafter: ECF 40%, ECF 60%, ECF 80%.
12
Hereafter: Greenpeace Rev.
13
of the decarbonisation scenarios share a ‘similar vision’ with regards to the level of CO2 emission reductions by 2050; the extent to which electricity is consumed and the means of supplying electricity differ considerably between them.
Figure 2 CO2 emission trajectories for reference and decarbonisation scenarios
0 200 400 600 800 1000 1200 1400 base year 2020 2030 2040 2050 Mt CO 2 Greenpeace Ref. Greenpeace Rev. Greenpeace Adv. Rev ECF Baseline ECF 40% ECF 60% ECF 80% Power Choices
Note: A systematic overview about scenario assumptions with respect to crucial factors influencing
the emission pathways can be found in Table 6 in Annex 8.3
Source: Öko‐Institut / Wuppertal Institut (2012)
2.2
Electricity
consumption
The change in electricity demand between the base year and the year 2050 for four sectors (i.e. residential, tertiary, transport and industry) are shown in Figure 314. There is a general consensus among the decarbonisation scenarios that total electricity demand will increase in the coming decades. By 2050 electricity demand will have increased between 21 % (Greenpeace Rev. scenario)14 The base year is defined as the year in which values of key variables are provided based on historical
values. It provides the base for the first modeled year in each of the scenarios. The base year for the
Eurelectric (i.e. Power Choices) and ECF Roadmap 2050 studies is 2005, whilst the Greenpeace study
14 and 61 % (Power Choices scenario) compared to their respective base years.15 It is also assumed in all of the decarbonisation scenarios that the transport sector will experience a significant increase in electricity demand due to the growth in the use of electric vehicles. Compared to the respective base years an 11‐fold (Greenpeace Rev. scenario) to 24‐fold (Power Choices scenario) increase in electricity demand in the transport sector is envisaged. However there is much uncertainty in regard to the development of electricity demand in the remaining sectors. For example, the Greenpeace Rev. scenario assumes ambitious energy efficiency improvements whilst also limiting the fuel shift towards electricity, resulting in a reduction in electricity demand compared to the base year of 7 % for the residential and tertiary sectors and 4 % for the industrial sector in 2050 (Figure 3). In contrast, the Power Choices scenario foresees a significant increase in the electricity demand of the industrial sector in 2050 (i.e. 35 % increase compared to the base year).
Figure 3 A comparison of the electricity consumption between the base year and the year 2050 for the
decarbonisation scenarios 0 200 400 600 800 1,000 1,200 1,400 1,600 1,800 2,000 Base year: ECF Base year: Greenpeace Base year: Power Choices ECF all scenarios Greenpeace Rev. Greenpeace Adv. Rev. Power Choices TWh
Residential Tertiary Industry Transport
Source: Öko‐Institut / Wuppertal Institut (2012)
15
It is important to acknowledge the opposing factors on future electricity demand of energy efficiency
improvement in end user appliances on the one hand and the electrification of industrial processes
and transportation on the other hand. Reference scenarios are provided in sufficient detail for the
Greenpeace and ECF Roadmap 2050 studies and indicate that a strategy to decarbonise the energy
system could lead to similar overall electricity demand in 2050 compared to a business‐as‐usual
15
2.3
Sources
of
electricity
production
In line with the overall goal of all the studies’ policy scenarios, electricity generation in Europe in 2050 is based entirely or almost entirely on zero or low CO2 emitting sources. However, the actual mixture of these zero or low CO2 emitting sources is very different for the decarbonisation scenarios. Given that nuclear power is phased out and CCS is not seen as a viable or desirable technology in both the Greenpeace Rev. and Greenpeace Adv. Rev. scenarios; the electricity supply is based on 91 % and 98 % renewable energy sources in 2050 respectively and this includes electricity imports (Figure 4). The rest is supplied by natural gas power plants. In contrast, the Power Choices scenario and the ECF 40 % scenario from the ECF Roadmap 2050 study rely to a significant extent on nuclear power, which will account for 30 % and 27 % respectively of electricity generation in 2050 (Figure 4). CCS coal and natural gas power plants are also used to a significant extent in the Power Choices scenario and the ECF 40 % scenario from the ECF Roadmap 2050 study, providing 30 % of electricity supply in 2050 in both decarbonisation scenarios.
Figure 4 Share of electricity from renewable sources compared to the share of electricity from nuclear
energy / CCS electricity generation for the decarbonisation scenarios by 2050
0.00 0.05 0.10 0.15 0.20 0.25 0.30 0.35 0.30 0.50 0.70 0.90 Shar e of nuclear sour ces in elect rici ty pr o ducti o n
Share of renewable sources in electricity production 0.00 0.05 0.10 0.15 0.20 0.25 0.30 0.35 0.30 0.50 0.70 0.90 Shar e of CCS in electr icit y produc tion
Share of renewable sources in electricity production
ECF 40%
ECF 60%
ECF 80%
Greenpeace Rev.
Greenpeace Adv. Rev.
Power Choices
Source: Öko‐Institut / Wuppertal Institut (2012)
All of the individual factors described in this section (i.e. the sources of consumption and production of electricity), despite their different (e.g. technical) nature, have one characteristic in common: their level of use/non‐use triggers changes in CO2 emissions over time. The decomposition analysis in 3 uses this common denominator as a metric to derive the effect that each of these individual factors has on emission changes in a given decarbonisation scenario.
16
3. Comparison of decarbonisation scenarios
The overview in the previous section outlined the important similarities and differences with regards to the overall timing of CO2 emission reductions, technologies deployed and rates of electricity consumption. However, this analysis is unable to attribute emission changes to the specific changes to the electricity system advocated in all of the decarbonisation scenarios. The objective in the following is therefore to quantitatively analyse all of the decarbonisation scenarios based upon decomposition techniques in order to determine how the causal factors drive changes in emissions.
3.1
Methodology
A decomposition analysis requires an equation that describes the influence of several causal factors on the observed changes of a variable of interest (i.e. CO2 emissions). According to thedecomposition equation developed for this policy paper16, the total amount of CO2 emissions can be
determined by the electricity consumption in the various sectors17 which is being supplied, by the electricity production from a mix of different technologies18 that differ in their need for fossil fuels19 (e.g. old coal plants need more coal than new ones, wind farms need no fossil fuel) which in turn will have different emission factors20, implying differing CO2 emissions per energy unit (i.e. gas less than
coal). An in‐depth description of the decomposition equation is provided in the background document accompanying this policy paper entitled WP 1.2: Comparison Methodologies. Input data from all of the decarbonisation scenarios were collected and supplemented with transparent gap‐ filling techniques to ensure that the decomposition equation could be successfully executed.21 Based upon the Laspeyres decomposition method, the isolated effect of a causal factor on the CO2 emissions of the power sector in 2050 was calculated by changing the value of a causal factor to its scenario value in 2050 whilst ensuring that the remaining causal factors remain at their base year value. By replicating this calculation for all the causal factors, the outcome of the decomposition analysis is to attribute changes in emissions to changes in the consumption of electricity, the production of electricity from different technologies, the fossil fuel input and the different emission factors associated with the use of different fossil fuels.22 16 t t fos t t f t t t I E P I C E (1 )
17 In the decomposition equation this is referred to as ‘electricity consumption’,C
t , which is defined as
the consumption of electricity from various sectors at time step t.
18 In the decomposition equation this is referred to as ‘electricity production’, f
t
1 , which is defined as
the share of production from CO2 emitting electricity generation technologies at time step t.
19 In the decomposition equation this is referred to as ‘fuel input intensity’, I
t/Ptfos, which is defined as
the fossil fuel input per unit of electricity production at time step t.
20
In the decomposition equation this is referred to as ‘emission factor’, which is defined as the CO2
emissions per unit of fossil fuel input at time step t, Et/It.
21
See WP 2.2. Quantitative analysis of existing EU‐wide studies (hereafter WP 2.2.).
22 The extent to which we can attribute the observed changes in the variable of interest to the
explanatory factors depends upon the size of the residual from the decomposition. The residual occurs
due to the ‘mixed effect’ of explanatory factors interacting with one another to contribute to the
observed change in the variable of interest. The residual has been distributed to the causal factor
17
3.2
Results
The results of the decomposition analysis in the year 2050 are presented in Figure 5 (top) along with the respective electricity generation mix of the decarbonisation scenarios (bottom). The coloured bars in Figure 5 (top) for each decarbonisation scenario represent the CO2 emission change from the base year due to different causal factors, which can either positively or negativelycontribute to CO2 emissions. For example, Figure 5 (top) shows that additional CO2 emissions would result from a phase out or the reduced use of nuclear power as illustrated by the negative brown segment while additional deployment of renewable energies (i.e. the positive green segment) would result in CO2 emission reductions. The net emission reduction delivered by each decarbonisation
scenario (i.e. actual emission reductions) is determined by subtracting the additional emissions (i.e. negative segments) from the gross emission reductions (i.e. positive segments).23
The coloured bars in Figure 5 (bottom) for each decarbonisation scenario represents the absolute contribution of an electricity generating technology, which is measured in TWh, in supplying electricity. For example, the absolute contribution of wind energy in supplying the total electricity of a decarbonisation scenario in the year 2050 is illustrated by the purple segment. It is important to acknowledge that the total electricity demand varies between the decarbonisation scenarios due to the different assumptions with regard to electricity consumption, which were previously discussed in Section 2. Figure 5 demonstrates the relationship between changes in emission levels (compared to the base year) and changes in the electricity generation mix that are associated with the different decarbonisation scenarios by the year 2050. For example, the rapid deployment of renewable energy technology (excluding imports) envisaged in the Greenpeace Adv. Rev. scenario represents 81 % of the electricity generation mix and is responsible for 121% (57% of the gross emission reductions by causal factors)24 of emission changes by 2050. However, the absence of nuclear power in the electricity generation mix of the Greenpeace Adv. Rev. scenario in 2050 is reflected by additional emissions of 45 % that need to be offset by additional emission reductions (i.e. deployment of renewables, imports). The Greenpeace Adv. Rev. scenario is dependent upon considerable electricity imports, which represent 17 % of the electricity generation mix and account for 31 % (14 % of the gross emission reductions by causal factors) of emission changes by 2050.
23 The positive part of each column in Figure 5 (top) represents the gross emission reductions achieved
by the causal factors. The positive part of each column is longer than the actual emission reductions
achieved because additional emissions triggered by factors depicted in the negative part of each
column need to be compensated for in order to reach the emission goal of each scenario which is
equal to the net emission reductions achieved.
24 The value in the bracket represents the share of that causal factor’s emission reduction on the gross
emission reductions achieved by the causal factors. These shares are illustrated in the Annex for each
scenario. Hereafter all brackets following text on emission changes will refer to the share of that
18
Figure 5 Overview of the contribution of different causal factors to emission changes in 2050
compared to the base year (top) accompanied by the electricity generation mix within the
different scenarios (bottom)
‐120% ‐100% ‐80% ‐60% ‐40% ‐20% 0% 20% 40% 60% 80% 100% 120% 140% 160% 180% 200% 20 50 20 50 20 50 20 50 20 50 20 50 Greenpeace Rev. Greenpeace Adv. Rev. Eurelectric Power Choices ECF 40% ECF 60% ECF 80% % CO 2 em issi o n re du ct io n co m p ar ed to base yea r
Fuel input intensity Emission factor Renewables CCS Imports Nuclear Consumption
em is sion change s emiss io n ad d iti on s gros s e m issio n reduct io ns ne t emission re duct ions 0 500 1000 1500 2000 2500 3000 3500 4000 4500 5000 Greenpeace Rev. Greenpeace Adv. Rev. Eurelectric Power Choices ECF 40% ECF 60% ECF 80% TW h
Nuclear Solids Petroleum products Natural gas
Biomass Hydro Wind Solar
Geothermal Other renewables Net imports
19 In contrast, ECF 40 % is the only decarbonisation scenario analysed whereby nuclear energy contributes to emission reductions in 2050, accounting for 30 % of the electricity generation mix (Figure 5). With the exception of the Greenpeace decarbonisation scenarios, which are not supportive of the commercialisation of CCS, the remaining decarbonisation scenarios all expect that the deployment of CCS technology will deliver considerable emission reductions by 2050. For example, CCS technology accounts for around 30 % of the electricity generating mix by 2050 in the Power Choices scenario contributing to emission change of 48 % (29% on gross emission reductions) relative to the base year (Figure 5). It is evident that all of the decarbonisation scenarios will require major changes in the energy system (i.e. transmission lines for offshore wind and imports, pipelines for CCS), which will be associated with long lead times that need to guide the timing of political action in order to realise these ambitious decarbonisation scenarios.
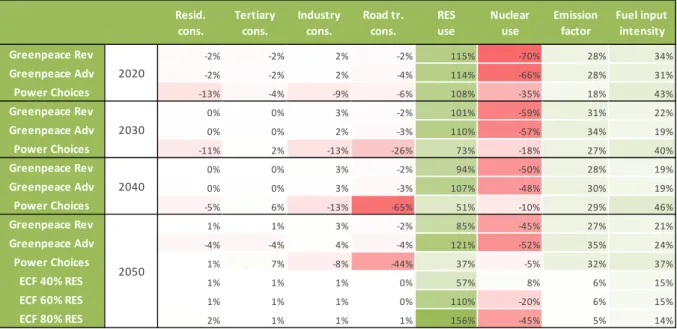
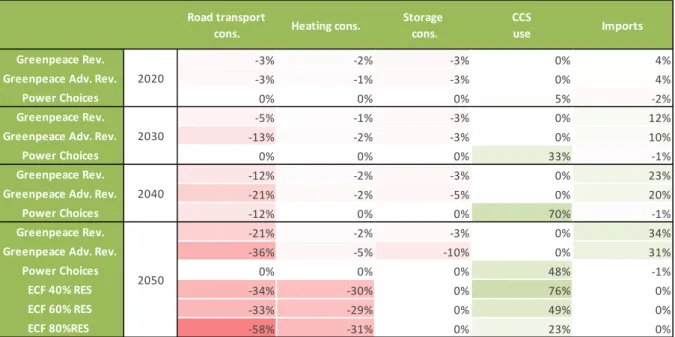
Table 1 Decomposition results of CO2 emission reduction in 2050 for the decarbonisation
scenarios. Greenpeace Rev Greenpeace Adv. Rev. ECF 40 % RES ECF 60 % RES ECF 80 % RES Eureletcric Power Choices Residential cons. 8 ‐59 8 8 8 16 Tertiary cons. 8 ‐55 8 8 8 98 Industry cons. 40 51 12 12 12 ‐104 Transport cons. ‐21 ‐57 1 1 1 ‐582
Road transport cons. ‐275 ‐509 ‐461 ‐460 ‐446
Heating cons. ‐21 ‐64 ‐404 ‐402 ‐390 Other cons. ‐2 ‐3 0 0 38 ‐44 Wind use 489 641 307 687 1000 406 Solar use 271 551 264 644 884 50 Biomass use 240 205 192 191 334 53 Geothermal use 87 259 70 70 68 16 Hydro use ‐5 ‐41 ‐58 ‐58 ‐56 ‐46
Other RES use 27 102 0 0 0 9
Sum RES use 1109 1716 775 1534 2228 488
Nuclear use ‐579 ‐739 106 ‐276 ‐637 ‐71
CCS use 0 0 1033 686 333 643
Hydrogen use 0 10 0 0 0 0
Storage cons. ‐38 ‐140 0 0 0 0
Import 437 436 0 0 0 ‐8
Fuel input intensity 279 333 205 205 199 485
Emission factor 354 495 82 81 79 419
Million tonnes of CO2
Note: Negative values reflect emission additions, while positive values reflect emission reductions.
Source: Öko‐Institut / Wuppertal Institut (2012)
The results of the decomposition analysis are illustrated further in Table 1, which outlines the
absolute reduction in CO2 emissions between the base year and 2050 attributed to each causal factor measured in million tonnes of CO2. The CO2 emission reduction is either negative and thus
characterised by additional emissions (i.e. red shading) or is positive and characterised by emission reductions (i.e. green shading). It is important to acknowledge that the emission changes in one scenario are not directly comparable with another scenario as this would require the results to be
20 normalised to account for differences in the base year. However, the trends that emerge from the scenarios decomposition analysis are clear. All of the decarbonisation scenarios analysed in this policy paper assume that electricity consumption will increase considerably for road transport and heat applications by 2050. This is due to the envisaged growth in new electric appliances (i.e. electric mobility, heat pumps), reducing CO2 emissions by switching from other fuels to low carbon electricity. This trend is dependent however upon political action, which will be necessary to facilitate the commercialisation of new appliances such as electric vehicles, which are currently too expensive for a widespread diffusion. For example, political action may consist of public investments in infrastructural developments (i.e. charging points) and tax subsidies to lower the capital costs associated with purchasing electrical vehicles. As a consequence of the increase in electricity consumption for both road transport and other new appliances used for heating in 2050, additional CO2 emissions will be generated within the electricity system.25 It is therefore essential that political action is taken in parallel to transform the energy system so that low carbon technology is primarily used to generate electricity. It is important to acknowledge that efficiency improvements in traditional applications in the residential, tertiary, industry and transport sectors will not nearly offset the increase in electricity consumption from the new appliances by 2050 as well as additional electricity consumption caused by GDP growth in any of the decarbonisation scenarios, given the base year’s electricity mix. The decomposition analysis demonstrates that an increase in the share of electricity generated from renewable technology will result in considerable emission reductions by 2050. All of the decarbonisation scenarios envisage that wind energy will account for the largest share of electricity generation from renewables in 2050. There is also a general consensus that an increase in solar and biomass energy will greatly contribute to emission reductions in 2050. The increasing deployment of renewables in all of the decarbonisation scenarios assumes that the cost of electricity generation will reduce over time (see Section 4); however political action in the form of market deployment policies as well as public investment in the research and development of renewable technologies will be necessary for these cost assumptions to materialise. Policy makers also need to address the existing barriers to the deployment of renewables (i.e. planning permission, capital costs) that considerably increase lead times. Infrastructural investments in transmission grids and storage technology will be necessary in the longer term to overcome issues concerning both the distribution of electricity and the intermittency of supply.26
25 Given that the decomposition analysis only calculates the ‘isolated effect’ of a causal factor, the
emissions reduction from an increase in consumption is negative (i.e. additional emissions) as the
energy mix remains the same as in the base year. The residual of the decomposition accounts for
‘mixed effects’ such as an increase in electricity consumption and an increase in the share of
renewables in the energy mix and is distributed proportionally to each causal factor, so that the mixed
effects are accounted for.
26 The power system model applied in the ECF study provides sufficient temporal and spatial resolution
to properly take into account the fluctuating nature of these sources. The model endogenously
decides on least‐cost strategies to deal with the fluctuation, choosing for example between building
21 There is agreement amongst the decarbonisation scenarios that CO2 emissions will be reduced by 2050 as a consequence of an increase in the average conversion efficiency of the remaining fossil fuel plants (i.e. an improvement in the fuel input intensity) and due to the fossil fuel input becoming cleaner (i.e. an improvement in the emission factor by fuel switch from coal to gas). All of the decarbonisation scenarios expect the average conversion efficiency of fossil fuel plants and the cleanliness of the fossil fuel input to improve by 2050.27 The increasing efficiency of fossil fuel consumption and the switch from coal to gas envisaged in these decarbonisation scenarios may be further encouraged by reducing the subsidies associated with fossil fuel use and by setting CO2 taxes to increase the cost of fossil fuel use. In order to provide policy makers with further insights into the importance of the timing of political action between 2020 and 2050 to reduce CO2 emissions; Figure 5 (top) is extended in Figure 6 to show how the different causal factors contribute to CO2 emission change at various time horizon intervals (i.e. 2020, 2030, 2040 and 2050) always compared to the base year. The emissions relative to the base year are illustrated in Figure 6 by the dark green line for each decarbonisation scenario, which demonstrates that in all scenarios the gross emission reductions offset the additional emissions so that the power sector is nearly fully decarbonised by 2050. Although all of the scenarios achieve an almost fully decarbonised power sector in Europe by 2050, the combinations of causal factors differ between the decarbonisation scenarios, which influence the overall timing of CO2 emission reductions. For example, the Greenpeace Adv. Rev. scenario depends primarily upon the deployment of renewable energy to reduce CO2 emissions maintaining a high contribution to CO2 emission reductions (i.e. in excess of 100 %) throughout the 2020 to 2050 period. In contrast, the contribution of renewable energies to emission reductions in the Power Choices scenario declines throughout the 2020 to 2050 time frame and is progressively substituted by the emergence of CCS technology (i.e. illustrated by the red bars in Figure 6). The rate at which CO2 emission reductions occur between 2020 and 2050 in these scenarios reflect their different use of abatement measures. For example, initially the rate of CO2 emission reductions in the Greenpeace Adv. Rev. scenario is higher than in the Power Choices scenario. However, with the commercialisation of CCS technology the rate of CO2 emission reductions increases significantly in the Power Choices scenario between 2030 and 2040. This presumes that major breakthroughs in technological development and costs of CCS technology will be realised in the coming 10 to 20 years and that there will be sufficient public acceptance for CO2 pipelines and storage facilities in Europe.
lines. The models used in the other two studies are not explicit power system models and do not have
a comparable level of spatial and temporal resolution.
27
A biomass correction factor was applied to the CO2 emissions output of the Power Choices scenario in
2050 so that the fuel input intensity and emission factors positively contributed to emission reductions.
The CO2 emissions reported in the study in relation to fuel input yielded a fuel mix too emission
intense, given the fuel switch also reported in the study. It was thus assumed that biomass emissions
were included in the reported CO2 emissions. Assuming that 20 % of biomass emissions are non‐
22
Figure 6 Overview of the contribution to emission change from the base year of different causal
factors in the decarbonisation scenarios between 2020 and 2050
‐150% ‐100% ‐50% 0% 50% 100% 150% 200% 250% Bas e ye ar 202 0 203 0 204 0 205 0 Bas e ye ar 202 0 203 0 204 0 205 0 Bas e ye ar 202 0 203 0 204 0 205 0 Bas e ye ar 202 0 203 0 204 0 205 0 Bas e ye ar 202 0 203 0 204 0 205 0 Bas e ye ar 202 0 203 0 204 0 205 0 Greenpeace Rev. Greenpeace Adv. Rev. Eurelectric Power Choices ECF 40% ECF 60% ECF 80% % CO 2 em is sions / em is sion re du ct io ns co mpa re d to ba seye ar
Fuel input intensity Emission factor
Renewables CCS
Imports Nuclear
Consumption Remaining emissions (% of base year)
Source: Öko‐Institut / Wuppertal Institut (2012)
With the exception of the ECF 40 % scenario, the remaining decarbonisation scenarios envisage that the role of nuclear power in the production of electricity will decline between 2020 and 2050 resulting in additional CO2 emissions by 2050. The phase out of nuclear power may result in additional CO2 emissions because it would need to be replaced by alternative sources of electricity production that may – under specific circumstances ‐ be more CO2 intensive. However, as Figure 6 demonstrates, the deployment of renewable energies alone in all scenarios is more than sufficient to offset additional emissions associated with a decrease in the use of nuclear energy. The consumption of electricity (i.e. illustrated by the blue segment in Figure 6) in 2050 increases in all decarbonisation scenarios compared to the base year and therefore also contributes to additional CO2 emissions that need to be offset by CO2 emission reductions contributed by other causal factors (i.e. renewables, fuel switching from coal to gas, improvements in the combustion efficiency of fossil fuel plants etc.).
23
4. Cost assumptions of the scenarios
All of the decarbonisation scenarios considered in this metastudy are characterised by a similar level of ambition (i.e. to reduce CO2 emissions by at least 90 % by 2050), yet it is evident that the combination of abatement measures to deliver these CO2 emission reductions vary. To a certain extent, the difference between decarbonisation scenarios can be explained by the setting of normative targets for the deployment of specific technologies.28 For example, the use of nuclear power plants and CCS technology has not been considered in the Greenpeace scenarios due to sustainability concerns. However, even within such pre‐defined constraints the cost assumptions of various power generation technologies are still a key driving factor influencing the structure of electricity supply in all of the decarbonisation scenarios.29 The aim of this section is to provide a transparent comparison of the various assumptions (i.e. fossil fuel price, capital expenditure and electricity generation costs) applied in these decarbonisation scenarios regarding the cost development of the various power generating technologies until 2050.
4.1
Fossil
fuel
prices
The fossil fuel prices assumed within the ECF Roadmap 2050 scenarios are much lower than those in the Greenpeace scenarios (Table 2). Fossil fuel prices in the ECF Roadmap 2050 scenarios rise moderately between 2015 and 2030 and stay flat in the following two decades, prices still remain lower than they were on average in the year 2008, when crude oil for example sold at 80 €2005/barrel. In contrast, the fossil fuel prices assumed in the Greenpeace scenarios increase considerably, with crude oil reaching 124 €2005/barrel in 2030 (remaining flat thereafter) and the natural gas price more than doubling between 2008 and 2050, increasing from 9 €2005/GJ (2008) to 22 €2005/GJ (2050).
Table 2 Fossil fuel import prices (in €2005) in the ECF Roadmap 2050 and Energy Revolution scenarios
in 2015, 2030 and 2050
Crude oil import price
(€2005/barrel)
Natural gas import price
(€2005/GJ)
Hard coal import price
(€2005/tonne) 2015 55 6 57 2030 73 9 69 2050 73 9 69 2015 92 12 96 2030 124 16 118 2050 124 22 143 ECF Roadmap 2050 Greenpeace Energy Revolution
Source: Öko‐Institut / Wuppertal Institut (2012)
28
This is also explicitly the case for all the ECF Roadmap 2050 policy scenarios. The ECF Roadmap 2050
scenarios have been developed by explicitly prescribing varying shares of renewables, nuclear and CCS
technologies to be reached by 2050. In the Power Choices scenario no such technology‐specific
requirements are pre‐defined.
29
See the Annex on the energy models used in the studies for further information about the importance
24
4.2
Capital
expenditure
The capital expenditure for all conventional fossil fuel power plant technology is expected to moderately decrease between 2030 and 2050 in both the ECF Roadmap 2050 and Energy Revolution studies (Figure 7)30. When these capital expenditure assumptions are compared to the respective base year of each study, it is evident that non‐CCS natural gas power plants31 becomes 13 % cheaper between 2010 and 2050 in the ECF Roadmap 2050 study and 9 % cheaper between 2007 and 2050 in the Energy Revolution study. Although there is a general consensus that the capital expenditure for renewable technology will decrease at a faster rate than experienced by more mature fossil fuel technologies, the scale of this capital expenditure development differs between the studies. For example, while specific investments costs for onshore wind plants decrease by about 40 % in the Energy Revolution study between 2007 and 2050, they are reduced by only about 10 % in the ECF Roadmap 2050 for the 2010 to 2050 time horizon. In contrast, the ECF Roadmap 2050 study foresees more potential to reduce investment costs in solar thermal and biomass power plants until 2050.
Figure 7 Capital expenditure (in €2010/kW) for various fossil and renewable energy technologies in the
ECF Roadmap 2050 and Energy Revolution scenarios in 2030 and 2050
0 500 1000 1500 2000 2500 3000 3500 4000
hard coal (non‐CCS) natural gas (CCGT, non‐CCS) wind onshore wind offshore solar PV solar thermal biomass hard coal (non‐CCS) natural gas (CCGT, non‐CCS) wind onshore wind offshore solar PV solar thermal biomass 20 30 2 05 0 Capital expenditure (€ 2010 /kW) Energy Revolution ECF Roadmap 2050
Source: Öko‐Institut / Wuppertal Institut (2012)
30 No figures for capital expenditure are provided by the Power Choices study.
31 Capital expenditure for natural gas CCS plants is assumed to decrease by 35 % from 2020 to 2050 in
the ECF Roadmap 2050 study. No comparison is possible as no such plants are built in the Energy
25
4.3
Electricity
generation
costs
The electricity generation costs for some fossil and renewable technologies between the Power Choices and the Energy Revolution scenarios in 2030 and 2050 are outlined in Figure 8.32 While in the Energy Revolution study generation costs of fossil technologies are assumed to increase (as increasing fossil fuel and CO2 prices overcompensate moderately falling technology costs), they slightly decrease over time in the Power Choices scenario. These opposing trends lead to considerably different coal and natural gas generating costs by the middle of the century. Even more pronounced are the differences between the two studies in respect to the generating costs of renewables. Here cost reductions are much more dramatic in the Energy Revolution study than in the Power Choices study, leading to drastically different generating costs especially for solar PV and solar thermal power plants. By 2050, solar PV generating costs are about 1/5th in the Energy Revolution scenarios and solar thermal generating costs about 1/3rd of the costs in the Power Choices scenario
.
Figure 8 Generation costs (in €‐cent2010/kWh) for various fossil and renewable energy technologies in
the Power Choices and Energy Revolution scenarios in 2030 and 2050
0 5 10 15 20 25 30 35 40 coal natural gas (CCGT) wind onshore solar PV solar thermal coal natural gas (CCGT) wind onshore solar PV solar thermal 20 30 20 50 Electricity generation costs (in €‐cent 2010/kWh) Energy Revolution Power Choices
Source: Öko‐Institut / Wuppertal Institut (2012)
32 No figures for electricity generation costs are provided in the Roadmap 2050 study. Fossil fuel costs
provided for the Power Choices scenario are at a CO2 price of 30 €2008/t. The CO2 price is assumed to