ISSN:1991-8178
Australian Journal of Basic and Applied Sciences
Journal home page: www.ajbasweb.com
Corresponding Author: Fakroul Hashim, National Defense University of Malaysia, Department of Electrical & Electronics Engineering, Faculty of Engineering, Sg Besi Camp, 57000 Kuala Lumpur, Malaysia.
E-mail: [email protected]
Comparative Study on Activation Function based Heart Abnormality Activity
Fakroul Ridzuan Hashim, Ja’afar Adnan, Nik Ghazali Nik Daud & Amir Firdaus Rashidi
National Defence University of Malaysia, Department of Electrical & Electronic Engineering, Faculty of Engineering, Sg Besi Camp, 57000 Kuala Lumpur, Malaysia
A R T I C L E I N F O A B S T R A C T Article history:
Received 10 January 2016 Accepted 15 February 2016 Available online 28 February 2016
Keywords:
Heart abnormality; Hybrid Multilayer Perceptron; Activation Function; Electrocardiogram; accuracy
The detection of heart abnormality activity of a patient is important when an abnormal symptom occurred. This project is aimed to detect the disease by using hybrid multilayer perceptron (HMLP) network. Several data from the electrocardiogram (ECG) signal is extracted to be set as input parameters. In order to get the best result, several activation function are used, such as logistic, hyperbolic, exponential, step and square root. The result obtained is then compared among the activation function and other detection techniques.
© 2016 AENSI Publisher All rights reserved. To Cite This Article: Fakroul Ridzuan Hashim, Ja’afar Adnan, Nik Ghazali Nik Daud & Amir Firdaus Rashidi. Comparative Study on Activation Function based Heart Abnormality Activity. Aust. J. Basic & Appl. Sci., 10(7): 99-103, 2016
INTRODUCTION
One of the common diseases suffered by people around the world especially in Malaysia is heart abnormality or also known as heart disease. The disease may occur when a blood clot blocks the blood flow into the heart (NIH) 2013. This causes the narrowing of the artery that connected to the heart. If the main artery to the heart is blocked completely by the blood clots, the blood supply eventually will stop flowing into the heart which causes the heart demands for oxygen since oxygen is needed to pump back the blood to the entire body. After some time, the heart muscle will weakened thus supplying less blood to the entire body due to lack of oxygen. The situation leads to the heart attack.
Electrocardiogram (ECG) is one of the most efficient ways to detect the heart abnormality. It is the essential source in detecting any cardiac abnormality or heart disease for doctors. ECG functions as a sensor for any electrical activity that generated by the heart and occurs on the surface of the body (Robert Myers). Some skin electrodes are placed at certain specific areas of the body to gather the measurement that is being recorded by ECG. Nevertheless, pitfalls do exist in electrocardiograhy (Robert Myers,). Particularly, even with the presence of critical heart problems, an ECG may appear normal. A patient with a normal ECG may rarely grow a significant change indicating a heart attack 10 minutes after the test. This is due to the fact that the ECG only records at one point in time, like taking a picture.
It happens because the symptoms might not have been present during the test was performed, while the patient may have a history of cardiac symptoms. Consequently, the result of the test may appear normal for a patient who is suffering from a serious heart disease since the test is unable to identify any narrowing inside an artery, unless the test is performed during physical stress or when a heart attack occurs. Likewise, even though the ECG is the definitive test in patients with a rhythm disturbance, for a patient who is not experiencing an arrhythmia during the test is performed, the result of the test may appear normal in spite of the patient actually does have a serious heart problem.
Some features from the ECG signal such as the amplitude and duration of P wave, QRS complex and T wave can be used as input vectors for the HMLP network by extracting them from the ECG signal so that these features can be utilised to identify the heart abnormality activity precisely. In order to activate the HMLP network, numbers of activation function are used.
Literature Review:
Several features are available in ANN encompassing high processing speeds and the ability to learn the solution of a given problem through a set of data or examples. The most suitable and referred neural networks in pattern recognition detection is Multilayer Perceptron (MLP). MLP can be trained to produce several decision surfaces in the input space (Stuart Russell, Peter Norvig, 2010).
Hybrid Multilayer Perceptron (HMLP):
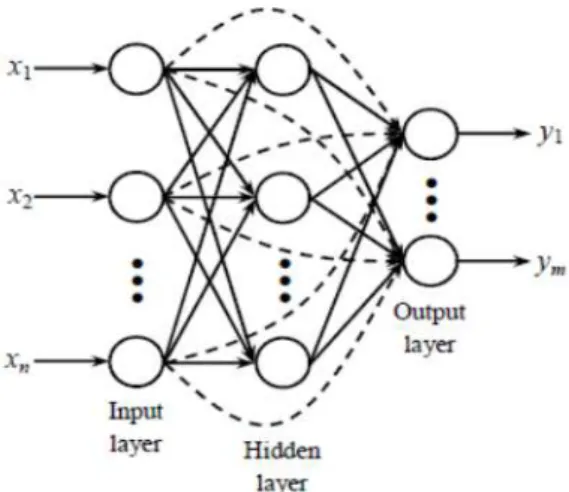
An MLP network is a feed-forward artificial neural network that maps a set of input onto a set of suitable output (Megat Ali, M.S.A., et al., 2012). MLP network consists of an input layer, at least one hidden layer and an output layer. The number of input and output variables affect the number of nodes in the input and output layers respectively (Negnevitsky, M., 2005). It has been proven that one hidden layer is adequate for approximation of continuous function up to a specific acceptable accuracy (Funahashi, K.I., 1989).
By using activation function , the input
vector is converted to a vector of hidden variables
.
The output of the node in the hidden layer can be expressed by (1)
(1)
and represent the weight and bias of the
connection between the node in the hidden layer and the node respectively. The modified version of MLP, the HMLP network was introduced as an optimized solution capable of modelling both linear and non-linear systems (Mat Isa, N.A., et al., 2008). The standard connection of an HMLP network is shown in Fig. 1 below.
Fig. 1: HMLP network’s architecture.
Through weighted connections, the inputs are directly connected to the output nodes thus forming a linear model which is in parallel with the model of the conventional non-linear MLP (Mat Isa, N.A. and W.M.F. Wan Mamat, 2011). Hence, the output,
from the HMLP network can be expressed in (2)
(2)
Activation Function:
The most important unit in neural network structure is their net inputs by using a scalar-to-scalar function called “the activation function or threshold function or transfer function”, output a result value called the “unit's activation”. An activation function for limiting the amplitude of the output of a neuron. Enabling in a limited range of functions is usually called squashing functions (Mat Isa, N.A. and
W.M.F. Wan Mamat, 2011; Benjamin Wedro, et al.). It squashes the permissible amplitude range of the output signal to some finite value.
Some of the most commonly used activation functions are to solve non-linear problems. These functions are:
1. Unipolar Sigmoid (US) - Activation function US function is given as follows:
This function is especially advantageous to use in neural networks trained by back-propagation algorithms. Because it is easy to distinguish, and this can interestingly minimize the computation capacity for training.
This function is similar to the sigmoid function, it goes well for applications that produce output values in the range of [-1, 1].
3. Tangent Hyperbolic (TH) – This function is easily defined as the ratio between the hyperbolic sine and the cosine functions or expanded as the ratio of the half‐difference and half‐sum of two exponential functions in the points x and –x as follows :
TH function is similar to sigmoid function. Its range outputs between -1 and 1.
4. Conic Section Function (CSF) - CSF is based on a section of a cone as the name implies. CSF takes a parameter that determines the angle value of the function. The equation of CSF can be defined as follows:
where is input coefficient, is the center, is the weight in MLP.
Electrocardiogram (ECG/EKG):
A medical tool called electrocardiogram (ECG or EKG) is normally used to record and assess the heart’s muscular functions and electrical activity. The interpretation of the ECG tracing requires a lot of traininig even it is a simple test to perform (Benjamin Wedro, et al.,). There are two stage electrical pumps for the heart an the electrical activity of the heart can be measured by placing electrodes on the skin (Benjamin Wedro, et al.,).
The rate and rhythm of the heartbeat can be measured by the ECG and it can provide indirect evidence of blood flow to the heart muscle as well.
ECG waves interpretation:
ECG signal consists of certain components of waveform which indicate electrical activities that happen in one heartbeat. The waveforms are each labeled P, Q, R, S, T and U (Practical Clinical Skills, 2014). P wave, an initial shortly upward movement of the ECG tracing denotes that the atria are contracting and pumping blood into the ventricles. The QRS complex usually initiates with a downward deflection where Q is a larger upwards deflection, R is a peak and S is a downwards wave. Both depolarization and contraction are represented by the QRS complex while the PR interval represents the transit time for the electrical signal at the sinus node to travel to the ventricles. Ventricular repolarization is represented by the T wave, which is normally a modest upwards waveform.
Methodology:
The input vectors for the HMLP network will utilise six features taken from the ECG data reading. The features are P wave amplitude, QRS segment amplitude, T wave amplitude, P wave duration, QRS segment duration and T wave duration. Therefore, the HMLP network will have 6 input nodes on its network structure. These 6 features are selected due to the changes of the ECG signal condition from normal to abnormal reading as explained in Chapter II. For each condition, the total data used is 200.
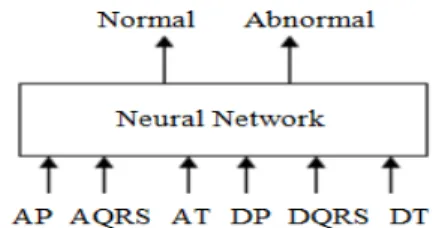
The neural network is randomly fed with all the data. The amount of data used is appropriate to perform the network training. The neural network is used to classify the condition of the heart into two categories which is either normal or abnormal, based on the six features from the ECG signal that are set as input vectors. Two output nodes represent the classification of the heart condition which is normal or abnormal as shown in Figure 6. Each one of the output node works as a detector for the heart condition.
Fig. 2: Heart abnormal detection block by using HMLP Network.
Based on Figure 6, the input vectors are represented by:
AP = Amplitude of P wave
AQRS = Amplitude of QRS complex AT = Amplitude of T wave
DP = Duration of P wave
DQRS = Duration of QRS complex
DT = Duration of T wave
RESULTS AND DISCUSSION
signal from (Physionet PhysioBank ATM.). The 6 input parameters are amplitude of P wave, QRS segment, T wave and duration of P wave, QRS segment, and T wave. The total data selected is 200; 100 for training purpose and 100 for testing sample. Moreover, the results are compared with HMLP network activated by four different activation functions (US, BS, TH and CSF).
The research applies two different analysis which are the optimum structure analysis becomes the first analysis, which is implemented to determine the optimum number of hidden nodes that can produce the best cardiac abnormality classification. In the analysis, the HMLP network activated by four different activation functions (US, BS, TH and CSF). Table 1 shows the result of the analysis for different types of activation function.
Table 1: Performance of optimum structure analysis of HMLP network.
Neural Network Optimum number of hidden nodes
HMLP activated by US 3
HMLP activated by BS 5
HMLP activated by TH 8
HMLP activated by CSF 5
The second analysis, (i.e. the performance comparison analysis) is then applied using the optimum structure of the HMLP network obtained in the first analysis.
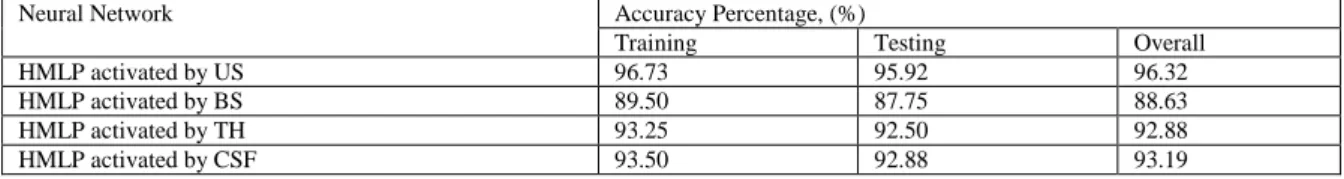
The analysis is done based on the accuracy of correct classifications of heart abnormality. Table 2 shows the result of the analysis for training and testing phase.
Table 2: Performance of accuracy analysis of HMLP network.
Neural Network Accuracy Percentage, (%)
Training Testing Overall
HMLP activated by US 96.73 95.92 96.32
HMLP activated by BS 89.50 87.75 88.63
HMLP activated by TH 93.25 92.50 92.88
HMLP activated by CSF 93.50 92.88 93.19
The results shows in Table 1 show the MLP network trained by the HMLP network forms the simplest network architecture as it only requires 3 hidden nodes as compared to other training algorithms (MLP trained by BP, LM and BR).
For the performance analysis, the results obtained as shows in Table 2 show that the HMLP network with unipolar sigmoid activation function capable to produce the best performance of accuracy with 96.73% and 95.92% for training and testing phase respectively, which gives overall accuracy of 96.32%.
Conclusion:
This paper investigates the capability of neural network to classify the heart abnormality data. This paper study proves that the ANN is capable and reliable to classify the heart abnormality based on both amplitude and duration of the P, QRS and T peak of ECG signal by using four different activation functions. This paper also addresses the selection of appropriate activation function of the neural network may improvement the performance of the network during the optimum structure analysis and the accuracy analysis.
REFERENCES
National Institute of Health (NIH) 2013. “What cause a Heart attack?” [online]. Available :
http://www.nhlbi.nih.gov/health/health-topics/topics/heartattack/causes.html
Robert Myers, “The Benefits and Limitations of Electrocardiography” [online]. Available : http://www.medcan.com/articles/the_benefits_and_li mitations_of_electrocardiography/
Stuart Russell, Peter Norvig, 2010. Artificial
Intelligence ; A modern approach, 3rd ed, Pearson Education Inc., pp: 727-733.
Megat Ali, M.S.A., A.H. Jahidinand A.N. Norali, 2012. “Hybrid Multilayered Perceptron Network for Classification of Bundle Branch Blocks” International Conference on Biomedical Engineering, pp: 149-154.
Negnevitsky, M., 2005 Artificial Intelligence: A Guide to Intelligent Systems, 2nd ed., Harlow, Essex: Addison Wesley.
Funahashi, K.I., 1989. “On the approximate realization of continuous mappings by neural networks,” Neural Networks, 2(3): 183-192.
Mat Isa, N.A., M.Y. Mashor and N.H. Othman, 2008. “An automated cervical pre-cancerous diagnostic system,” Artif. Intell. Med., 42(1): 1-11.
Mat Isa, N.A. and W.M.F. Wan Mamat, 2011. “Clustered-hybrid multilayer perceptron network for pattern recognition application,” Appl. Soft Comput., 11(1): 1457-1466.
Benjamin Wedro, Daniel Lee Kulick, Charles Patrick Davis, “Electrocardiogram (ECG)”; [online].
Available :
http://www.emedicinehealth.com/electrocardiogram_ ecg/page3_em.html.
Practical Clinical Skills, 2014. Retrived on 11
http://www.practicalclinicalskills.com/ecg-interpretation.aspx
Physionet PhysioBank ATM. [online]. Available : http://www.physionet.org/cgi-bin/atm/ATM
Eklund, P., A. Hoang, 2006. A performance survey of public domain supervised machine learning algorithms, Australian Journal of Intelligent Information Systems, 9(1): 1-47.
Sornmo, L. and P. Laguna, 2005. Bioelectrical
Signal Processing in Cardiac and Neurological Applications. Burlington, MA: Elsevier Academic Press.
Mohd Yusoff Mashor, 2003. “Modified
Recursive Prediction Error Algorithm For Training Layered Neural Network” International Journal of