O R I G I N A L R E S E A R C H
Open Access
A coordinated dispatch method with
pumped-storage and battery-storage for
compensating the variation of wind power
Jinghua Li
*, Sai Wang, Liu Ye and Jiakun Fang
Abstract
Growing penetration of wind power challenges to power system security, since the conventional generators may not have sufficient capacity to compensate wind power fluctuation plus the reverse peak regulation. In this paper, the high-capacity pumped-storage and fast-response battery-storage are coordinated to compensate the variation of both wind power and load, aiming at shifting peak load, responding to wind power ramping, reducing the curtailment of wind and stabilizing the output of thermal units. A practical framework is designed for optimizing the operation of the hybrid system consisting of the wind, pumped-storage, and battery storage, which can take full advantages of storage and battery-storage. The detailed mathematical formulations of the pumped-storage and battery-pumped-storage are built. Three cases are studied to demonstrate the advantages of the proposed coordination method.
Keywords:Pumped-storage, Battery-storage, Hybrid energy system, Economic dispatch, Renewable energy
1 Introduction
With the large-scale wind power grid integration, shift-ing peak load and respondshift-ing to the wind power varia-tions become challenging problems. Limited by the adjustable level and ramping rate, the conventional units may not have sufficient capacity to deal with these prob-lems. Storage systems provide an effective way to settle both problems because they can quickly balance the power. However, the utilization of most storage systems is barricaded by the techno-economical feasibilities [1]. For example, compressed-air energy storage [2] and spinning flywheel are considerably complex in practice; the cost of large-scale ultra-capacitors is expensive. Pumped-storage and battery-storage are two most ma-ture and widespread technologies used in practice [3, 4].
Pumped-storage is viewed as the most suitable storage technology to improve the wind power integration for its large capacity [5]. Various techniques have been de-veloped to combine the wind and pumped-storage. Some techniques aim to achieve maximum profit in electrical markets by using pumped-storage as an ancil-lary service for balancing wind power and consumption
[6, 7]. Pumped-storage has proved to bring considerable profits as ancillary service in the electrical market. In re-cent years, with the increasing integration of the renew-able sources, pumped-storage plays an important role in keeping the security of power system by balancing the variations of renewable sources. It is used to balance re-newable sources variations for islanded grids in [8–10]. The detailed mathematical model combing wind power and pumped-storage has been proposed in [8, 9], and the operation strategy for hybrid wind-pumped storage has been investigated in [10]. [8–10] have provided valu-able experiences in wind-pumped coordination in islanded grid. Later, the pumped-storage system is used for a large system in [11]. The effective control methods to accommodate the wind power uncertainty and ensure the system security are investigated in [11]. The Pumped-storage system shows good performances on accommodating the variability of the wind power.
Battery-storage is another kind of storage that has been widely used [12, 13]. It can be flexibly installed in every bus of grid and response to power requirement quickly in sec-onds. Battery-storage is widely used in the load leveling [14], frequency controlling [15], spinning reserves [16], compensating for generation variations [17] and smoothing
* Correspondence:[email protected]
Guangxi University, Nanning, GuangXi, China
the wind power output [18]. These literatures give good examples for applications of battery in micro-grid.
Although there exist many methods and technologies for using pumped-storage or battery-storage to accom-modate the wind power variability. However, most litera-tures are the independent studies of pumped-storage [19, 20] or battery-storage [21, 22], the two together are studied less. Reference [23] proposes a new method for weekly scheduling operating patterns of combining pumped-storage and battery-storage. However, the oper-ating characteristics of pumped-storage and battery-storage, nodal power balance, system security are not considered, which will enlarge the deviation between the dispatch schedule and actual operation.
This paper investigates the optimal coordination of pumped-storage and battery-storage considering the characteristics of pumped-storage and battery-storage. The proposed method focuses on shaving peak load, re-ducing the curtailment of the wind power, stabilizing the output of thermal units and responding to the high ramping events of the wind power. The main contribu-tions of this paper are as following:
A practical framework is designed for optimal operation of wind-pumped storage-battery storage hybrid system, which can take advantages of pumped-storage and battery-storage. The proposed framework can improve the
computational efficiency. It’s not easy to solve the dispatch model, because it includes large scale mix variables and nonlinear constraints [24,25]. This proposed operation framework not only reduces the scale of variables and constraints, but also limits the start-stop times of the thermal units in Intra-Day dispatching.
A security-constrained optimal dispatching problem of a hybrid system of wind, pumped storage, and battery storage is mathematically formulated, with the target of compensating the variation of wind power.
The rest of the paper is organized as follows: Section 2 presents the method outline of the proposed approach; Section 3 presents the detailed mathematic formulation; Section 4 analyses the coordinated framework and calculation-benefit of the proposed method; Section 5 applied the proposed method to modified 6-bus system, IEEE 24-bus system, IEEE 118-bus system and concluding remarks are provided in Section 6.
2 Problem of coordinating of pumped-storage and battery-storage
2.1 Issues brought by large-scale wind power penetration The wind power is featured with uncontrollability and unpredictability [26]. Hence, as large-scale wind power
increasingly penetrates power systems, many issues arise for system operators to keep the power balance.
1) The large difference between peak and valley generations. Usually, the peak of the wind power appears at midnight, when the load is in the valley. It will enlarge the different between peak load and valley load, which is not easy to be compensated by conventional units, because the adjustment of conventional units may not cover the range from peak to valley.
2) High ramping rate event. High rate power ramping up/down events of the wind power may occur unpredictably. However, the conventional units may not have enough regulation capacity. Hence, the curtailment of wind or load shedding will occur if the ramping events cannot be timely dealt with. 3) Serious deviation from the forecast and real wind power. The wind power is not easy to be accurately forecasted as a load. It will burden the operators with large adjustment of units to compensate the deviation.
2.2 Positive roles played by coordinated pumped-storage and battery-storage
Coordination of pumped-storage and battery-storage provides an effective solution for the issues men-tioned above. Pumped-storage has the large capacity so that it has good ability to absorb the redundant power during off-peak periods and produce power during peak demand periods. Pumped-storage can play the important role in shaving the peak load. However, the pumped-storage is critical to geograph-ical location and can’t respond to the fast ramps in the second timescale. For example, in Fig. 1, due to the capacity limit of transmission lines, the power cannot be transferred from pumped-storage to every bus of the grid. Alternatively, battery-storage is a flex-ible and high-speed storage. Battery-storage is very suitable for responding the fast ramps in the second timescale. Hence, it is a good method to combine pumped-storage and battery -storage.
This paper proposes an optimization method to coord-inate the pumped-storage and battery-storage to achieve the four goals shown in Fig. 1.
1) Stabilize the output of thermal units and reduce their frequency of start-stop.
2) Shave the peak load mainly using the pumped-storage.
3) Respond to the fast power ramping with the battery -storage.
3 Mathematical formulation of the coordinated model
In this section, the components of the power system, including the thermal units, the wind farms, the pumped-storage and the battery-storage are introduced first. Based on these component models, the Day-Ahead and Intra-Day dispatch models are formulated.
3.1 The basic dispatch models
The proposed dispatch model minimizes the total system cost throughout the operational horizon. As shown in (1), the total system cost contains four parts: the operational cost of thermal units, start-up and shutdown cost of the thermal units, the start-up cost of pumped-storage units, and the penalty cost of wind power curtailment. The operation cost of the thermal unit is calculated by (2). To accommodate the wind power as much as possible, wind power is considered as free here.
FC¼X
T
t¼1
XNF
i¼1
dFi;tfi;t PFi;t
þXT
t¼1
XNF
i¼1
diF;t1−dFi;t−1CUi;tþdiF;t−11−dFi;tCDi;t þXT
t¼1
XNH
j¼1
dinj;t 1−dinj;t−1
CHþdoutj;t 1−doutj;t−1
CH
þγXT t¼1
XNW
w¼1
PWw;;tcur
ð1Þ
fi;t PF
i;t ¼aiþbiPiF;tþci PFi;t
2
ð2Þ
Where,FCis the total system cost.NF, NH, Nw are the
number of thermal units, pumped-storage units, and wind
farms, respectively.Tis the number of time periods in the scheduling horizon.dFi;t is the state of thermal unitiin the time periodt, dFi;t¼1 denotes the unit is on anddFi;t ¼0 denotes the unit is off. PF
i;t is the active power of thermal
unitiin the time periodt.fi;t PF
i;t is the operational cost
of thermal unitiin time periodt.dj;tout is the generating state of pumped-storage unit j in the time period t,
dj;tout ¼1 denotes the unit is in generating state and
dj;tout ¼0 denotes the unit is not in generating state.
dj;tin is the pumping state of pumped-storage unit j in the time periodt,dj;tin ¼1 denotes the unit is in pump-ing state anddj;tin ¼0 denotes the unit is not in pump-ing sate. CUi;t and CDi;t are the start-up and shutdown cost of thermal unit i in the time period t. CH is the start-up cost of pumped-storage. PWw;t;cur is the
curtail-ment of wind power of wind turbine w in the time
period t. γ is the penalty coefficient of wind curtail-ment. ai, bi, ci are the coefficients of the operational
cost of thermal uniti.
The proposed dispatch objective is subject to the following practical constraints.
1) System operation constraints
dF
m;tP F m;tþ d
out m;tP
H;out m;t −dinm;tP
H;in m;t
þ ddism;tPmB;;dist −dchm;tP B;ch m;t
þPWm;;tav−PWm;;tcur
−Um;t X
n∈m
Un;t Gm;ncosθm;n;tþBm;nsinθm;n;t
¼PLm;pre;t m¼1;2; :::;NM
ð3Þ
X
i∈SF
dFi;t PFi;t−PFi;t
þX
j∈SH
doutj;t PH;out j;t −P
H;out j;t
þX
k∈SB
dkdis;t PkB;;dist −PBk;;tdis
≥Rup t
ð4Þ
X
i∈SF
dFi;t PFi;t−PFi;t
þX
j∈SH
dinj;t PH;in j;t −PHj;t;in
þX
k∈SB
dkch;tPBk;;cht −PkB;;tch≥Rdownt
ð5Þ
Where, SF, SH, SB, SN are the set of thermal units,
pumped-storage, battery-storage and buses, respectively.
NMis the number of nodes. PW, avis the available wind
power. θm, n, tis the voltage angle in degrees with
sub-scriptions m and n denoting the nodal number and t
denoting the time period.Um,tis the voltage magnitude
(p.u) of nodemin the time periodt.PLm;pre;t is the
predic-tion load of nodemin the time periodt.PFi;t and PF i;t are maximum and minimum real power of thermal unitiin the time period t respectively. PHj;t;out is the generated power of pumped-storage unitjin the time periodt, and its maximum and minimum value are PHj;t;out and PHj;t;out
respectively. PHj;t;in is the pumped power of pumped-storage unitjin the time period t, and its maximum and minimum value arePHj;t;in andPHj;t;inrespectively.dchk;tis the charging state of battery-storage unitkin the time period
t, dchk;t ¼1 donates the unit is in charging and dchk;t ¼0 donates the unit is not in charging. ddisk;t is the dis-charging state of battery-storage unit k in the time period t, ddisk;t ¼1 donates the unit is in discharging and ddisk;t ¼0 donates the unit is not in discharging.
PBk;;tch is the charged power by battery-storage unit k
in the time period t, its maximum and minimum
value are PBk;;tch and PBk;;tch. PBk;;tdis is the discharged power by battery-storage unit k in the time period t, its maximum and minimum value are PBk;;tdis and PBk;;tdis
respectively. Rupt and Rtdown are the up and down
spin-ning reserves of systems in the time period t
respectively.
The load balance constraint (3) indicates that the power generated at each bus meets the demand at that node and the losses. The generated power con-tains four parts: thermal power dFm;tPFm;t,
pumped-storage power doutm;tPHm;;outt −dinm;tP H;in m;t
, battery-storage
power dchm;tPBm;ch;t −ddism;tPBm;dis;t
and wind power
PWm;;tpre−PWm;;tcur
.
The system upward spinning reserve requirement (4) ensures that the upward reserve provided by the thermal unit, pumped-storage and battery-storage can meet the up-regulation requirement of the systems.
The system downward spinning reserve requirement (5) ensures that the downward reserve provided by the thermal unit, pumped-storage and battery-storage can meet the down-regulation requirement of the systems.
2) System security constraints
Um≤Um;t≤Um ð6Þ
θm;n≤θm;n;t≤θm;n ð7Þ
jPm;n;t j ¼jU2m;n;tGm;n−Um;tUn;t
Gm;n cosθm;n;t
þBm;nsinθm;n;tÞ j≤ jPfm;nj
ð8Þ
Um and Um are the maximum and minimum voltage
magnitude (p.u) of node m respectively. θm;n and θm;n are the maximum and minimum voltage angle (degree) difference between node mandn respectively.Pm,n, tis
the active power of line from busmto busnin the time periodt.Pfm;nis the flow limit of the line from busmto busn.
The constraints (6)–(8) require that all the electrical equipment works at the rated voltage magnitude; the dif-ference of voltage angle between both ends of a line does not exceed the given range; and the power flow through the line does not exceed its capacity.
3) Thermal units’constraints.
Thermal units are subject to limits on their min/max output capacity (9), ramp up/down limits (10) and (11), minimum up/down time (12) and (13).
dFi;tPFi≤PFi;t≤dFi;tPFi ð9Þ
PFi;t−PFi;t−1≤ΔPFi; PFi;t >PFi;t−1 ð10Þ PFi;t−1−PFi;t≤ΔPFi; PFi;t <PFi;t−1 ð11Þ
Toni;t≥Toni ð12Þ
Toffi;t ≥Toffi ð13Þ
Toni;t=Toffi;t are the continuous on/off time of thermal
units.Ton i =T
off
i are the minimum on/off time of thermal units.ΔPFi is the ramping rate of thermal uniti.
The actual wind power equals to the available wind power minus the wind curtailment as (14). The wind curtailment limit (15) ensures that the wind curtailment is no larger than the forecasted wind power. In this paper, the wind is allowed to be curtailed to ensure the power balance.
PwW;t ¼PwW;t;av−PWw;t;cur ð14Þ
0≤PWw;t;cur≤P W;pre
w;t ð15Þ
Here, PWw;t;av and PWw;t;pre are the available wind power and prediction wind power of wind farm win the time periodt.
5) Pumped-storage constraints.
The pumped-storage unit constraints include
(16)–(22) as described in [12]. The units for power gen-eration and water reserve level are unified to be MWh. Constraint (16) is the hydro water reserve capacity bal-ance.Δtis the time interval betweent-1 andt. It equals to 1 h in this paper. Constraint (17) is the total volume of the water reserve. Constraints (18) and (19) describe the upper and lower bounds of the power absorbed and generated by the pumped-storage units. Constraints (20) and (21) give the initial and target water level for the pumped-storage units. Constraint (22) ensures that the pumped-storage units cannot absorb and generate elec-tricity at the same period.
Cj;t¼Cj;t−1þηinPHj;t;inΔt−
PHj;t;out
ηout Δt
∂2Ω
∂u2 ð16Þ
C≤Cj;t≤C ð17Þ
dinj;tPHj;t;in≤PjH;t;in≤dinj;tPHj;t;in ð18Þ
djout;t PjH;t;out≤PHj;t;out≤doutj;t PHj;t;out ð19Þ
Cj;0¼Cj;begin ð20Þ
Cj;T¼Cj;last ð21Þ
doutj;t þdinj;t≤1 ð22Þ Cj,tis the water reserve of pumped-storage stationjin
the time periodt. C andC are the maximum and mini-mum of water reserve respectively. Cj, begin and Cj, last
are the initial and target water reserve of pumped-storage station j respectively. ηin and ηout are the efficiency of pumping and generating cycle of pumped-storage units respectively.
6) Battery-storage constraints.
The battery-storage unit constraints include
(23)–(28). Constraints (23) and (24) are the power capacity limits of the battery-storage. Constraint (25) is the conversion relationship between energy and
power. Constraint (26) describes the energy capacity of the battery. Constraint (27) requires the energy stored in the battery at the end of the day (period T) equals to the initial energy. Constraint (28) ensures that the battery-storage units cannot discharge and charge electricity at the same period.
0≤PBk;;tch≤PBk;ch ð23Þ
0≤PBk;;tdis≤PBk;dis ð24Þ
Ek;t¼Ek;0þ
Xt
τ¼1
ηch
kP
B;ch k;τ −
1
ηdis k
PBk;;tdis
!
ð25Þ
0≤Ek;t≤Ek ð26Þ
Ek;T¼Ek;0 ð27Þ
dchk;tþddisk;t≤1 ð28Þ
Where, Ek, tis the energy charge of battery-storage k
in the time period t. Ek, 0 is the initial state of charge
(SOC) of battery-storagekin the time periodt.Ekis the capacity of battery-storage k. ηch and ηdis are the effi-ciency of charging and discharging cycle of battery-storage respectively.
3.2 Day-ahead dispatch model
Battery-storage do not appear in the optimization in the Day-Ahead dispatch model. Fix dchk;t ¼0, dkdis;t ¼0,k∈SB, t∈Tand then solve the Day-Ahead optimization prob-lem consisted of (1)–(22). Then the optimal plan is ob-tained, which contains the following results:
1) Unit commitment and economic dispatch plan of thermal units dFi;t;PF
i;t
.
2) Pumped-storage plan dinj;tPHj;t;in;doutj;t PHj;t;out
.
3) Wind curtailmentPWw;t;cur.
3.3 Intra-day dispatch model
In the Intra-Day dispatch model, the unit commitment of thermal units are fixed, and the Intra-Day model con-sisted of (1)–(28) is rolling computed hourly based on the feedback information of the grid. Pumped-storage and battery-storage are fully coordinated to cope with the wind power variation in the Intra-Day dispatch. The following results are obtained to control the units:
1) Economic dispatch command of thermal unitsPF i;t.
2) Pumped-storage command dj;tinPjH;t;in;dj;toutPH;out j;t
.
3) Battery-storage command dchk;tPBk;;tch;ddisk;tPBk;;tdis
These results are used to dispatch the units to shift the peak load, respond to the high rate power ramping events, reduce the curtailment of wind and stabilize the output of thermal units. The units are dynamically opti-mized across the complete time horizon of interest.
4 Coordinated framework and calculation-benefit analysis for the proposed coordinated dispatch method
4.1 Coordinated framework of pumped-storage and battery-storage
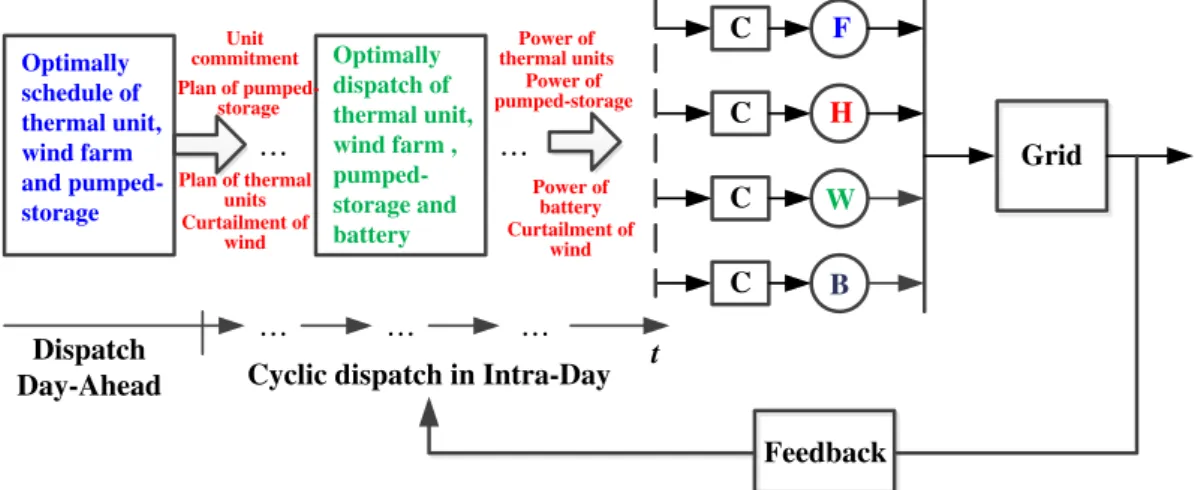
Figure 2 depicts the proposed framework to coordinate pumped-storage and battery-storage. It is a closed-loop dispatch process including Day-Ahead and Intra-Day dispatch as follows.
1) Day-Ahead dispatch. It is a unit commitment model including multi-time period Alternating Current Optimal Power Flow with security constraints (Shorted as UC-AC-OPF model). Thermal units, wind farms, and the pumped-storage are optimized together. The Day-Ahead dispatch is to make schedules to balance the short-time forecast wind power and load. The model considers the security constraints and the pumped-generated process of the pumped-storage. Due to the limited capacity, battery-storage is only used in the Intra-Day dispatch, but not used for the Day-Ahead plan. The scheduling plan from Day-Ahead is regarded as the base plan for Intra-day dispatch.
2) Intra-Day dispatch. It is an economic dispatch model considering Alternating Current Optimal Power Flow with security constraints (Shorted as ED-AC-OPF model). To avoid frequent start or stop of the thermal generators, unit commitment schedule is fixed in Day-Ahead dispatch and kept unchanged at this stage. The ED-AC-OPF model is a
rolling computation per hour to modify the base plan from Day-Ahead. The Intra-Day dispatch is to make schedules to balance the very-short-time (Hour-Ahead or Minute-Ahead) forecast wind power and load. Due to the forecast accuracy of Hour-Ahead or Minute-Ahead is higher than that of Day-Ahead, the errors of Day-Ahead forecast are balanced by the rolling dispatch in Intra-Day. The thermal units, wind farms, pumped-storage and battery-storage are optimized together according to the system operation conditions, such as the load and wind power. The outputs of this model are used to control the thermal units, wind farms, pumped-storage and battery-pumped-storage.
There are three major advantages of the proposed framework in Fig. 2.
1) The two-stage optimal dispatch consists of the Day-Ahead stage and rolling Intra-Day stage. It is a closed-loop dispatch process to compensate the forecast inaccuracy of both wind power and load. It avoids the large power flow transfer in the real-time operation. Besides, UC-AC-OPF with secure constraints is considered to enhance the quality of the scheduling.
2) Battery-storage does not participate in power balancing at the Day-Ahead stage. It can reduce the required battery capacity. Also, this strategy can reduce the optimization variables and constraints of UC-AC-OPF problem.
3) The unit commitment of thermal units is kept unchanged at the Intra-Day stage. This strategy ensures the thermal units do not frequently start-stop in operation. Also, the variables and constraints of ED-AC-OPF model are greatly reduced, and the burden of calculation is relieved.
Grid F
B W
H C
C
C
C
t
Dispatch
Day-Ahead Cyclic dispatch in Intra-Day
Feedback
Optimally schedule of thermal unit, wind farm and pumped-storage
Unit commitment Plan of
pumped-storage
Plan of thermal units Curtailment of
wind
Optimally dispatch of thermal unit, wind farm , pumped-storage and battery
Power of pumped-storage
Power of battery Power of thermal units
Curtailment of wind
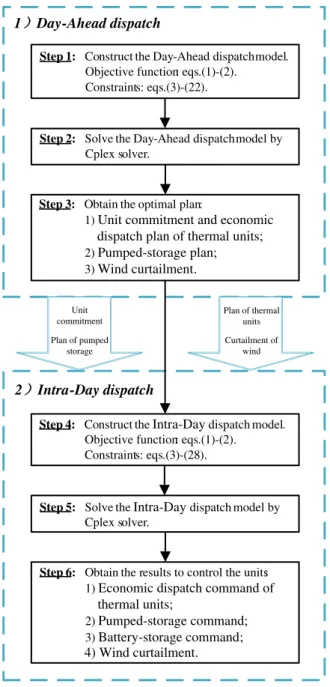
In summary, the flowchart of the coordinated dispatch method with pumped-storage and battery-storage is as shown in Fig. 3.
4.2 Calculation-benefit analysis for the proposed coordinated dispatch method
The mathematical formulation of the optimization problem introduced in Section 3 is a large-scale, multi-dimensioned, mixed-integral, non-convex, and nonlinear constrained problem, which is hard to solve. Especially, the number of discrete variables is a major influencing factor on computational diffi-culty. Seen from Section 3, the basic model includes
large scale discrete variables, including the state of
the thermal unit, pumped-storage and
battery-storage of T time periods. Therefore, the
computa-tional burden of the basic model is heavy. So, the coordinated dispatch model divides the basic model into two sub-problems, Day-Ahead dispatch model
and Intra-Day dispatch model. Accordingly, the
discrete variables in each sub-problem will decrease, which will reduce the computational burden.
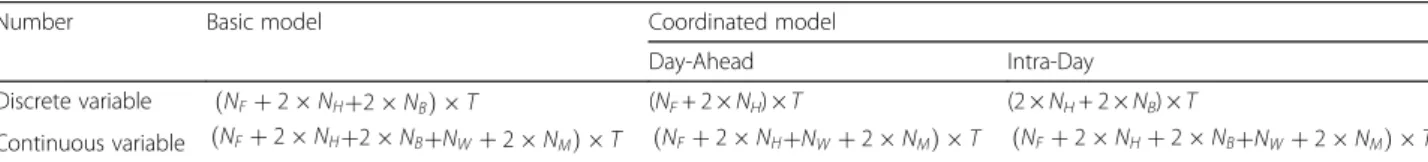
To show the advantages of the proposed coordinated dispatch model in the improvement of computational ef-ficiency, the variables of the basic and coordinated dispatch models are listed in Table 1. Then, the calculation-benefit analysis is conducted via comparing the number of variables in both models. The model that has the fewer variables will has better performances in computational efficiency.
As shown in Table 1, only part of discrete variables of the basic model are included in the sub-problems of the coordinated model. To show the calculating amount of basic and coordinated dispatch models more clearly, Table 2 compares their variables number.
As shown in Table 2, the Intra-Day model has the same continuous variables as the basic model. Hence, as for the continuous variable, the advantage of the coordinated model is not obvious. However, as for the discrete variable, the advantage of the coordinated model is obvious, especially when the number of thermal unit and battery is large. For example, sup-pose NF= 54, NH= 1, NB= 5 (NB is the number of
battery-storage), T= 96, the number of the discrete variable in the basic model, Day-Ahead model, and Intra-Day model are 6336, 5376, and 1152 respect-ively. Therefore, the computational time is greatly re-duced by using the coordinated model.
5 Numerical simulation
The coordinated dispatch of pumped-storage and battery-storage are simulated in three systems: 6-bus system, IEEE 24-bus system, and IEEE 118-bus system from MatPower 5.0 [27]. In the simulations, the thermal units output, pumped-storage output, battery-storage output as well as wind curtailment are recorded to verify the coordinated dispatch method.
For verifying the advantages of proposed method, the indexes in Table 3 are used, measuring the per-formances in stabilizing the output of thermal units, shaving the peak load, and reducing the curtailment of wind power.
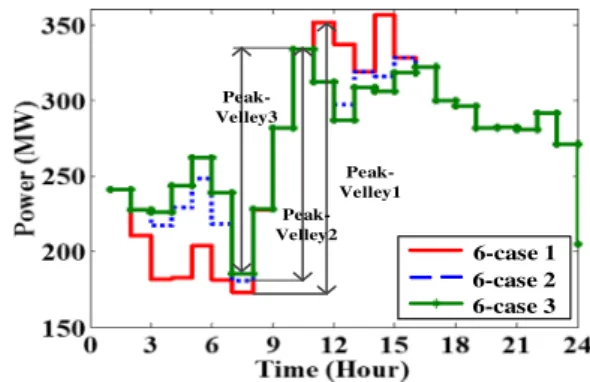
The difference between peak and valley of three cases are calculated as following. Valley 1, Peak-Valley 2, and Peak-Peak-Valley 3 represent the difference between peak and valley of case 1, case 2, and case 3 respectively.
1 Day-Ahead dispatch
2 Intra-Day dispatch
Step 1: Construct the Day-Ahead dispatchmodel. Objective function: eqs.(1)-(2).
Constraints: eqs.(3)-(22).
Step 2: Solve the Day-Ahead dispatchmodel by Cplex solver.
Step 3: Obtain the optimal plan:
1) Unit commitment and economic dispatch plan of thermal units;
2) Pumped-storage plan;
3) Wind curtailment.
Step 4: Construct the Intra-Daydispatch model. Objective function: eqs.(1)-(2). Constraints: eqs.(3)-(28).
Step 5: Solve the Intra-Daydispatch model by Cplex solver.
Step 6: Obtain the results to control the units: 1) Economic dispatch command of
thermal units;
2) Pumped-storage command;
3) Battery-storage command; 4) Wind curtailment. Unit
commitment
Plan of pumped storage
Plan of thermal units
Curtailment of wind
Peak‐Valley 1¼ max system loadf –wind power availableg –min system loadf –wind power availableg;
Peak‐Valley 2¼ maxfsystem load–wind power available
–output of pumped‐storageg–minfsystem load
–wind power available–output of pumped‐storageg;
Peak‐Valley 3¼ maxfsystem load–wind power available –output of pumped‐storage
–output of battery‐storageg
–minfsystem load–wind power available –output of pumped‐storage‐battery‐storageg:
Besides, to demonstrate the contributions of the com-bining of the pumped-storage and battery-storage, three cases below have been studied in all the three systems.
Case 1: Only the thermal units and the wind power units are dispatched without the assistance from pumped-storage units and battery-storage.
Case 2: The thermal units, the wind power units, and the pumped-storage units are dispatched. The battery-storage are not dispatched.
Case 3: The thermal units, wind power units, pumped-storage units and battery-pumped-storage units are dispatched in coordination.
The solution method is discussed in following contents. Cplex Optimizer can provides flexible, high-performance mathematical programming solvers, for linear ming, mixed integer programming, quadratic
program-ming, and quadratically constrained programming
problems with millions of constraints and variables. In this paper, the proposed model is a mixed integer nonlinear programming (MINLP) problem, which can be solved by Cplex solver, the core algorithm is branch and bound algorithm. All the experiments are imple-mented on the Matlab platform with Cplex Optimizer, at Intel Core 1.70GHz with 4GB memory.
5.1 Simulation of 6-bus system
A.Description of the simulation system.
As shown in Fig. 4, the 6-bus system includes three thermal units at bus 1, bus 2 and bus 3, one wind farm at bus 5, one pumped-storage unit at bus 4 and one battery-storage at bus 5.
F1, F2, and F3 represent thermal units, H repre-sents pumped-storage units, W reprerepre-sents the wind farm, and B presents the battery-storage. Loads are connected to the bus 4, bus 5, and bus 6. Their load proportionality factors are 0.2, 0.4, and 0.4. The pa-rameters including thermal units, pumped-storage, battery-storage, transmission lines, load, and the wind are given in [27, 28] (http://www.eirgrid.com/operations/ systemperformancedata/windgeneration/), respectively. The penalty coefficient of wind curtailment is 10 $/MWh in this example.
Three cases mentioned at the beginning of Section 5 are simulated, denoted as 6-case 1, 6-case 2, and 6-case 3 in 6 bus test system.
B. Simulation results of 6-bus system
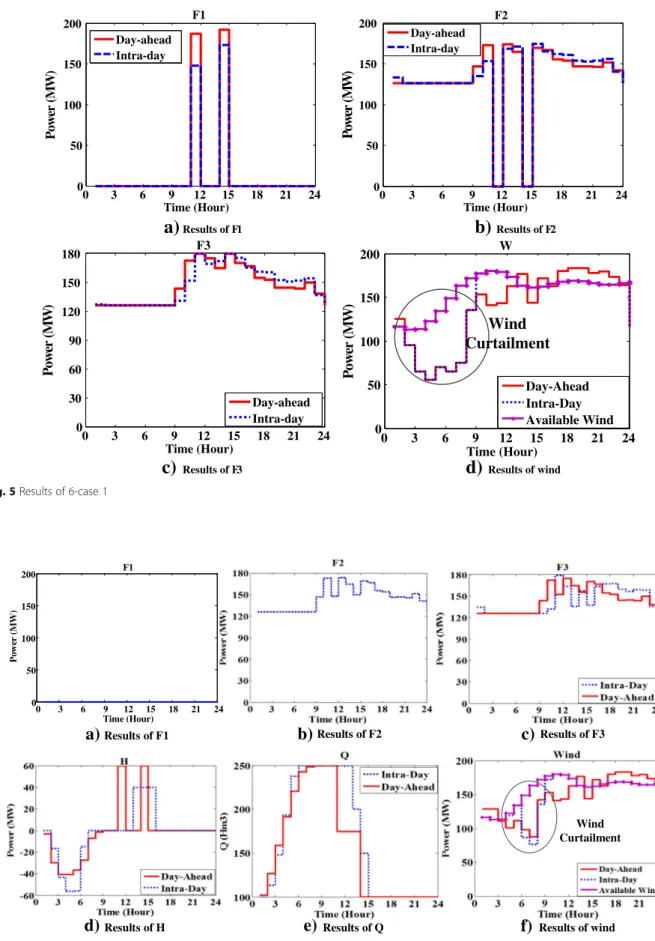
1) Results of 6-case 1
The simulation results of 6-case 1 are shown in Fig. 5a-d, including the thermal units’ output and wind curtailment in both Day-Ahead and Inter-Day dispatch. In this case, in order to balance the power at peak load time, F1 has to start instead of F2 in 11th and 14th time periods. Because the maximum output of F2 and F3 couldn’t supply the peak load, but meanwhile starting up F1, F2 and F3 will result in plenty of wind curtailment. Figure 5c indicates that the output of F3 is varied to response the load and the wind. In Fig. 5d, the wind accepted by the system is much less than the available wind. It indicates wind curtailment is large without the adjustment of stor-ages. Besides, due to the inaccurate forecasting of the wind, the Day-Ahead plan is departures from the ac-tually available wind power. Also seen from Fig. 5d, the departures are reduced by rolling correction in the Intra-Day model.
Table 2Comparison of the variable number of basic and coordinated dispatch models
Number Basic model Coordinated model
Day-Ahead Intra-Day
Discrete variable ðNFþ2NHþ2NBÞ T (NF+ 2 ×NH) ×T (2 ×NH+ 2 ×NB) ×T
Continuous variable ðNFþ2NHþ2NBþNWþ2NMÞ T ðNFþ2NHþNWþ2NMÞ T ðNFþ2NHþ2NBþNWþ2NMÞ T
Table 1The variables of the basic and coordinated dispatch models
Model Discrete variable Continuous variable
Basic dFi;t,djin;t,doutj;t ,dchk;t,ddisk;t PFi;t,P H;in j;t ,P
H;out j;t ,P
B;ch k;t ,P
B;dis k;t ,P
W;cur
w;t ,Um,t,θm,n,t Coordinated Day-Ahead dFi;t,dinj;t,doutj;t PFi;t,P
H;in j;t ,P
H;out j;t ,P
W;cur
w;t ,Um,t,θm,n,t Intra-Day dinj;t,doutj;t ,dkch;t,ddisk;t PFi;t,P
H;in j;t ,P
H;out j;t ,P
B;ch k;t ,P
B;dis k;t ,P
W;cur
2) Results of 6-case 2
The results of the 6-case 2 are shown in Fig. 6a-f. Compared with the results in Fig. 5, thermal units F1 and F2 need not start-stop with the help of pumped-storage. In addition, the Intra-Day curve of F2 is the same as the Day-Ahead curve in Fig. 6b. It means that the output of F2 needn’t change its plan during the whole day due to the adjustment of pumped-storage, which greatly relieves the operators from frequently changing the scheduling plan. Figure 6d shows the opti-mal pumping and generation plan of the pumped-storage. The pumped-storage is optimized over the en-tire time horizon, so that the pumped-storage can have enough space to store or generate power when needed. Seen from Fig. 6d, the pumped-storage absorbs power at valley periods and generates power at peak periods, which lowers the level of peak load while enhances the level of valley load. So the pumped-storage plays an im-portant role in shifting the peak load. Figure 6e is the curve of the water reserve. As we can see from Fig. 6e, the reserve reaches to its maximal level during 5th to 12th periods. The pumped-storage no longer has space to absorb the surplus wind power. Therefore, the wind power is curtailed during 5th to 12th periods in Fig. 6f. However, seen from the Fig. 6f, the wind curtailment of 6-case 2 is less than 6-case 1.
3) Results of 6-case 3
The results of the 6-case 3 are shown in Fig. 7a-g. The Intra-Day output curve of F3 is more stable than that in the Figs. 5 and 6. It indicates that the battery-storage partly share the fluctuation and ramping of
wind power, which avoids the thermal unit from fre-quently adjusting. So the efficiency of the thermal unit is enhanced. Figure 7d shows the optimal char-ging and discharchar-ging process of battery storage and its state of charge is shown in Fig. 7f. In Fig. 7f, the battery-storage reaches its top capacity to decrease wind curtailment during the 5th to 12th periods. Therefore, compared with the results in Fig. 6f, the wind curtailment is decreasing with the help from the battery -storage during the 5th to 12th periods, shown in Fig. 7g.
C. Comparative analysis.
The comparative results of the above three cases are gathered in Table 4. The Wind Curtailment of the dispatch day (W_Cur), Start-Stop times of thermal units (S_T), and the difference between Peak and Valley (PV) can be seen from Table 4.
The comparison results are analysed as follows. 1) Comparison results of the difference between peak and valley load.
Figure 8 compares the difference between peak and valley, which is undertaken by thermal units. Peak-Valley 1, Peak-Valley 2, and Peak-Valley 3 are calculated by the method referred at the beginning of Section 5.
As shown in Fig. 8, the Peak-Valley 1 is 182 MW, Peak-Valley 2 is 153 MW and Peak-Valley 3 is 148 MW. By optimally using the pumped-storage, the peak-valley is decreased by 29 MW, which is 15.9% of Peak-Valley 1. Therefore, the pressures of balancing the power between peak and valley are greatly lightened. Also, we can see the Peak-Valley 3 is not improved greatly than Peak-valley 2, which indicates that the task of shifting load is not mainly undertaken by batter-storage due to the limitation of its capacity.
2) Comparison results on the smooth output of thermal unit.
In Table 3, the start-stop times of F1 and F2 are decreased from 2 to 0 with the adjustment of storages. The outputs of the F3 are compared in Fig. 9.
Seen from Fig. 9, with the helping of storages, the curves of 6-case 2 and 6-case 3 are smoother than that of 6-case 1, especially during the 9th to 23rd periods. The differences between the maximum and minimum output of F3 are 54 MW, 53 MW, and 44 MW, respect-ively. The difference is reduced 10 MW by the fast adjustment of battery-storage, which indicates that battery-storage plays important role in compensating the ramping events.
Table 3The advantages and corresponding indexes of the optimization method
Advantages Stabilize the output of thermal units Shave the peak load Reduce the curtailment of wind power
Indexes The Start-Stop times of thermal units The difference between Peak and Valley The wind curtailment
1 2
3
6 4
5
F1 F2
F3
W B
H
0 3 6 9 12 15 18 21 24 0
50 100 150
200 W
Time (Hour)
)
W
M(
re
w
o
P
Day-Ahead Intra-Day Available Wind
a)
c)
d)
b)
Results of F1 Results of F2
Results of F3 Results of wind
0 3 6 9 12 15 18 21 24 0
50 100 150
200 F1
Time (Hour)
)
W
M(
re
w
o
P
Day-ahead Intra-day
0 3 6 9 12 15 18 21 24
0 50 100 150
200 F2
Time (Hour)
)
W
M(
re
wo
P
Day-ahead Intra-day
0 3 6 9 12 15 18 21 24 0
30 60 90 120 150
180 F3
Time (Hour)
)
W
M(
re
w
o
P
Day-ahead Intra-day
Wind
Curtailment
Fig. 5Results of 6-case 1
a)
b)
e)
d)
f)
c)
Results of F1 Results of F2 Results of F3
Results of Q Results of H
0 3 6 9 12 15 18 21 24 0
50 100 150
200 F1
Time (Hour)
re
w
o
P
(M
W
)
Results of wind Wind Curtailment
3) Comparison results of wind curtailment.
In Table 3, the wind curtailment is greatly reduced by the helping of the storages. The proportions of wind cur-tailment in the three cases are 12.1%, 6.5%, and 4.6%, re-spectively. The proportion of wind curtailment is decreased by 7.5% with the help of storages, which has a considerable economic.
5.2 Simulation of IEEE 24-bus system
In IEEE 24-bus system, there is one pumped-storage,
one battery-storage, and one wind farm. The
pumped-storage connects at bus 15, the battery and wind farm connects to the same bus 18. Also, three
cases referred at the beginning of Section 5 are simu-lated, denoted as 24-case 1, 24-case 2, and 24-case 3 in this section.
For brevity, only the results of difference between peak and valley load, wind curtailment are analysed here.
a)
Results of F1b) c)
Results of F2 Results of F3Results of Q
d)
Results of H and Be) f)
Results of Eg)
Results of WFig. 7Results of 6-case 3
Table 4Comparison results of the three cases of 6-bus system
W_Cur(MW) S_T P_V(MW)
6-case 1 458 2:2:0 182
6-case 2 246 0:0:0 153
6-case 3 174 0:0:0 148
Peak-Velley1 Peak-Velley2 Peak-Velley3
6-case 1 6-case 2 6-case 3
1) Comparison results of the difference between peak and valley load.
Figure 10 compares the difference between peak and valley.
In Fig. 10, the Peak-Valley 1 is 1422 MW, Peak-Valley 2 is 1249 MW and Peak-Valley 3 is 1208 MW. Compared to Peak-Valley 1, Peak-Valley 2 has decreased 173 MW, which is over 12% of Peak-Valley 1. And compared to Peak-Valley 2, Peak-Valley 3 has decreased 41 MW, which is 3% of Peak-Valley 2. Therefore, the pressures of balan-cing the power between peak and valley are greatly light-ened by optimally using the pumped-storage.
2) Comparison results of wind curtailment.
Figure 11 compares the wind curtailment of the three cases.
As shown in Fig. 11, in 24-case 1, wind curtailment occurs in many time periods. However, in 24-case 2 and 24-case 3, wind curtailment only occurs in the 3rd time period. The total wind curtailment of 24-case 1, 24-case 2, and 24-case 3 is 571 MW, 53 MW and 12 MW, respectively. Therefore, wind curtailment can be greatly reduced by using the pumped-storage and further reduced by using battery-storage.
5.3 Simulation of IEEE 118-bus system
In IEEE 118-bus system, there is one pumped-storage, one battery-storage, and one wind farm. The pumped-storage and wind farm connects to the same bus 54, the battery connects to bus 30. Also, three cases mentioned at the beginning of Section 5 are simulated, denoted as 118-case 1, 118-case 2, and 118-case 3 in this 118 bus test system.
For brevity, only the results of difference between peak and valley load and wind curtailment are ana-lysed here.
1) Comparison results of the difference between peak and valley load.
Figure 12 compares the difference between peak and valley of IEEE 118-bus system. In Fig. 12, the Peak-Valley 1, Peak-Peak-Valley 2 and Peak-Peak-Valley 3 are 4228 MW, 4184 MW, and 4128 MW, respectively. Therefore, the pressures of balancing the power between peak and val-ley are lightened by optimally using the pumped-storage and battery-storage.
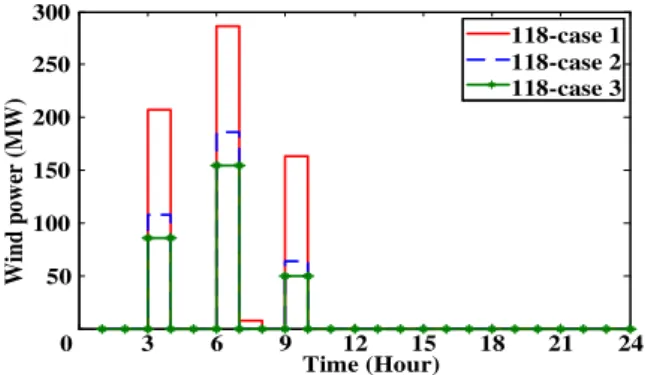
2) Comparison results of wind curtailment.
Figure 13 depicts the wind curtailment of the three cases. In Fig. 13, the maximum of wind curtailment in
0 3 6 9 12 15 18 21 24
120 130 140 150 160 170 180
Time (Hour)
re
w
o
P(
M
W
)
F3 of 6-case 1 F3 of 6-case 2 F3 of 6-case 3
Fig. 9Comparisons of the output of F3
0 3 6 9 12 15 18 21 24
1800 2200 2600 3000 3400
Time (Hour)
re
wo
P(
W
M)
24-case 1 24-case 2 24-case 3
Peak-Velley3
Peak-Velley2 Peak-Velley1
Fig. 10Comparisons of difference of peak to valley of IEEE 24-bus system
0 3 6 9 12 15 18 21 24
50 100 150 200
Time (Hour)
re
w
o
p
d
ni
W(
MW
)
24-case 1 24-case 2 24-case 3
Fig. 11Comparisons of the wind curtailment of IEEE 24-bus system
0 3 6 9 12 15 18 21 24
5000 6500 8000 9500
Time (Hour)
re
wo
P(
M
W
)
118-case 1 118-case 2 118-case 3
Peak-Velley3
Peak-Velley2 Peak-Velley1
118-case 1 reach 286 MW, which is nearly double of wind curtailment in 118-case 3 in the 6th time period. The together wind curtailment in three cases are 664 MW, 358 MW and 290 MW, respectively. There-fore, pumped-storage and battery-storage in 118-case 2 and 118-case 3 can reduce the wind curtailment and save energy.
6 Conclusion
In this paper, a detailed mathematical formulation co-ordinating the pumped-storage and battery-storage problem is proposed to accommodate the reverse peak regulation and variability characters of the wind power. The proposed method can be extended to any combin-ation of high-capacity and fast-response energy storages. Based on the characters of pumped-storage and battery-storage, a practical framework for the optimal operation of Day-Ahead plan and Intra-Day scheduling is designed. Three cases have been used to study the advantages of the coordination of pumped-storage and battery-storage in three test systems. The simulation results demon-strate that the coordination method has good perform-ance in the aspects of shifting peak load, responding to the wind power ramping, reducing the curtailment of wind and steadying the output of thermal units.
Further, there are still some works that need to de-velop in the future research.
1) Further, improve the computational efficiency of the coordinated dispatch model. The coordinated dispatch is a large-scale, multi-dimensioned, discrete, non-convex, and nonlinear constrained problem, which requires faster and more accurate method to solve.
2) Add AGC (Automatic Generation Control) control part into the coordinated dispatch. The proposed method only includes Day-Ahead and Intra-Day dispatch, while not including the real-time dispatch. Adding AGC control part will form a more complete
dispatch system, including Day-ahead, Intra-Day, and real-time dispatch.
3) Consider the influence of different kinds of battery -storage in the coordinated dispatch model, especially the parameters of capacity and response time.
Acknowledgements
This work was supported in part by the National Key Research and Development Program of China (2016YFB0900101) and in part by the National Natural Science Foundation of China (51377027).
Authors’contributions
JL conceived and designed the study. JL and SW performed the
experiments. JL, SW and LY wrote the paper. JL, SW, LY and JF reviewed and edited the manuscript. All authors read and approved the manuscript.
Competing interests
The authors declare that they have no competing interests.
Received: 16 April 2017 Accepted: 4 December 2017
References
1. David, L. (2010). The energy storage problem.Nature, 463(7), 18–20. 2. Li, R., Chen, L., Yuan, T., et al. (2016). Optimal dispatch of
zero-carbon-emission micro energy internet integrated with non-supplementary fired compressed air energy storage system.Journal of Modern Power Systems & Clean Energy, 4(4), 566–580.
3. Mohammadi, S., Mozafari, B., Solymani, S., et al. (2014). Stochastic scenario-based model and investigating size of energy storages for PEM-fuel cell unit commitment of micro-grid considering profitable strategies.IET Generation Transmission and Distribution, 8(7), 1228–1243.
4. Zhang, N., Kang, C. Q., Kirschen, D. S., et al. (2013). Planning pumped storage capacity for wind power integration.IEEE Transactions on Sustainable Energy, 4(2), 393–401.
5. Van MEERWIJK, A. J. H., BENDERS, R. M. J., DAVILA-MARTINEZ, A., et al. (2016). Swiss pumped hydro storage potential for Germany’s electricity system under high penetration of intermittent renewable energy.Journal of Modern Power Systems & Clean Energy, 4(4), 542–553.
6. Hozouri, M. A., Abbaspour, A., Fotuhi-Firuzabad, M., et al. (2015). On the use of pumped storage for wind energy maximization in transmission-constrained power systems.IEEE Transactions on Power Systems, 30(2), 1017–1025.
7. Wu, C. C., Lee, W. J., & Cheng, C. L. (2008). Role and value of pumped storage units in an ancillary services market for isolated power systems—Simulation in the Taiwan power system.IEEE Transactions on Industry Applications, 44(6), 1924–1929.
8. Caralis, G., & Zervos, A. (2007). Analysis of the combined use of wind and pumped storage systems in autonomous Greek Islands.IET Renewable Power Generation, 1(1), 49–60.
9. Papaefthymiou, S. V., Karamanou, E. G., Papathanassiou, S. A., et al. (2010). A wind-hydro-pumped storage station leading to high RES penetration in the autonomous island system of Ikaria.IEEE Transactions on Sustainable Energy, 1(3), 163–172.
10. Papaefthimiou, S., Karamanou, E., Papathanassiou, S., et al. (2009). Operating policies for wind-pumped storage hybrid power stations in island grids.IET Renewable Power Generation, 3(3), 293–307.
11. Khodayar, M. E., Abreu, L., & Shahidehpour, M. (2013). Transmission-constrained intrahour coordination of wind and pumped-storage hydro units.IET Generation Transmission and Distribution, 7(7), 755–765. 12. Wang, Y., Zhou, Z., Botterud, A., et al. (2016). Stochastic coordinated
operation of wind and battery energy storage system considering battery degradation.Journal of Modern Power Systems & Clean Energy, 4(4), 581–592. 13. Li, X. J., Yao, L. Z., & Hui, D. (2016). Optimal control and management of a
large-scale battery energy storage system to mitigate fluctuation and intermittence of renewable generations.Journal of Modern Power Systems & Clean Energy, 4(4), 593–603.
3 6 9 12 15 18 21 24
0 50 100 150 200 250 300
Time (Hour)
re
w
o
p
d
ni
W
(MW
)
118-case 1 118-case 2 118-case 3
14. Papič, I. (2006). Simulation model for discharging a lead-acid battery energy storage system for load leveling.IEEE Transactions on Energy Conversion, 21(2), 608–615.
15. Pascal, M., & Rachid, C. (2009). Optimizing a battery energy storage system for frequency control application in an isolated power system.IEEE Transactions on Power Systems, 24(3), 1469–1477.
16. Li, J. H., Wen, J. Y., Cheng, S. J., et al. (2014). Minimum energy storage for power system with high wind power penetration using p-efficient point theory.Science China Information Sciences, 57, 128202:1–128202:12. 17. Maly, D. K., & Kwan, K. S. (1995). Optimal battery energy storage system
(BESS) charges scheduling with dynamic programming.IEE Proceedings: Science, Measurement & Technology, 142(6), 453–458.
18. Li, X. (2012). Fuzzy adaptive Kalman filter for wind power output smoothing with battery energy storage system.IET Renewable Power Generation, 6(5), 340–347.
19. Chazarraa, M., Pérez-Díaza, J. I., García-González, J., et al. (2016). Modeling the real-time use of reserves in the joint energy and reserve hourly scheduling of a pumped storage plant.Energy Procedia, 87, 53–60. 20. Kusakana, K. (2016). Optimal scheduling for distributed hybrid system with
pumped hydro storage.IET Renewable Power Generation, 111, 253–260. 21. Kusakana, K. (2015). Optimal scheduled power flow for distributed
photovoltaic/wind/diesel generators with battery storage system.Renew Energy, 9(8), 916–924.
22. Duggal, I., & Venkatesh, B. (2015). Short-term scheduling of thermal generators and battery storage with depth of discharge-based dost model. IEEE Transactions on Power Systems, 30(4), 2110–2118.
23. Kumano J, Yokoyama A (2014) Optimal weekly operation scheduling on pumped storage hydro power plant and storage battery considering reserve margin with a warge penetration of renewable energy. Paper presented at 2014 international conference on power system technology, Chengdu, 20–22 October 2014.
24. Liang, R. H. (2000). A noise annealing neural network for hydroelectric generation scheduling with pumped-storage units.IEEE Transactions on Power Systems, 5(3), 1008–1013.
25. Tsoi, E., & Wong, K. P. (1997). Artificial intelligence algorithms for short term scheduling of thermal generators and pumped-storage.IET Generation Transmission and Distribution, 144(2), 193–200.
26. Li, J. H., Fang, J. K., Wen, J. Y., et al. (2015). Optimal trade-off between regulation and wind curtailment in the economic dispatch problem.CSEE Journal of Power and Energy Systems, 1(4), 52–60.