Original Research Article
Study of morbidity pattern of children up to age of five years with
special reference to osseous development
Pradyut Kumar Mandal
1, SK. Rafikul Rahaman
1*, Mrinal Kanti Karmakar
2,
Kripasindhu Chatterjee
3, Sanjay Kothari
4, Rafique Ahmed
5INTRODUCTION
Morbidity literally meaning illness and mortality is the end point in the natural history of a disease. The morbidity and mortality pattern in the different age groups were studies by different authors in different
aspects like nutritional status, social customs, in disease pattern, dietetic habits, cultural habits, heart, renal, collagen diseases, malignancies, and in normal children. There was a paucity of data regarding physical growth, skeletal growth in relation to morbidity pattern in a longitudinal study. Thus, the study varies from one place
ABSTRACT
Background: The first few years of life are the most crucial period as this age is known for accelerated growth and development and any adverse influences during this period may result in severe limitations in their development which warrants regular monitoring.
Methods: The present study had been conducted to find out the total growth profile in relation to skeletal age, nutritional status and the disease pattern so as to give a clear idea of total growth profile in the age group of 3 months to 5 years. The cases were evaluated after proper history taking, clinical examination and conventional anthropometric measurements. The patients were divided in three different age groups as 3 months to 1 year, ≥1 to 3 years, and ≥3 to 5 years. Bone age was determined in all 52 cases by taking proper radiographs of both wrists and hands.
Results: It was observed that 16 (30.77%) were normal, 11 (21.15%) were in both grade I and II, 10 (19.23%), 4 (7.7) were grade III and IV respectively among 52 children. The mean weight was 7.06±1.65, 9.33±1.92 and 11.18±2.90 in the age groups of 3 months to 1 year, 1-3 years and 3-5 years respectively. The length/heights were 68.55±5.54, 79.44±7.54 and 91.97±10.15 in the age group of 3 months to 1 year, 1-3 years and 3-5 years respectively.
Conclusions: This study gave a true reflection of total growth of a child which comprised of anthropometrical measurement and skeletal development as the distribution of sex and racial distribution were not a factor. There was a statistical significant result in different three groups in regard to weight, length/height, head and chest circumference.
Keywords: Morbidity, Mortality pattern, Nutritional status, Osseous development, Respiratory tract infection, Under five children
1Department ofPediatrics, ICARE Institute of Medical Sciences and Research, Haldia, West Bengal, India 2Department ofAnatomy, ICARE Institute of Medical Sciences and Research, Haldia, West Bengal, India
3Department ofPediatrics, Gouri Devi Institute of Medical Sciences and Hospital, Durgapur, West Bengal, India
4Department ofRadiodiagnosis, ICARE Institute of Medical Sciences and Research, Haldia, West Bengal, India 5Department ofPediatrics, Calcutta National Medical College and Hospital, 32 Gorachand Road, Beniapukur, Kolkata, West Bengal, India
Received: 01 January 2018
Accepted: 30 January 2018
*Correspondence:
Dr. SK. Rafikul Rahaman,
E-mail: [email protected]
Copyright: © the author(s), publisher and licensee Medip Academy. This is an open-access article distributed under the terms of the Creative Commons Attribution Non-Commercial License, which permits unrestricted non-commercial use, distribution, and reproduction in any medium, provided the original work is properly cited.
to other. The morbidity pattern was shown by Prasad Rao and Puri, Udani, Gulati, Chaudhury et al, Manchanda and Sachdev.1-5 All these studies were based on either outpatient department attendance or hospital admission. Mehta et al, Dhamija, Puri and Khanna had done an extensive study on the skeletal changes in relation with the incidence of illness with skeletal development.6-8 Jelliffe had clearly demonstrated in his well renowned equation that the community nutritional level depends on educational status, economic status, availability of food, aspects of health, immunization status and population size.9 The present study had been conducted to find out the total growth profile in relation to skeletal age, nutritional status and the disease pattern so as to give a clear idea of total growth profile in the age group of 3 months to 5 years. This particular age period has been considered for this study as the maximum development in all respects is taken place within this period. Moreover, the different aspects like socioeconomic factor, nutritional aspects, and recurrent diseases may influence the growth profile with special emphasis on osseous growth. With all considerations the present extensive study had been contemplated in our health status to bring out a new light in horizon of medical field.
METHODS
The present study was based on 52 cases of children in the age group of 3 months to 5 years admitted to the Department of Paediatrics in a tertiary care teaching hospital, Kolkata, West Bengal suffering from any illness. Institutional Ethics Committee approval and informed written consent and assent (where applicable) before enrolment of study participants. The cases were evaluated after proper history taking, clinical examination and conventional anthropometric measurements. Routine investigations were done for confirmation of diagnosis. The patients were divided in three different age groups as 3 months to 1 year, ≥1 to 3 years, and ≥3 to 5 years. Bone age was determined in all 52 cases by taking proper radiographs of both wrists and hands. Then it was compared with standard chart given by Vogt EC and Vickers VS in percentile distribution.10 About 50 percentiles was considered as normal.
Anthropometric measurements
Weight detectolever type was used for the infants’ upto 10 kg. Detecto platform type used for children who could stand. Nude weight was recorded in each case. The gradation of protein caloric malnutrition was based on the body weight according to convention of nutritional subcommittee of IAP. They suggested that 50 percentile of Harvard growth charts should be adapted as reference standards for comparison. The gradations are as shown in Table 1.
Recumbent length (crown to heel) was recorded for babies’ upto 2 years by infantometer. Height was measured in children over 2 years of age against a firm
iron measuring stand. The subject was advised to take deep breath and make himself/herself as tall as possible without raising the heels. Then the anthropometric bean was brought down firmly on the vertex to compress the hair and the height was recorded from the scale in CMs. Head circumference was measured in CMs with a steel tape around the head passing over the supracilliary ridges in front and occipital protuberance behind in such a way as to get the maximum circumference. Chest circumference was made in mid respiration at the level of xiphoid cartilage in cm. Mid arm circumference on left arm at the midpoint of arm and measured in cm.
Table 1: Gradations.
Grade Weight expressed as percentage
of reference standards
I 71-80%
II 61-70% III 51-60% IV < 50%
RESULTS
It was clear from the table as the age advancing the number of cases were increasing. There is slight preponderance of females in the age group (3-5 years) was 23.08% (Table 2).
Table 2: Total number of cases with distribution of age and sex (n = 52).
Group Age No. of
cases %
Males (no.%)
Females (no. %) I 3 months
to 1 year 13 (25%)
7 (13.46%)
6 (11.54%) II 1-3 years 17
(32.96%) 8 (15.38%)
9 (17.31%) III 3-5 years 22
(42.31%) 10 (48.07%)
27 (51.93%)
The ratio of M: F was 1:1. It is clear that the distribution of sex was nearly equal. It was noted that total number of cases in grade I socioeconomic status was nil but in grade II, III, IV and V the number of cases were 2 (3.85%), 14 (26.92%), 28 (53.85%) and 8 (15.38%) respectively. So, it was clearly found that majority of cases 28 (53.85%) belonged to Grade-IV socioeconomic status.
Table 3 had given the reflection of the nutritional status of 52 cases. It was observed that 16 (30.77%) were normal, 11 (21.15%) were in both grade I and II, 10 (19.23%), 4 (7.7) were grade III and IV respectively. But it was interestingly noted that in the majority of cases 16 (30.77%) the nutritional status was normal.
length/heights were 68.55±5.54, 79.44±7.54 and 91.97±10.15 in the age group of 3 months to 1 year, 1-3 yrs and 3-5 yrs respectively. The mid-arm circumference was 12.23±1.32, 12.84±1.07, and 12.85±1.7 in the age
groups of 3 months to 1 year, 1-3 yrs and 3-5 years respectively. It was not statistically significant in any group (Table 5).
Table 3: Distribution of cases in relation to nutritional status.
Age Grade Normal I II III IV
3 months to 1 year No. of cases 6 2 4 2 0
1-3 years - 5 5 4 2 1
3-5 years - 5 4 3 7 3
Total 52 (100%) 16 (30.77%) 11 (21.15%) 11 (21.15%) 10 (19.23%) 4 (7.7%)
Table 4: Comparative study of weight in relation to length/height.
Age Mean weight (Kg) SD P value Length/height SD P value
3 months to 1 year 7.06 1.65 <0.01 68.55 5.54 <0.001 1-3 years 9.33 1.92 <0.05 79.44 7.54 <0.01 3-5 years 11.18 2.90 <0.001 91.97 10.15 <0.001
Table 5: Comparative study of weight in relation to mid-arm circumference.
Age Mean weight (Kg) SD Mean mid arm (Lt) circumference (CMs) SD P value
3 months to 1 year 7.06 1.65 12.23 1.32 >0.05 1-3 years 9.33 1.92 12.84 1.07 >0.05 3-5 years 11.18 2.90 12.85 1.47 >0.05
Table 6: Comparative study of weight in relation to head circumference.
Age Mean weight (Kg) SD Mean Head circumference (in CMs) SD P value
3 months to 1 year 7.06 1.65 42.9 2.79 <0.05
1-3 years 9.33 1.92 44.9 2.36 <0.01
3-5 years 11.18 2.90 47.28 2.14 <0.01
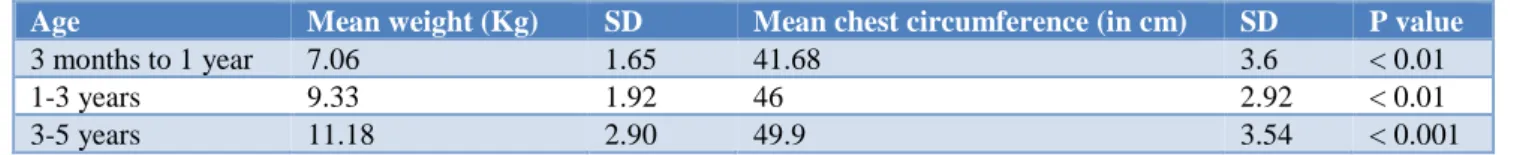
Table 7: Comparative study of weight in relation to chest circumference.
Age Mean weight (Kg) SD Mean chest circumference (in cm) SD P value
3 months to 1 year 7.06 1.65 41.68 3.6 < 0.01
1-3 years 9.33 1.92 46 2.92 < 0.01
3-5 years 11.18 2.90 49.9 3.54 < 0.001
Table 8: Weight, carpal centres and number of illness per year.
Age No. of
cases
Mean weight (Kg)
SD Carpal centres in
percentile
Total no. of illness per year
Average no. of illness/year
3 months to 1
year 13 7.06 1.65
50th - 10 cases (76.92%)
10th - 50th - 3 cases (23.08%)
158 12.15
1-3 years 17 9.33 1.92
50th - 11 cases (64.7%) 10th - 50th - 6 cases (35.3%)
265.5 15.61
3-5 years 22 11.18 2.9
50th - 6 cases (27.27%) 10th - 50th - 16 cases (72.72%)
The mean head circumference was 42.9±2.79, 44.9±2.36, and 47.28±2.14 in the age groups of 3 months to 1 year, 1-3 years and 3-5 years respectively. The vales were statistically significant in each group (Table 6).
Table 8 depicted the number of cases in normal skeletal age (50th percentile) in the age group of 3 months to 1 year, 1-3 years and 3-5 years were 10 (76.92%) out of 13 cases, 11 (64.7%) out of 17 cases and 6 (27.27%) out of 22 cases respectively. Similarly, number of cases of 10-50th percentile skeletal age were 3 (23.08%), 6 (35.3%) and 16 (72.72%) respectively. About the total number of illness per year were 158 (average 12.15), 265.5 (average 15.61) and 378 (average 17.18) in the age group of 3 months to 1 year, 1-3 years, and 3-5 years respectively. So, it was noted that as age advancing the number of illness were increasing but interesting point was noted that skeletal age was advancing.
Table 9: Total number of RTI, URTI and LRTI per year among study participants.
Age
Total no. of RTI/ year
Total no. of URTI/ year
Total no. of LRTI/ year
Average no. of RTI/ year 3 months
to 1 year 69
62 (89.85%)
7 (10.15%)
5.30 (43.62%) 1-3
years 150
143 (95.3%)
7 (4.7%)
8.82 (56.5%) 3-5
years 235
233 (99.15%)
2 (0.85%)
10.7 (62.28%)
RTI: Respiratory tract infection; URTI: Upper respiratory tract infection; LRTI: Lower respiratory tract infection; It was clearly understood that as age advancing the average number of RTI per year was increasing
It was noted that there was no epiphyseal centre in 10 cases (76.92%) in the age group of 3 months to 1 year. It didn’t give any implication of retardation of growth as epiphyseal centre may not be normally appeared by this age group (Table 10). There was no great difference between epiphyseal centre of radius and advancing age.
Table 10: Comparative study of weight in relation to epiphyseal centre of radius.
Age Mean
weight (Kg) SD
Epiphyseal centre of radius 3 months
to 1 year 7.06 1.65
Not appeared:10 cases (76.9%) 50th - 3 cases (23.1%)
1-3
years 9.326 1.92
50th percentile: 12 cases (70.58%) 10th - 50th percentile: 5 cases (29.42%)
3-5
years 11.18 2.90
50th percentile -16 cases (72.73%) 10th - 50th percentile: 6 cases (27.27%)
DISCUSSION
Total 52 cases were studied within the age groups of 3 months to 5 years in a tertiary care teaching hospital. Preponderance of slight female in the age group of 1-3 years was comparable to ICMR study.8 All the cases belonged to grade II to V socio-economic status according to Prasad criteria. Among these patients’ majority (53.85%) of cases were in grade IV economic status. This gave a clear idea that our hospital being public health care facility is mainly based on lower socioeconomic status with high prevalence of diseases. Manchanda and Sachdev, Udani PM, Singh et al, Prasad Rao and Puri had documented high incidence of diseases in the poor socio-economic status. This was quite agreeable with the present study.5,2,11,1
The extreme of malnutrition noted in 7.7% of cases and all of them belonged to marasmus, kwashiorkor or marasmic kwashiorkor. This observation was more compatible with Udani PM but quite different from Sachdev M, where the incidence of malnutrition varied from 18 to 45%.2,5
Naturally the weight was slight less than respected weight among study participants. This observation was due to fact that 27% of the cases in the present study belong to grade III and grade IV malnutrition. There was a significant retardation of nutrition regarding to weight. Agarwal KN et al and Agarwal DK et al had documented that there was retardation of linear growth and weight in Indian children in all socio-economical status in comparison to developed countries.12,13
Retardation of length/height had been observed by Banik D et al, Prasad et al, Dhamja et al, and Banik Dhad observed the growth profile in age group of 1-5 years was up to 50th percentile in upper socioeconomic status.14,15,7,16 Similar observation noted from Pune, Jabalpur by Limye C et al, Shinde R et al respectively.17,18 As the present study conducted in low socioeconomic status and which was quite compatible with study of Banik D et al, Dhamja et al, and Prasad et al.16,7,1 Thus the present study was quite different from high socioeconomic status.
The mean mid arm circumference (MAC) in the group I was 12.23±1.32. According to Wolanski standard 12 cm is the 75th percentile at the age of 1 year. So, the observed value 75th percentile was absolutely normal. In the group II the observed MAC was 12.84±1.07. At the age of 3 years according to Wolanski standard MAC 12.5 cm is 75th percentile. So, this observed value also normal. Detailed analysis of data by determining ‘p’ values which were more than 0.05 and not statistically significant. Thus, the recurrent attacks of illness may affect the weight but did not affect the mid arm circumference.
year according to ICMR study.19 Thus there was mild degree of retardation in head circumference at the age of 1 year. Thus, head circumference was slightly affected in compare to weight, length/height. The head circumference profile was less retarded as age advancing it was due to the fact that the normal growth of head circumference was much less as the age advancing as compared to other parameters. Ghai and Sandhu had conducted a study on physical growth of Indian children in Delhi.20 They found head circumference was between 3rd to 10th percentiles of NCHS. Banik D et al, Prasad et al, Mathur et al, Dhamja et al had observed head circumference in low socio-economic status was less than 3rd percentile.16,1,21,7 Their observations were quite compatible with the present study. Hamill et al had reported accelerated head circumference in upper socio-economic status.22
The ICMR observations on chest circumference value of 4 years 47.4±3.17, at the age of 5 years 50.1±3.78. This observation was quite agreeable with our previous observation. Katiyar et al, Banik D et al had observed that there was retardation of chest circumference only by 6 months.23,16 The observation of these authors quite supported the present study.
Total illness mainly indicated by the diarrhoea and RTI in the paediatric age group who were attending the hospital. The total number of diarrhoea on an average 10-15 episode in the first five years of life of these 3-5 occurred in the first one year of life. In the present study the average number of illness 12-15 below the age of 1 year and this study was quite compatible with the above study.
In Group I 76.92% of cases there were 50th percentile development noted according to Vogt and Vickers Chart.10 The 50th percentile capitates and hamate would be present and in 90th percentile triquitral and lower epiphysis of radius were to be present. The Mehta had documented that hamate and capitate would be present in 100% cases and lower end of radius and triquetral in 50% and 60% cases respectively. Thus, in the present study the ossification centres were slightly delayed in comparison to Mehta et al.6
In the present study the average number of RTI below the age of 1 year was 5.30 and in the age group of 1-3 years the number of RTI was 8.82 and 10.7% per year in the age group of 3-5 years. According to Banik D et al study of 7493 children had documented that number of episodes of acute respiratory tract infection per year below the age of 1 year was 5-6.16 So the present study is quite compatible with the study of Banik D et al.16 In the present study high incidence of upper respiratory tract illness could be due to the fact of environmental pollution in the city of Kolkata and surroundings.
It was found in the present study that in 3 cases (23.1%) in Group I epiphyses of radius centres were noted, whereas in the study of Puri and Khanna total 120
children had noted such findings in 40% of cases.8 Such delayed appearance of centres in the present study could be due to the fact of number of illness more than in the present study. In group II 50th percentile was noted in 12 cases (70.58%) in the rest of the cases was 10th to 50th percentile. Puri and Khanna in their study noted osseous development in 60-80% of cases.8 Thus the present study there was only lacking by 10% of cases.
Skeletal growth was affected by various physiological and pathological factors of which nutrition and illness were the prime importance. Numerous studies had been done i.e. Dhamija et al, Puri and Khanna, Mehta et al but none was done the correlation with the illness.7,8,6 In the present study the Group I had no development of ossification cantre in 1st metacarpals.
Mehta et al had not documented a single case where ossification centres in 1st metacarpal bone. In the present study 7.7% cases had found ossification centres in second metacarpals. Mehta et al reported ossification centre in 40% of cases.6 Such discrepancy of study only could be explained that in present study the child had suffered from recurrent illness.24 About 7.7% cases centre was noted in 3rd and 4th metacarpals and none was in the 5th bone. Mehta et al in his extensive study had not reported any centre in 3rd, 4th and 5th bone.6
In 5th metacarpal, 7 cases (41.18%) were 50th percentile and 10th-50th was noted in 10 cases (58.82%). But the ossification centre was found in 60% of cases. But in Mehta study it was 50%.6 Thus in the present study the 5th metacarpal was more accelerated than Mehta study.6 In the present study X-ray plates were re-evaluated regarding the ossification centre, it was found in 60% of cases. Thus, there was slight lack in development in the present study.
About 50th percentile development noted in 63.64% to 68.18% in II, III, IV and V metacarpals. In the rest of the cases development was 10th-50th percentile. When the ossification centres were counted it was found in 80% of cases. This discrepancy of 20% between the observed value and Mehta study could be explained that there was slight delay in skeletal growth. In present study the development of physical growth in other parameters also delayed which could be due to the occurrence of high incidence of diseases.6
CONCLUSION
This study gave a true reflection of total growth of a child which comprised of anthropometrical measurement and skeletal development as the distribution of sex and racial distribution were not a factor.
There was delay in osseous development in all bones in wrist joints and metacarpal bones. There was clear picture that the number of illness was more as age was advancing. The present study showed a marked delay in the physical growth when compared with the observation made by other authors and this was possibly due to the fact that the number of illness suffered by the children in this study was much higher. The bony development though delayed was not as remarkable as other parameters.
Thus, could be concluded that as the number of illness were more with advancing age, there was associated delay in physical growth specially weight, length/height, head and chest circumference, but less remarkable changes were noted in mid-arm circumference and bony growth. Thus, acute short duration illness may affect the bony growth but comparatively less than the physical growth.
Funding: No funding sources Conflict of interest: None declared
Ethical approval: The study was approved by the Institutional Ethics Committee
REFERENCES
1. Rao PDCV, Puri RK. Morbidity pattern seen in the urban paediatric centre Pondicherry. Indian J Pediatr. 1973;40(310):396-402.
2. Udani PM. Morbidity and mortality. Indian J Child Health. 1962;11:239.
3. Gulati PV. An epidemiological study of morbidity pattern. Indian Pediatr. 1977;14(2):93-7.
4. Chaudhuri A, Chaudhuri KC. Studies on the morbidity pattern of children in an urban community. Indian J Pediat. 1962;29:145.
5. Manchanda SS, Sachdev KK. Morbidity and mortality in children in North India. IBID. 1962;11:680.
6. Mehta SM, Parekh P, Khan MA, Singh SD, Rawat M, Mathur PS. A study of radiological changes in protein calorie malnutrition. Indian Pediatr. 1980;17(3):241-5.
7. Dhamija SC, Agarwal KN, Gupta SK, Katiyar GP. Evaluation of hand and foot ossification centres for assessment of bone age. Indian Pediatr. 1976;13(3):201-8.
8. Puri RK, Khanna KK. Skeletal changes in protein calorie malnutrition. Indian Pediatr. 1976;13(11):833-6.
9. Jelliffe DB. Diseases of children in the subtropics and tropics. Hodder and Stoughton Educational. 3rd Edition. 1978.
10. Vogt EC, Vickers VS. Osseous growth and development. Radiol. 1938;31(4):441-4.
11. Singh RN, Hemrajani KH, Jindal PL, Kochar S. Morbidity and mortality in paediatric age group in Western Rajasthan. Arch Child Heath. 1971;13:101.
12. Agarwal KN, Agarwal OK, Benakappa DG, Gupta SM, Khanduja PC, Khatua SP, et al. Growth Performance of affluent children (Under-fives): Growth standard for Indian children, Scientific Report-11, Nutrition Foundation of India. 1991. 13. Agarwal DK, Upadhyay SK, Tripathi AM, Agarwal
KN. Nutritional status, physical work capacity and mental function in school children. Scientific Report No. 6. New Delhi: Nutrition Foundation of India; 1987.
14. Datta B, Krishnan ND, Mane RSIS, Rajlila. Longitudinal study on morbidity and mortality pattern of children in Delhi during the 1st two years of life. Review of 1000 children. Indian J Med Res. 1967;55:504.
15. Prasad R, Kumar R, Dayal RS. Physical growth and development from one to five years. Indian Pediatr 1971;8:1015-119.
16. Banik DND. Semi-longitudinal growth evaluation of children from birth to 14 years in different socio-economic groups. Indian Pediatr. 1982;19:353-9. 17. Limaye C, Chauhan CN, Lakhani SM, Phadke MV.
Optimal growth standard from Poona. Indian Pediatr. 1974;11:673-6.
18. Shinde R, Parekh PG, Kaul KK. A study of some selected anthropometric parameter in upper class pre-school children of Jabalpur. Indian Pediatr. 1980;17:45-53.
19. Growth and physical development of Indian infants and children. Technical Report 18 ICMR publication, New Delhi; 1984:59.
20. Ghai OP, Sandhu KK. Study of physical growth of Indian children in Delhi. Indian J Pediatr. 1986;35:91.
21. Mathur YC, Bhakthavatsala K, Prahalad RN. Study of growth pattern in preschool children of low socioeconomic status in a rural area near Hyderabad. Indian Pediatr. 1972;9:411-4.
22. Hamill PVV, Jhonson CL, Roche AF. Physical growth: National centre for health statistics percentiles. Am J Clin Nutr. 1979;32:607-29. 23. Katiyar GP, Sehgal D, Khare BB, Agarwal DK,
Tripathi AM, Agarwal KN. Physical growth characteristics of upper socio-economic adolescent boys of Varanasi. Indian Pediatr. 1985;22:915-22. 24. ICMR. Growth and physical development of Indian
infants and children, Indian Council of Medical Research Technical Report Series No. 18, New Delhi: ICMR; 1972.
Cite this article as: Mandal PK, Rahaman RSK, Karmakar MK, Chatterjee K, Kothari S, Ahmed R. Study of morbidity pattern of children up to age of five years with special reference to osseous