© 2020 Universidad Nacional Autónoma de México, Centro de Ciencias de la Atmósfera. This is an open access article under the CC BY-NC License (http://creativecommons.org/licenses/by-nc/4.0/).
Implications of 1.5 and 2.0 ºC additional warming for wheat
yield using a gridded modeling approach
Muhammad FAHAD1, Ishfaq AHMAD2* and H. ATHAR2,3
1Department of Agronomy, PMAS-Arid Agriculture University, Rawalpindi, Pakistan.
2Centre for Climate Research and Development, COMSATS University, Islamabad, Pakistan.
3Department of Meteorology, COMSATS University, Islamabad, Pakistan.
*Corresponding author; email: [email protected]
Received: September 6, 2019; accepted: January 28, 2020
RESUMEN
La meta de mantener el incremento de la temperatura media global por debajo de 2 ºC y posiblemente de 1.5 ºC se adoptó el Acuerdo de París de 2015. Por ello es importante entender los riesgos e impactos asociados con escenarios de calentamiento mayores a las temperaturas mencionadas. El presente estudio investiga el impacto de un calentamiento adicional de 1.5 y 2 ºC en el rendimiento de cosechas de trigo en Pakistán usando modelación reticular. Los datos generados por cuatro modelos de circulación general (GCM, por sus siglas en inglés) por debajo de 1.5 y 2 ºC se adquirieron del grupo HAPPI de creación de escenarios. El modelo CERES-trigo se calibró y evaluó con datos de campo y después se aplicó a la región de Pakistán. Los resultados de la calibración del modelo muestran una estrecha relación entre el rendimiento de trigo ob-servado y simulado, con un margen de error de 0.52 a 1.36%. Las proyecciones de cambio climático indican que se espera un incremento de 0.46 y 1.44 ºC en la temperatura media en los escenarios de calentamiento adicional de 1.5 y 2 ºC de los GCM, respectivamente. Las variaciones espaciales de precipitación varían de –22.4 a 42.6% y de 4.6 a 34.1% en los escenarios HAPPI de 1.5 y 2.0 ºC, respectivamente. Se registró ma-yor precipitación en el norte que en el centro y sur de Pakistán. Los cambios de temperatura y precipitación proyectados provocarán una disminución en el rendimiento del trigo de 3.2 y 4.7% en Punjab y de 17.8 y 13.8% en la provincia de Sind en los escenarios de calentamiento adicional de 1.5 y 2.0 ºC, respectivamente. Sin embargo, el rendimiento del trigo se incrementará en 4.7 y 13% en Jaiber Pastunjuá y en 9.4 y 15.3% en Baluchistán en los mismos escenarios.
ABSTRACT
Keywords: climate impacts, gridded modeling, HAPPI scenarios, wheat, Pakistan.
1. Introduction
Climate change is threatening agriculture and food se-curity globally (Moorhead, 2009; Lobell and Gourdji, 2012; Lipper et al., 2014). Variations in temperature and uneven distribution of precipitation negatively im-pact the crop production (Asseng et al., 2015a; Ahmad et al., 2018a; Rahman et al., 2018; Ullah et al., 2019a). Future climate projections indicate that the global surface temperature is expected to increase by 0.8 to 1.2 ºC between 2030 to 2052, resulting in a decrease in agriculture productivity (IPCC, 2013). The Paris Agreement in 2015 set a goal to constrain the global warming by 2.0 ºC and pursue efforts to limit the rise in temperature by 1.5 ºC (Rogelj et al., 2016). So, there is an urgent need to explicitly evaluate the spatial climate change variations and impact at country scale under 1.5 and 2.0 ºC additional warming, which will provide policy makers with the scientific information required to develop adaptation and mitigation strategies.
Wheat is one of the domesticated and widely grown staple foods in many developing countries including Pakistan (FAO, 2017). It contributes to 9.6% in value addition and 1.9% to the gross domestic product (GDP) of Pakistan and is cultivated on an area of 9.05 million hectares with a total production of 25.7 million tons (Government of Pakistan, 2017). Wheat production in Pakistan is high, though an increase in unusual climatic conditions such as heat waves, uncertain precipitation and drought have caused a reduction in wheat yield (Ali et al., 2017). Thus, assessing the impact of warming levels of ≤ 2.0 ºC above pre-industrial level, including the benefits of CO2 fertilization on wheat productivity,
is quite timely for ensuring global food security (Rosenzweig et al., 2014).
Climate change projections have shown that tem-perature is expected to rise by 2.8 ºC by the middle of the 21st century, resulting in a 15% reduction of wheat yield (Chaudhry, 2017); however, this au-thor only used the Coupled Model Intercomparison Project phase 5 (CMIP5) and no spatiotemporal variability was studied. The reduction in wheat yield due to higher temperature could be due to the shortening of the growth period (Asseng et al., 2011; Hernandez-Ochoa et al., 2018; Ahmad et al., 2019a).
A rise in temperature will reduce the growing season length by accelerating the phenological development, resulting in wheat yield decrease (Asseng et al., 2015a; Lobell and Ortiz-Monasterio 2007; Ullah et al. 2019b). High temperatures reduce the grain filling duration of the crop; however, cooler temperature at the grain filling stage could result in high yield due to a delay in maturity (Asseng et al., 2015a). Temperature stress reduces the number of grains and grain size, which leads to a decrease in yield (Dias and Lidon, 2009).
In the recent past, crop simulation models have been generally employed to estimate crop perfor-mance under climate change (Harrison et al., 2000; Eitzinger et al., 2004; Hoogenboom et al., 2006). Crop models such as the Decision Support System for Agro-technology Transfer (DSSAT) predict the de-velopment, growth and yield of crops through math-ematical equations as a function of crop genetics, management practices, soil and weather conditions (Hoogenboom, 2000). Crop models have been used under a gridded modeling approach, which provides accurate information regarding decision management and climate impacts at regional scale under spatially heterogenous conditions (Holzworth et al. 2015; Müller et al. 2017; Vanli et al. 2019). The detailed insight and risks for the agricultural sector of Paki-stan under the Half a Degree Additional Warming, Prognosis and Projected Impacts (HAPPI) scenarios (Mitchell et al., 2017) remained unstudied so far.
additional warming scenarios have not yet been studied, as mentioned earlier.
It is also documented that 1.5 and 2.0 ºC additional warming will affect negatively the Sub-Saharan ag-riculture countries (King and Harrington, 2018; Wil-fried et al., 2018). Thus, the current study is planned to use gridded simulations for the impact evaluation of 1.5 and 2.0 ºC additional warming on wheat yield and the ensuing development of empirical models for arid, semi-arid and humid climates in Pakistan. The information on spatial changes in wheat yield under additional warming scenarios will be useful for policy makers and will provide the scientific basis for the development of adaptation strategies. The empirical models developed in this study could be used by researchers and academia to quantify the impact of changes in temperatures and precipitation on wheat yield under various environmental conditions. In gen-eral, the developed methodology may be used as well for regional integrated assessment of climate change.
2. Data and methodology
2.1. Description of study area
The study was conducted for a region of Pakistan that is sparse in data and is located in subtropical zone of southern Asia. The climatic conditions of Pakistan are semiarid with hot summers and mild winters (Ahmad et al., 2018b). The entire region of Pakistan was divided into 10 × 10 km grids with a total of 8188 grids to take into account the soil and climatic spatial heterogeneity.
2.2. HAPPI scenarios
Climate data of maximum temperature (Tmax), minimum temperature (Tmin), precipitation (Pr) and solar radiation were downloaded from the HAPPI project (HAPPI, 2013), whose generated data de-scribe how the climate might be different from the current one in a 1.5 and 2.0 ºC warmer scenario than the pre-industrial conditions (Mitchell et al., 2017). The baseline period of the HAAPI dataset is 2006-2015, while the projected climate period ranges between 2030 and 2040 (IPCC, 2018). The output of the following four GCMs under HAPPI scenarios were used to assess the climate impacts: the Community Atmosphere Model version 4 (CAM4), developed by the Federal Institute of
Technology (ETH) Zurich with spatial resolution of 1.87º × 2.5º (Neale et al., 2010); the European Cen-tre for Medium-Range Weather Forecasts, version 6 (ECHAM6), developed by the Max Planck Institute for Meteorology, Hamburg, with spatial resolution of 1.87º ×1.87º, including a modified version of the land component (Stevens et al., 2013); the Model for Interdisciplinary Research on Climate, version 5 (MIROC5), developed by the National Institute for Environmental Studies, Tsukuba, Japan with spatial resolution of 1.4º ×1.4º (Shiogama et al. 2014); and the Norwegian Earth System model, version 1 (NorESM1), developed by the Climate Center with spatial resolution of 0.94º ×1.25º. The latter is an ocean model which includes an advanced module for aerosols and aerosol-cloud radiation interactions (Bentsen et al., 2013).
The GCMs biases were corrected by the methods described by Hempel et al. (2013) and Frieler et al. (2017). Climate data were generated from the en-semble simulations under various initial conditions. Climate data for Pakistan were extracted from global climatic data and disaggregated to 10 × 10 km grids. The annual mean ambient temperature (TAV) and an-nual amplitude (AMP) were also calculated from the climate data. The CO2 mixing ratio for the baseline
period was 390 ppm, while it was 423 and 486 ppm for the 1.5 and 2.0 ºC additional warming scenarios, respectively (Mitchell et al., 2017).
2.3. Soil data
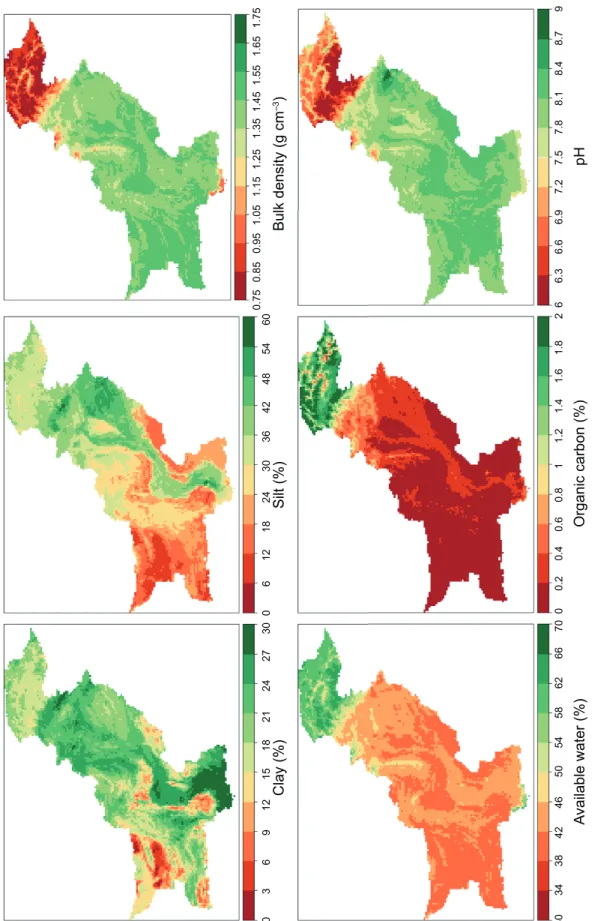
Soil properties data were acquired from ISRIC-World soil information (Hengl et al., 2014). Soil profile data of 0-5, 5-15, 15-30, 30-60 and 60-100 cm depths were taken at a 1-km spatial resolution. The soil pa-rameter includes saturation percent (SP%), bulk den-sity (gcm–3), cation exchange capacity (cmol kg–1),
organic carbon (%), and soil pH. Global soil data for each of the above parameters were aggregated to a 10-km resolution. The drainage upper limit (field capacity) was calculated as 0.50 × SP and the lower limit (permanent wilting point) as 0.25 × SP (Miller and Kissel, 2010).
Fig. 1. Spatial distribution of soil properties in Pakistan.
0 30
34
38
42
46
50
54
58
62
66
70
0
0.2
0.4
0.6
0.
81
1.
21
.4
1.
61
.8
26
6.
36
.6
6.
97
.2
7.
57
.8
8.
18
.4
8.
79
36
9
Clay (%
)S
ilt (%
)B
ulk density (g cm
–3)
Av
ailable water (%
)
Organic carbon (%
)p
H
12
15
18
21
24
27
30
06
12
18
24
30
36
42
48
54
60
0.75
0.85
0.95
1.05
1.15
1.25
1.35
1.45
1.55
1.65
and southern Pakistan, as compared to northern Pakistan. Higher percentage of silt and clay in soil were recorded in the Indus basin irrigation system.
2.4. Model calibration and evaluation
The CERES-Wheat model under the shell of DSSAT was calibrated and evaluated using field data. The experiment was conducted at Ayub Agriculture Re-search Institute, Faisalabad during the Rabi season of 2016-2017 and 2017-2018.
The responses of three wheat cultivars (Faisala-bad-2008, Lasani-2008 and Sehar-2006) were evalu-ated under four different levels of nitrogen (0, 50, 100 and 200 kg ha–1). The genetic coefficients of the model
were adjusted at non-stressed treatment of 100 kg N ha-1 for three cultivars using generalized likelihood
uncertainty estimation (GLUE) following Ahmad et al. (2018a). After calibration, the model was evaluated using experimental data for the period 2017-2018.
2.5. Impact assessment of 1.5 and 2.0 ºC additional warming scenarios using a gridded approach
The calibrated CERES-Wheat model was used for gridded climate analysis. The crop management prac-tices and fertilizers recommended by the government of Pakistan such as nitrogen (N), phosphorus (P) and potassium (K) were used as input for the crop model. The management practices were divided into three categories: irrigated (four irrigations of 75 mm), rain-fed (without irrigation) and partially irrigated (two irrigation of 75 mm) as shown in Table I. The spatial analysis of the model was carried out to estimate the impact of 1.5 and 2.0 ºC additional warming under HAPPI scenarios. The output yield of each grid was displayed via geospatial maps of Pakistan. The detail methodology is presented in Figure 2.
The impacts of climate change on wheat yield were computed by the difference of yield with 1.5 and 2.0 ºC additional warming from the baseline yield,
as described in Eq. (1):
Yc= Yf – YY b
b × 100 (1)
where Yc is the percent change in yield, Yf is the future simulated yield, and Yb is the baseline simu-lated yield.
Multiple linear yield estimation empirical models were developed by utilizing the climate variables for arid, semiarid and humid areas of Pakistan. Tempera-ture, precipitation, and yield differences were com-puted for the baseline and future period of each GCM and the least absolute shrinkage and selection operator (LASSO) regression was employed to develop the empirical model. About 70% of the data was used for the development of the model, whereas the remaining 30% was used for validation following Kohavi (1995).
3. Results
3.1. Estimated genetic coefficient of the CERES-Wheat model
The estimated genetic coefficients of wheat cultivars during model calibration are displayed in Table II. The P1V and P1D coefficients are related to phenology
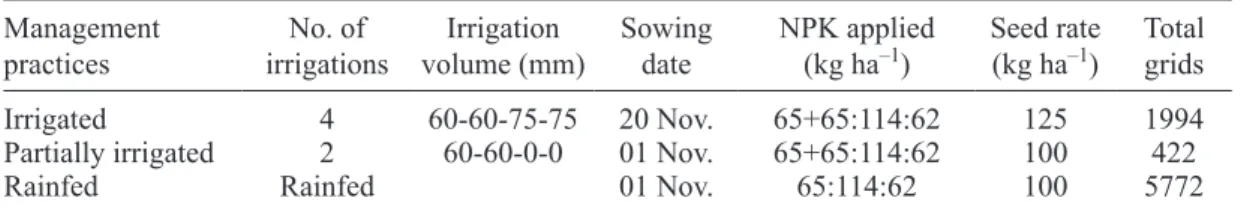
Table I. Management practices recommended by the government of Pakistan for wheat production in each grid.
Management
practices irrigationsNo. of volume (mm)Irrigation Sowingdate NPK applied(kg ha–1) Seed rate(kg ha–1) Totalgrids
Irrigated 4 60-60-75-75 20 Nov. 65+65:114:62 125 1994
Partially irrigated 2 60-60-0-0 01 Nov. 65+65:114:62 100 422
Rainfed Rainfed 01 Nov. 65:114:62 100 5772
Soil, Climate and Crop Management
Data
Calibration & Evaluation of Model Using Experimental Data
Gridded Simulation of CERES-Wheat Crop Model
Impact of 1.5ºC and 2ºC on Wheat (Geo-Spatial Mapping)
Development of Yield Estimation Models
Crop Management Practices HAPPI Scenarios
Soil Data (ISRIC)
when moisture is a non-limiting factor for germi-nation and the rate of crop development depends upon temperature. The values of vernalization (P1V) were set to 9-0 days for spring wheat cultivars. The photoperiod requirements (P1D) were similar for Lasani-2008 and Sehar-2006, while lower for Fais-labad-2008. A large thermal time of 430 ºC day–1 at
grain filling (P5) was estimated for Faislabad-2008 and Sehar-2006 as compared to Lasani-2006.
The G1 and G2 coefficients are related to yield traits and showed a compensatory effect since increas-ing the number of grains (G1) results in decreasincreas-ing grain size (G2). G3 is related to plant height and biomass production and did not show any difference between wheat cultivars. The phyllochron interval (PHINT) reflects the appearance of leaves on stem and is temperature dependent. The wheat cultivars did not show any differences regarding this marker during the vegetative stage.
3.2. Calibration and evaluation of the CERES-Wheat model
The CERES-wheat model was calibrated using field observations on phenology, growth, and yield
attributes (Table III). A close agreement was observed in simulation of anthesis and maturity days. The mod-el simulated anthesis with no difference with fimod-eld observations for Faislabad-2008 and Sehar-2006, whereas a difference of only one day was observed for Lasani-2008. The simulated maturity days were close to observed values for Lasani-2008 and Se-har-2006; however, the model showed a two-day early maturity for Faisalabad-2008 (Table III). The model over simulated the leaf area index maximum (LAImax) for all cultivars with an error ranging from
5.76 to 9.25%.
The model also simulated wheat yield satisfac-torily. A close match was found between simulated and observed values with an error ranging from 0.52 to 1.36%. A close fit was also recorded in the simulation of biological yield for Faislabad-2008 and Sehar-2006, while the model over simulated the biomass for Lasani-2008 with an error of 6.94%.
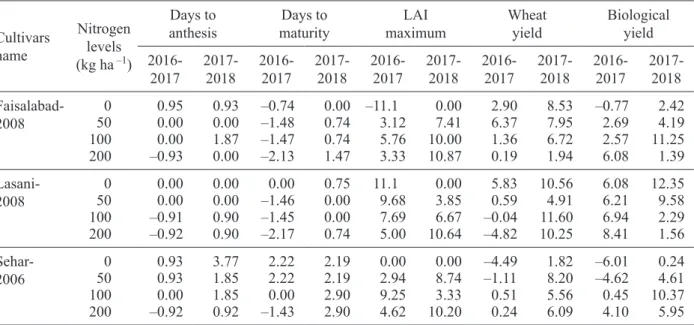
Evaluation results indicate that the model per-formed reasonably well for anthesis days at differ-ent levels of nitrogen for three cultivars of wheat, as shown in Table IV. Nevertheless, a four-day difference between simulations and field observations was
Table II. Adjusted genetic coefficients of the CERES-Wheat model for three cultivars of wheat.
Cultivars P1V P1D P5 G1 G2 G3 PHINT
Faisalabad-2008 9 47 429 35 20 2.8 100
Lasani-2008 10 50 402 31 21 2.8 102
Sehar-2006 10 49 420 34 20 2.8 100
P1V: vernalization days; P1D: photoperiodic sensitivity; P5: grain filling duration (ºC day–1); G1: number of grains (number of grains × g–1); G2: grain size (mg); G3: non-stress tillers; PHINT: subsequent leaf tip interval (ºC day–1).
Table III. Calibration of the CERES-Wheat model at 100 kg N ha–1 for various wheat cultivars for the period 2016-2017.
Parameters Faisalabad-2008 Lasani-2008 Sehar-2006
Observed Simulated % error Observed Simulated % error Observed Simulated % error
Days to anthesis 106 106 0.00 109 108 –0.91 108 108 0.00
Days to maturity 136 134 –1.47 137 135 –1.45 135 135 0.00
LAI max 5.20 5.50 5.76 5.20 5.60 7.69 5.40 5.90 9.25
Wheat yield
(kg ha–-1) 4485 4546 1.36 4147 4145 –0.04 4504 4527 0.51
Biological yield
recorded with the zero nitrogen dose for Se-har-2006. The simulation of maturity days was suitable, but a 2-3 days difference was recorded relative to the observed values at high dose of nitrogen (200 kg N ha–1). The LAI simulation was
satisfactory, but a higher error was recorded at zero and 200 kg N ha–1. The model showed a close match
between simulations and observed data at various doses of nitrogen and cultivars, with an error rang-ing from 0.59 to 11.60%. Regardrang-ing the biological simulation, the model overestimated the biomass at zero nitrogen, which could be due to presence of initial nitrogen.
3.3. Climate change projections under HAPPI sce-narios
The projected winter temperature and precipitation in all GCMs under HAPPI scenarios displayed different patterns over the entire region of Pakistan (Figs. 3-5). The spatial pattern of warming is similar under the 1.5 and 2.0 ºC additional warming scenari-os, and the magnitude of warming is higher over the entire region of Pakistan under the 2.0 ºC additional warming scenario. The spatial pattern of Tmax and Tmin revealed a lower increase in northern Pakistan, while a higher increase was projected in central and southern Pakistan (Figs. 3 and 4). CAM4 showed a higher increase in Tmax and Tmin, whereas ECHM6
showed a lower increase in Tmax and Tmin over the entire region, especially in KP and Gilgit Baltistan. NorESM1 displayed a higher increase in Tmax in Pun-jab (Fig. 3), with increase in Tmin was lower (Fig. 4). The Tmax ensemble mean showed an increase over the entire region of Pakistan under the 1.5 ºC addi-tional warming scenario, and a greater increase was observed in Punjab under the 2 ºC additional warming (Fig. 3). The Tmin ensemble mean showed a great-er increase in Gilgit-Baltistan in both the 1.5 and 2.0 ºC additional warming scenarios (Fig. 4).
The precipitation trend showed an increase under the 1.5 and 2.0 ºC additional warming scenarios. Changes in the spatial pattern of precipitation was also similar in both scenarios in Pakistan. Higher precipitation was recorded in KP and Gilgit-Baltis-tan, whereas Punjab, Sindh and Baluchistan had lower precipitation (Fig. 5). Wheat is a winter (rabi) crop sown in November-December and harvested in March-April, therefore this crop fully relies on irrigation because of low precipitation during winter. Increased rainfall during critical stages (crown root initiation, flowering, and physiological maturity) enhances the yield (Mudasser et al. 2001; Ahmad et al. 2019b). Thus, high precipitation in KP and Gilgit-Baltistan, as shown in Figure 5, enhanced the yield, while less precipitation in lower in Punjab, Sindh and Baluchistan caused a reduction.
Table IV. Evaluation of the model at various levels of nitrogen and three wheat cultivars.
Cultivars name
Nitrogen levels (kg ha –1)
Days to
anthesis maturityDays to maximumLAI Wheatyield Biological yield
2016-2017 2017-2018 2016-2017 2017-2018 2016-2017 2017-2018 2016-2017 2017-2018 2016-2017 2017-2018
Faisalabad-2008 500 0.950.00 0.000.93 –0.74–1.48 0.740.00 –11.13.12 0.007.41 2.906.37 8.537.95 –0.772.69 2.424.19
100 0.00 1.87 –1.47 0.74 5.76 10.00 1.36 6.72 2.57 11.25
200 –0.93 0.00 –2.13 1.47 3.33 10.87 0.19 1.94 6.08 1.39
Lasani-2008 500 0.000.00 0.000.00 –1.460.00 0.750.00 11.19.68 3.850.00 0.595.83 10.564.91 6.216.08 12.359.58
100 –0.91 0.90 –1.45 0.00 7.69 6.67 –0.04 11.60 6.94 2.29
200 –0.92 0.90 –2.17 0.74 5.00 10.64 –4.82 10.25 8.41 1.56
Sehar-2006 500 0.930.93 3.771.85 2.222.22 2.192.19 2.940.00 8.740.00 –1.11–4.49 8.201.82 –4.62–6.01 0.244.61
100 0.00 1.85 0.00 2.90 9.25 3.33 0.51 5.56 0.45 10.37
CAM4 1.5°C
ECHAM6 1.5°C
MIROC5 1.5°C
NorESM1 1.5°C
Ensemble mean 1.5°C
CAM4 2.0°C
–2.5
–2
–1.5
–0.5
0
0.5
1
1.5
2
2.5
–1
ECHAM6 2.0°C
MIROC5 2.0°C
Tmax (°C)
NorESM1 2.0°C
Ensemble mean 2.0°C
Fi
g.
3
. C
ha
ng
es i
n
Tm
ax
d
ur
in
g wi
nt
er
fr
om
b
ase
lin
e u
nd
er
th
e 1
.5
ºC
(t
op
ro
w p
an
el
s)
an
d 2
.0
ºC
(b
ot
to
m
ro
w p
an
el
s)
ad
di
tio
na
l wa
rm
in
g sc
en
ari
os i
n Pa
ki
sta
CAM4 1.5°C
ECHAM6 1.5°C
MIROC5 1.5°C
NorESM1 1.5°C
Ensemble mean 1.5°C
CAM4 2.0°C
–2.5
–2
–1.5
–0.5
0
0.5
1
1.5
2
2.5
–1
ECHAM6 2.0°C
MIROC5 2.0°C
Tmin (°C
)
NorESM1 2.0°C
Ensemble mean 2.0°C
Fig. 4. Changes in
Tmin
during winter from baseline
under the 1.5 ºC (top row panels) and 2.0 ºC (bottom row panels) additional
warming scenarios in
CAM4 1.5°C
ECHAM6 1.5°C
MIROC5 1.5°C
NorESM1 1.5°C
Ensemble mean 1.5°C
CAM4 2.0°C
–750
–600
–450
–150
0
150
300
450
600
750
–300
ECHAM6 2.0°C
MIROC5 2.0°C Precipitation (mm)
NorESM1 2.0°C
Ensemble mean 2.0°C
Fig. 5. Changes in precipitation
during winter
from baseline
under the
1.5 ºC (top row panels)
and 2.0 ºC (bottom
row panels)
additional
warming
scenarios
Furthermore, HAPPI scenarios indicated that Tmax (Tmin) will increase by 2.60 ºC (0.66 ºC) under the 1.5 ºC warming scenario, whereas Tmax (Tmin) will increase by 1.45ºC (1.44ºC) under the 2.0 ºC warming scenario (Table V). The ensemble means showed that Tmax will increase by 0.85 ºC, Tmin will increase by 1.05 ºC and precipitation by 204 mm under 1.5 and 2.0 ºC additional warming during 2030-2040 (Table V). Thus, higher temperatures, coupled with less precipitation caused reduction in wheat yield, because higher temperatures increase levels of water stress in plant cells, crop water requirement, and respiration.
3.4 Impact of 1.5 and 2.0 ºC additional warming on wheat yield
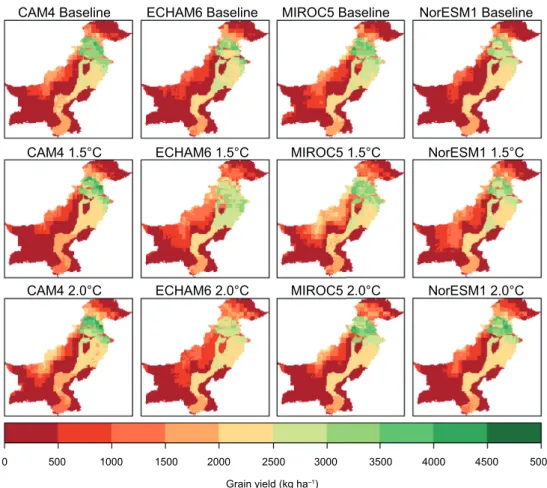
The impacts of the 1.5 and 2.0 ºC additional warming scenarios include both positive and negative rela-tive changes in wheat yield in different districts of Pakistan (Figs. 6 and 7). The spatial pattern of yield shows that higher yield was recorded in KP, Punjab and Sindh provinces, while lower yield in Baluchistan and Gilgit Baltistan in all GCMs under the 1.5 and 2.0 ºC additional warming scenarios (Fig. 6). A maxi-mum wheat yield of 2500-3000 kg ha–1 was recorded
in KP, Punjab and Sindh. The high yield was a result of good soil quality and availability of water due to the presence of the Indus and Kabul rivers, which are near to the productive zone for wheat cultivation in current conditions and under the 1.5 and 2.0 ºC ad-ditional warming scenarios. New potential areas for wheat cultivation are emerging in Gilgit Baltistan, KP and Baluchistan under the 1.5 and 2.0 ºC additional warming scenarios (Fig. 6).
The spatial pattern of changes in wheat yield (%) at district level showed a similar trend in both the 1.5 and 2.0 ºC additional warming scenarios, though a higher increase in yield was found in the 2.0 ºC warming scenario (Fig. 7). A reduction in yield was recorded in Punjab, Sindh and a few districts in Baluchistan, whereas the areas in KP, Baluchistan and Gilgit Baltistan showed an increase in yield under both the 1.5 and 2.0 ºC additional warming scenarios as compared to baseline. A high reduction in yield was recorded in CAM4 and MICROC5. CAM4 showed a decrease in yield in Baluchistan and in a few areas of KP under the 1.5 ºC warming scenario, whereas MIROC5 showed a decrease in yield in Baluchistan under both the 1.5 and 2.0 ºC additional warming scenarios (Fig. 7). ECHAM6 and NorESM1 displayed a decrease in yield in Punjab and an increase in yield in KP, Baluchistan and Gilgit Baltistan (Fig. 7).
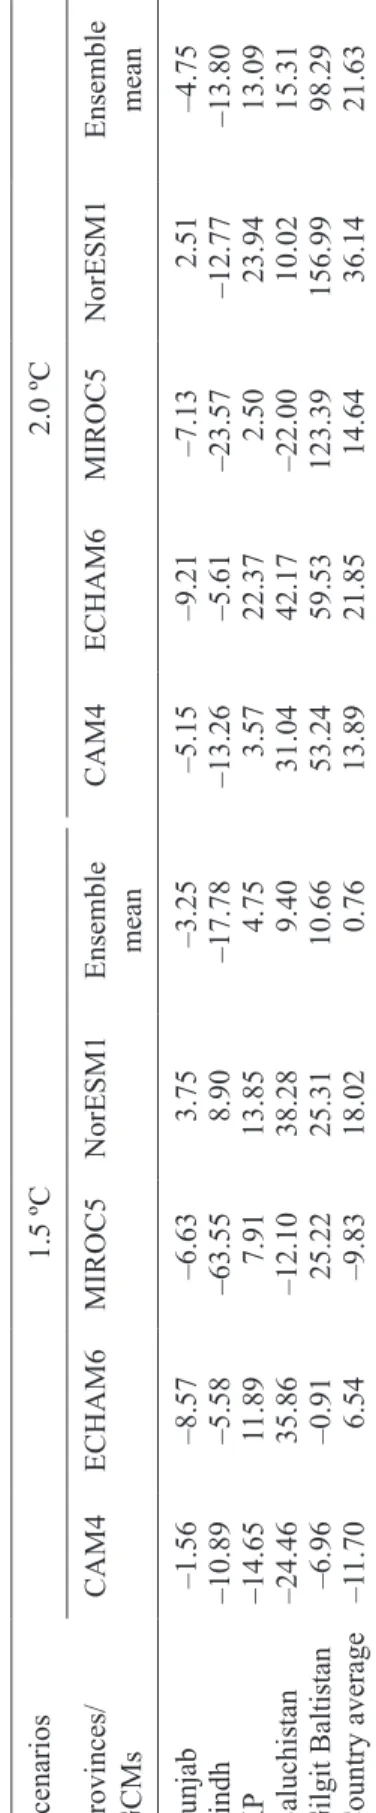
The yield will decrease by 3.25% and 4.75% in Punjab, while in Sindh it will diminish by 17.8% and 13.8% under the 1.5 and 2.0 ºC warming scenarios, respectively. However, the yield will increase by 13% in KP, while an increase of 9.4% and 15.3% in Baluchistan under the 1.5 and 2.0 ºC additional warming scenarios is projected. Gilgit Baltistan showed an increased in yield of 10.6% under the 1.5 ºC warming scenario and 98% in 2.0 ºC scenario. The higher increase in yield at Gilgit Baltistan was due to the suitability of new areas for wheat production owing to additional warming of the 1.5 and 2.0 ºC scenarios as shown in Table VI.
Climate change impacts showed a reduction in yield of 3.2 and 4.7% in Punjab, and 17.8 and 13.8%
Table V. Changes in temperature and accumulated precipitation in winter season for all GCMs under the 1.5 and 2.0 ºC additional warming scenarios for Pakistan.
Scenarios 1.5 ºC 2.0 ºC
Variables Tmax
(ºC) Tmin(ºC) Precipitation(mm) Tmax(ºC) Tmin(ºC) Precipitation(mm)
CAM4 1.22 1.00 –290.4 1.95 1.89 59.07
ECHAM6 –0.13 0.22 583.7 1.06 1.34 466.9
MIROC5 –0.80 1.06 232.0 1.32 1.33 68.5
NorESM1 0.76 0.35 357.2 1.48 1.21 157.2
0 500 1000 1500 2000
Grain yield (kg ha–1)
3000 4000 5000
2500 3500 4500
CAM4 1.5°C ECHAM6 1.5°C MIROC5 1.5°C NorESM1 1.5°C
CAM4 2.0°C ECHAM6 2.0°C MIROC5 2.0°C NorESM1 2.0°C
Fig. 6. Spatial patterns of mean wheat yield in different GCMs under baseline (top row panels), 1.5 ºC (middle row panels) and 2.0 ºC (bottom row panels) additional warming scenarios in Pakistan.
CAM4 1.5°C ECHAM6 1.5°C MIROC5 1.5°C NorESM1 1.5°C
CAM4 2.0°C ECHAM6 2.0°C MIROC5 2.0°C NorESM1 2.0°C
–100 –80 –60 –40 –20 0
∆Y (%)
20 40 60 80 100
in Sindh under the 1.5 and 2.0 ºC additional warming scenarios, respectively. However, the yield increases by 4.7 and 13% in KP, and 9.4 and 15.3% in Balu-chistan under the 1.5 and 2.0 ºC additional warming scenarios, respectively. The reduction in yield was calculated using Eq. (1). Gilgit Baltistan showed greater increases in yield of 10.6 and 98% in both the 1.5 and 2.0 ºC additional warming (Table VI). The greater increased in yield under the 2.0 ºC ad-ditional warming could be due to the emergence of new areas for wheat production.
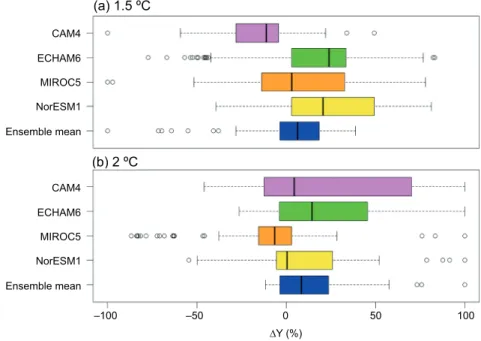
The GCMs exhibited an uncertainty in the eval-uation of climate change impacts. The country aver-age showed a higher reduction in yield of 11.7% in CAM4 and 9.8% in MIROC5 recorded under 1.5 ºC additional warming, whereas yield increases in all GCMs were regsitered under 2.0 ºC additional warming (Table VI and Fig. 8). A greater increase in yield was recorded in NorESM1 under both additional warming scenarios. CAM4 and MIROC5 have more interquartile ranges as compared to ECHAM6 and NorESM1 (Fig. 8). Considering values lower than the 25th percentile or higher than 75th percentile as outliers, ECHAM6 under the 1.5 ºC scenario (Fig. 8a) and MIROC5 under the 2.0 ºC scenario displayed more outliers (Fig. 8b).
3.5. Development of an empirical model for yield estimation
Empirical models for yield estimation were de-veloped for arid (annual precipitation < 300 mm), semi-arid (300-1000) and humid (>1000) environ-ments using LASSO regression (Table VII). The differences of Tmax, Tmin, precipitation and yields were calculated using the future GCMs relative to baseline. Seventy percent of the gridded data of all GCMs was used to develop the model and the re-maining 30% to test the model. The results indicated that all climate variables significantly contributed to the development of the model, except for Tmin for arid environment and precipitation for humid environment (Table VII).
The empirical models for estimating wheat yield for arid (Ya), semi-arid (Ysa) and humid (Yh) environ-ments are given in Eqs. (2), (3), and (4), respectively:
Ya = –42.31 – 22.90 ×Tmax
+ 8.02×Tmin + 0.10 × Pr (2)
Table
VI. Mean percent change in wheat yield in four dif
ferent GCMs under the 1.5 and 2.0 ºC additional warming scenarios in all provinces of Pakistan.
Fig. 8. Changes in wheat yield (%) in different GCMs under (a) 1.5 ºC and (b) 2.0 ºC additional warming scenarios in Pakistan.
CAM4
(a) 1.5 ºC
(b) 2 ºC
ECHAM6
MIROC5
NorESM1
Ensemble mean
CAM4
ECHAM6
MIROC5
NorESM1
Ensemble mean
–100 –50 0
∆Y (%)
50 100
( (
( )))
Table VII. Development of the empirical yield estimation models for arid, semiarid and humid environmental conditions under climate change.
Coefficient Estimate Standard error t value Pb (> |t|)
Arid (precipitation < 300 mm)
Intercept –42.31 3.93 –10.74 0.00 *
Tmax –22.90 3.66 –6.25 0.00 *
Tmin 8.02 3.35 2.39 0.01 *
Precipitation 0.40 0.01 40.48 0.00 *
Semi–arid (precipitation 300–1000 mm)
Intercept 12.0 2.79 4.30 0.00 *
Tmax –119.0 2.87 –41.43 0.00 *
Tmin 73.14 2.86 25.58 0.00 *
Precipitation 0.47 0.00 95.63 0.00 *
Humid (precipitation >1000 mm)
Intercept 106.60 6.20 17.18 0.00 *
Tmax –264.90 7.78 –34.04 0.00 *
Tmin 288.20 8.50 33.91 0.00 *
Precipitation 0.005 0.01 0.93 0.25
Ysa = 12.0 – 119.0 ×Tmax
+ 73.14×Tmin + 0.47 × Pr (3)
Yh = 106.0 – 264.90 ×Tmax
+ 288.20×Tmin + 0.005× Pr (4)
where Y is in kg ha–1, Tmax and Tmin are in ºC and
P is in mm. The results indicate that a rise of 1 ºCin Tmax will diminish the yield by 22.9 kg ha–1 in an
arid environment, 119 kg ha–1 in a semi-arid
environ-ment and 264 kg ha–1 in a humid environment, while
a 1 ºC risein Tmin will increase the yield by 8 kg ha–1
in an arid environment, 73 kg ha–1 in a semi-arid
environment and 288 kg ha–1 in a humid environment
The performance of the developed empirical model for arid environment was adequate, since the root mean square error (RMSE) value was 102.9 kg ha–1, with an R2 of 0.71. The results for
semi-arid environments were also good with RMSE values of 128.2 kg ha–1 and R2 of 0.74. The developed
model for humid environment showed an RMSE value of 147.5 kg ha–1 and R2 of 0.68. The developed
models will be useful for stakeholders such as policy makers, researchers, farmers and academics for the estimation of yield in changing climate conditions. The yield change (kg ha–1) can be estimated by
knowing the change in temperatures and precipita-tion. The impact of unit change in Tmax, Tmin and precipitation on wheat yield can be calculated for arid, semi-arid and humid environments by using the developed empirical models shown in Eqs. (2), (3), and (4), respectively.
4. Discussion
The calibration of the CERES-Wheat model indi-cated good to fair predictions of phenology, growth, and yield of wheat cultivars (Table III). Phenology of wheat has a strong influence on the development and grain yield of the crop (Ceglar et al., 2011). The precise estimation of phenological events is the first priority to calibrate crop mode, because it captures all genotypic variations that affect the leaf area develop-ment, biomass production and grain yield (Robertson et al., 2002). In the CERES-Wheat model, flowering and maturity dates were controlled by parameters like P1V, P1D, P5 and PHINT (Andarzian et al., 2008). In the current study, a close agreement was found
between predicted and observed days to anthesis and maturity as indicated by different validation scores (Tables III and IV).
In the CERES-Wheat model, G1, G2 and G3 are the parameters which control grain yield, therefore the precise adjustment of these parameters is import-ant. The results of simulations showed that the yield remained close to the observed values among all cultivars as confirmed by the validation skill scores (Tables III and IV). Related coefficients represented by G1 and G2 showed the compensatory effect in all cultivars (Table II). It could be due to the fact that as the number of grain increases, the assimilates available for grain filling decrease; the grain weight is reduced due to higher competition (Maldonado-Ibar-ra et al., 2015).
Climate change projections showed a higher increase in temperature in Punjab, Sindh, and Balu-chistan, as compared to KP and Gilgit Baltistan prov-inces in Pakistan (Fig. 3). Northern Pakistan (KP and Gilgit Baltistan) is located at a high altitude, with cold mountains and frigid areas; thus, a lower increase in temperature and more precipitation was projected in climate change scenarios. However, Punjab, Sindh and Baluchistan are located at middle and low altitude areas at which a greater increase in temperature was projected. A higher precipitation was projected in the 2.0 ºC additional warming scenario as compared to the 1.5 ºC additional warming scenarios (Fig. 3). This is due to fact that high temperature causes higher evaporation and more water is available for precipitation (Trenberth, 2011).
the development time of wheat grains (Asseng et al., 2015b). The yield increased in few areas, which could be due to a favorable temperature for wheat production and a warmer environment close to the optimal temperature for photosynthesis. Northern Pakistan has usually a very low temperature, which is unfavorable for successful crops production. Thus, a combination of increased temperatures, changing patterns of precipitation and CO2 fertilization provide
a suitable growth environment for successful wheat production in this region.
Multiple linear regression empirical models were developed for yield estimation from climate variables for arid, semiarid and humid environments, using sep-arately LASSO regression (Table VII). LASSO em-ploys a machine learning approach which is used to develop the models. It is widely used by researchers for training and testing of linear models (Meier et al., 2008; Hans, 2009; Reid et al., 2016). The developed regression equations reflect the linear combination of Tmax, Tmin and Pr, and will be useful for stake-holders such as researchers and farmers to estimate the variation in yield due to changes in temperature and precipitation. The yield variation will provide scientific basis for the development of adaptation strategies offsetting the impacts of climate change.
In the current study, there were extreme changes in yield (above the 75th percentile and below the 25th percentile) in all GCMs as displayed in Figure 8. The extreme increase in yield could be due to the addition of new areas for wheat production owing to favorable environment of 1.5 and 2.0 ºC additional warming scenarios including the changing pattern of precipitation. The extreme reduction in yield may originate from the extinction of few areas for wheat production due to unsuitable conditions caused by the additional warming of 1.5 and 2.0 ºC and chang-es in precipitation. Overall benefits from climate change are larger than yield losses. Thus, it could be expected that the 1.5 and 2.0 ºC additional warming would bring more opportunities than risks for crop production and food supply in Pakistan.
5. Conclusions
This study was conducted to investigate climate risk and impacts associated with 1.5 and 2.0 ºC additional warming scenarios on wheat yield in Pakistan using
a gridded modeling approach. The salient features of this study are as follows:
• The CERES-Wheat model was calibrated using an experimental data set, which showed a good agreement between observed and simulated val-ues of wheat yield with an error ranging between 0.52 and 1.36%.
• Spatial distribution patterns showed a higher in-crease in Tmax and Tmin, and lower precipitation in Punjab and Sind as compared to KP, Baluch-istan and Gilgit BaltBaluch-istan provinces under 1.5 and 2.0 ºC additional warming scenarios.
• Climate change projections showed that mean temperature is expected to rise by 0.46 ºC in the 1.5 ºC additional warming scenario and 1.44 ºC in the 2.0 ºC additional warming scenario in Pakistan.
• Projected changes in temperature and precipita-tion will decrease the yield by 3.2 and 4.7% in Punjab, and by 17.8 and 13.8% in Sindh provinces under the 1.5 and 2.0 ºC additional warming sce-narios, respectively.
• Wheat yield will increase by 13% in KP, and by 9.4 and 15.3% in Baluchistan under the 1.5 and 2.0 ºC additional warming scenarios, respectively, creating an opportunity to identify new wheat production areas for ensuring the food security in Pakistan
References
Ahmad A, Ashfaq M, Rasul G, Wajid SA, Khaliq T, Rasul F, et al. 2015. Impact of climate change on the rice-wheat cropping system of Pakistan. In: Handbook of climate change and agroecosystems: The agricultural model intercomparison and improvement project (Ag-MIP) (Rosenzweig C, Hillel D, Eds.). ICP Series on Climate Change Impacts, Adaptation, and Mitigation, vol. 3. Imperial College Press, London, 219-258). Ahmad A, Ahmad I, Khan MR, Shah SHH, Kamran MA,
Wajid, SA, Amin M, Khan A, Arshad MN, Cheema, MJM, Saqib ZA, Ullah, R, Ziaf K, Huq A, Ahmad S, Fahad M, Waqas MM, Abbas A, Iqbal A. 2019. Agro-ecological zones of Punjab, Pakistan. United Nations Food and Agriculture Organization, Rome. Ahmad I, Wajid SA, Ahmad A, Cheema MJM, Judge
semi-arid environment. International Journal of Ag-riculture and Biology 20, 2203-2210. https://doi. org/10.17957/IJAB/15.0762
Ahmad I, Rahman MH, Ahmed S, Hussain J, Ullah A, Judge J. 2018. Assessing the impact of climate variabil-ity on maize using simulation modeling under semi-ar-id environment of Punjab, Pakistan. Environmental Science and Pollution Research 25, 28413-28430. https://doi.org/10.1007/s11356-018-2884-3
Ahmad I, Wajid SA, Ahmad A, Cheema MJM, Judge J. 2019b. Optimizing irrigation and nitrogen re-quirements for maize through empirical modeling in semi-arid environment. Environmental Science and Pollution Research 26, 1227-1237. https://doi. org/10.1007/s11356-018-2772-x
Ahmad I, Ullah A, ur Rahman MH, Ahmad B, Wajid SA, Ahmad A, Ahmed S. 2019. Climate change impacts and adaptation strategies for agronomic crops. In: Climate Change and Agriculture (Hussain S., Ed.). IntechOpen, 1-15. https://doi.org/10.5772/intechopen.82697 Ali S, Liu Y, Ishaq M, Shah T, Ilyas A, and Din IU. 2017.
Climate change and its impact on the yield of major food crops: evidence from Pakistan. Foods 6, 39. https://doi.org/10.3390/foods6060039
Andarzian B, Bakhshandeh AM, Bannayan M, Emam Y, Fathi G, Saeed KA. 2008. WheatPot: A simple model for spring wheat yield potential using monthly weather data. Biosystems Engineering 99, 487-495. https://doi. org/10.1016/j.biosystemseng.2007.12.008
Asseng S, Foster IAN, Turner NC. 2011. The impact of temperature variability on wheat yields. Global Change Biology 17, 997-1012. https://doi.org/10.1111/j.1365-2486.2010.02262.x
Asseng S, Ewert F, Martre P, Rotter RP, Lobell DB, Cam-marano D, et al. 2015a. Rising temperatures reduce global wheat production. Nature Climate Change 5, 143-147. https://doi.org/10.1038/nclimate2470 Asseng S, Zhu Y, Wang E, Zhang W. 2015b. Crop modeling
for climate change impact and adaptation. In: Crop phisiollogy. Applications for genetic improvement and agronomy. 2nd. ed. (Sadras VO, Ed.). Academic Press, San Diego, 505-546.
Bentsen M, Bethke I, Debernard JB, Iversen T, Kirkevåg A, Seland Ø, et al. 2013. The Norwegian Earth System Model, NorESM1-M-Part 1: Description and basic evaluation of the physical climate. Geoscientific Model Development 6, 687-720. https://doi.org/10.5194/ gmd-6-687-2013
Ceglar A, Črepinšek Z, Kajfež-Bogataj L, Pogačar T. 2011. The simulation of phenological development in dynamic crop model: The Bayesian comparison of different methods. Agricultural and Forest Me-teorology 151, 101-115. https://doi.org/10.1016/j. agrformet.2010.09.007
Chaudhry QUZ. 2017. Climate change profile of Pakistan. Asian Development Bank, Manila, Philippines. Dias AS, Lidon FC. 2009. Evaluation of grain filling rate
and duration in bread and durum wheat, under heat stress after anthesis. Journal of Agronomy and Crop Science 195, 137-147. https://doi.org/10.1111/j.1439-037X.2008.00347.x
Eitzinger J, Trnka M, Hösch J, Žalud Z, and Dubrovský M. 2004. Comparison of CERES, WOFOST and SWAP models in simulating soil water content during grow-ing season under different soil conditions. Ecological Modelling 171, 223-246. https://doi.org/10.1016/j. ecolmodel.2003.08.012
FAO. 2017. Cereal supply and demand brief. Food andAg-riculture Organization of the United Nations, Rome. Available at: http://www.fao.org/worldfoodsituation/ wfs-home/csdb/en/ (last accessed on April 7, 2011). Frieler K, Lange S, Piontek F, Reyer CPO, Schewe J,
Warszawski L, et al. 2017. Assessing the impacts of 1.5 C global warming-simulation protocol of the Inter-Sectoral Impact Model Intercomparison Project (ISIMIP2b). Geoscientific Model Development 18, 102-122. https://doi.org/10.5194/gmd-10-4321-2017 Government of Pakistan. 2017. Economic survey of Pa-kistan. Economic Advisory Wing, Finance Division, Govt. of Pakistan, 29-30.
Hans C. 2009. Bayesian lasso regression. Biometrika 96, 835-845. https://doi.org/10.1093/biomet/asp047 HAPPI Project. 2013. Available at: https://portal.nersc.
gov/c20c/data/ClimateAnalytics/ (last accessed on December 31, 2019).
Harrison PA, Porter JR, Downing TE. 2000. Scaling-up the AFRCWHEAT2 model to assess phenological devel-opment for wheat in Europe. Agricultural and Forest Meteorology 101, 167-186. https://doi.org/10.1016/ S0168-1923(99)00164-1
Hempel S, Frieler K, Warszawski L, Schewe J, Piontek F. 2013. A trend-preserving bias correction-the ISI-MIP approach. Earth System Dynamics 4, 219-236. https:// doi.org/10.5194/esd-4-219-2013
global soil information based on automated mapping. PloS one 9, e105992. https://doi.org/10.1371/journal. pone.0105992
Hernández-Ochoa IM, Asseng S, Kassie BT, Xiong W, Robertson R, Pequeno DNL, et al. 2018. Climate change impact on Mexico wheat production. Agricul-tural and Forest Meteorology 263, 373-387. https:// doi.org/10.1016/j.agrformet.2018.09.008
Holzworth DP, Snow V, Janssen S, Athanasiadis IN, Do-natelli M, Hoogenboom G, et al. 2015. Agricultural production systems modelling and software: current status and future prospects. Environmental Modelling & Software 72, 276-286. https://doi.org/10.1016/j. envsoft.2014.12.013
Hoogenboom G. 2000. Contribution of agrometeorology to the simulation of crop production and its applications. Agricultural and Forest Meteorology 103, 137-157. https://doi.org/10.1016/S0168-1923(00)00108-8 Hoogenboom G, Guerra LC, Paz JO, Fraisse CW. 2006.
Analysis of the inter-annual variation of peanut yield in Georgia using a dynamic crop simulation model. Transactions of the ASABE 49, 2005-2016. https:// doi.org/10.13031/2013.22281
IPCC. 2013. Climate change 2013. The Physical Science Basis. Contribution of Working Group I to the Fifth Assessment Report of the Intergovernmental Panel on Climate Change (Stocker TF, Qin D, Plattner G-K, Tignor M, Allen SK, Boschung J, Nauels A, Xia Y, Bex V, Midgley PM, Eds.). Cambridge University Press, Cambridge, United Kingdom and New York, NY, USA, 1535 pp.
IPCC. 2018. Summary for policymakers. In: Global warm-ing of 1.5vºC. An IPCC special report on the impacts of global warming of 1.5 ºC above pre-industrial levels and related global greenhouse gas emission pathways, in the context of strengthening the global response to the threat of climate change, sustainable development, and efforts to eradicate poverty (Masson-Delmotte V, Zhai P, Pörtner H O, Roberts D, Skea J, Shukla P R, Pirani A, Moufouma-Okia W, Péan C, Pidcock R, Connors S, Matthews J B R, Chen Y, Zhou X, Gomis M I, Lonnoy E, Maycock T, Tignor M, Waterfield T, Eds.). World Meteorological Organization, Geneva, Switzerland, 32 pp.
King AD, Harrington LJ. 2018. The inequality of climate change from 1.5 to 2 ºC of global warming. Geo-physical Research Letters 45, 5030-5033. https://doi. org/10.1029/2018GL078430
Kohavi R. 1995. A study of cross-validation and boot-strap for accuracy estimation and model selection. In: Proceedings of the International Joint Conference on Articial Intelligence, vol. 14. Montreal, Canada. 1137-1145.
Lipper L, Thornton P, Campbell BM, Baedeker T, Braimoh A, Bwalya M, et al. 2014. Climate-smart agriculture for food security. Nature Climate Change 4, 1068. https:// doi.org/10.1038/nclimate2437
Lobell DB and Ortiz-Monasterio JI. 2007. Impacts of day versus night temperatures on spring wheat yields. Agronomy Journal 99, 469-477. https://doi. org/10.2134/agronj2006.0209
Lobell DB and Gourdji SM. 2012. The influence of climate change on global crop productivity. Plant Physiology 160, 1686-1697. https://doi.org/10.1104/ pp.112.208298
Maldonado-Ibarra, Rodríguez G, Dalma C-R. 2015. Deter-mination of genetic coefficients of three spring wheat varieties under a Mediterranean environment applying the DSSAT model. Chilean Journal of Agricultural Research 75, 418-424. https://doi.org/10.4067/S0718-58392015000500006
Meier L, van de Geer S, Bühlmann P. 2008. The group lasso for logistic regression. Journal of the Royal Statistical Society: Series B 70, 53-71. https://doi. org/10.1111/j.1467-9868.2007.00627.x
Miller RO, Kissel DE. 2010. Saturation percentage. Soil Science Society of America Journal 74, 310-316. https://doi.org/10.2136/sssaj2008.0047
Mitchell D, Achuta-Rao K, Allen M, Bethke I, Beyerle U, Ciavarella A, et al. 2017. Half a degree additional warming, prognosis and projected impacts (HAPPI): Background and experimental design. Geoscien-tific Model Development 10, 571-583. https://doi. org/10.5194/gmd-10-571-2017
Moorhead A. 2009. Climate, agriculture and food se-curity: A strategy for change. Consultative Group on International Agricultural Research (CGIAR). Available at: http://ccafs. cgiar.org/sites/default/files/ pdf/CC_for_COP15_Final_LR_2.pdf (las accessed on December 31, 2019).
Mudasser M, Hussain I, Aslam M. 2001. Constraints to land-and water productivity of wheat in india and pakistan: A comparative analysis. International Water Management, Colombo, Sri Lanka.
model evaluation: Benchmarking, skills, deficiencies and implications. Geoscientific Model Development Discussions 10, 1403-1422. https://doi.org/10.5194/ gmd-10-1403-2017
Neale RB, Chen C-C, Gettelman A, Lauritzen PH, Park S, Williamson DL, et al. 2010. Description of the NCAR community atmosphere model (CAM 5.0). NCAR Technical Note NCAR/TN-486+ STR 1, 1-12. National Center for Atmospheric Research, 274 pp.
Rahman MH, Ahmad A, Wang X, Wajid A, Nasim W, Hussain M, et al. 2018. Multi-model projections of future climate and climate change impacts uncertainty assessment for cotton production in Pakistan. Agricul-tural and Forest Meteorology 253, 94-113. https://doi. org/10.1016/j.agrformet.2018.02.008
Reid S, Tibshirani R, Friedman J. 2016. A study of error variance estimation in lasso regression. Statistica Sinica 26, 35-67. https://doi.org/10.5705/ss.2014.042 Robertson MJ, Carberry PS, Huth NI, Turpin JE, Probert
ME, Poulton PL, et al. 2002. Simulation of growth and development of diverse legume species in APSIM. Australian Journal of Agricultural Research 53, 429-446. https://doi.org/10.1071/AR01106
Rogelj J, Den Elzen M, Höhne N, Fransen T, Fekete H, Winkler H, et al. 2016. Paris Agreement climate pro-posals need a boost to keep warming well below 2 ºC. Nature 534, 631. https://doi.org/10.1038/nature18307 Rosenzweig C, Elliott J, Deryng D, Ruane AC, Müller C,
Arneth A, et al. 2014. Assessing agricultural risks of climate change in the 21st century in a global gridded crop model intercomparison. Proceedings of the Na-tional Academy of Sciences 111, 3268-3273. https:// doi.org/10.1073/pnas.1222463110
Shiogama H, Watanabe M, Imada Y, Mori M, Kamae Y, Ishii M, Kimoto M. 2014. Attribution of the June-July 2013 heat wave in the southwestern United States. The Scientific Online Letters on the Atmosphere 10, 122-126. https://doi.org/10.2151/sola.2014-025
Sonia S, Sadozai KN, Khan NP, Jan AU, and Hameed G. 2019. Assessing the impact of climate change on
wheat productivity in Khyber Pakhtunkhwa, Pakistan. Sarhad Journal of Agriculture 35, 284-292. https://doi. org/10.17582/journal.sja/2019/35.1.284.292
Stevens B, Giorgetta M, Esch M, Mauritsen T, Crueger T, Rast S, et al. 2013. Atmospheric component of the MPI-M earth system model: ECHAM6. Journal of Advances in Modeling Earth Systems 5, 146-172. https://doi.org/10.1002/jame.20015
Trenberth KE. 2011. Changes in precipitation with climate change. Climate Research 47, 123-138. https://doi. org/10.1002/jame.20015
Ullah A, Ahmad I, Ahmad A, Khaliq T, Saeed U, Habib-ur-Rahman M, et al. 2019a. Assessing climate change impacts on pearl millet under arid and semi-arid envi-ronments using CSM-CERES-Millet model. Environ-mental Science and Pollution Research 26, 6745-6757. https://doi.org/10.1007/s11356-018-3925-7
Ullah A, Ahmad I, Saeed U, Ahmad A, Mahmood A, Hoogenboom G. 2019b. Climate smart interventions of small-holder farming systems. In: Climate Change and Agriculture (Hussain S, Ed.). IntechOpen, 1-16. Vanli Ö, Ustundag BB, Ahmad I, Hernández-Ochoa
IM, Hoogenboom G. 2019. Using crop modeling to evaluate the impacts of climate change on wheat in southeastern turkey. Environmental Science and Pollution Research 33, 1-12. https://doi.org/10.1007/ s11356-019-06061-6
Wheeler TR, Hong DT, H. Ellis R, R. Batts G, Morison J, Hadley P. 1996. The duration and rate of grain growth, and harvest index, of wheat (Triticum aestivum L.) in response to temperature and CO2. Journal of Exper-imental Botany 47, 623-630 https://doi.org/10.1093/ jxb/47.5.623