6
I
January 2018
Use of Data Mining Techniques to Improve the
Effectiveness of Sales and Marketing
K.Biruntha1, R.Porkodi2 1
PG Student, Department of computer science, Bharathiar University, Coimbatore.
2
Assistant professor, Department of computer science, Bharathiar University, Coimbatore.
Abstract: Clustering is the task of grouping a set of objects in the same group that are more similar to each other than to those in other groups. The data mining in sales and marketing helps businesses to promote their most profitable products and maximize the profit. This paper presents the study and analysis of four clustering algorithms that is Density Based clustering, Canopy, Farthest First and Hierarchical Clustering by using Wholesale Customer dataset. The performances of these algorithms are compared using the performance evaluation metrics such as Time taken to build, Number of cluster, and Number of cluster instances. The experimental results show that Hierarchical Clustering, and Farthest First produce better result than Make Density based and Canopy.
Keywords: Clustering, Hierarchical Clustering, Make Density Based clustering, Canopy, Farthest First
I. INTRODUCTION
Data mining is the set of large data methods the intersection of machine learning, statistics, and database systems and it’s also a computing process. The intelligent methods are applied to extract data patterns by an essential process [1]. The overall goal of the data mining process is to extract information from a data set and transform it into an understandable structure for further use. Data mining is the analysis step of the "Knowledge Discovery in Databases" process, or KDD [2].In this paper implementing Clustering algorithms, the grouping of a particular set of objects is called clustering and it is based on their characteristics, aggregating them according to their similarities. Regarding to data mining, this methodology partitions the data implementing a specific join algorithm, most suitable for the desired information analysis. There are different major data mining techniques have been developing and using in data mining projects recently including association, classification, clustering, prediction, sequential patterns and decision tree. In this paper using only the clustering [3]. Constraint-based Method: In this method, the clustering is performed by the incorporation of user or application-oriented constraints. A constraint refers to the user expectation or the properties of desired clustering results. Clustering is the task of grouping objects in such a way that objects in the same group (called a cluster) are more similar (in some sense or another) to each other than to those in other groups (clusters) [4]. It can be achieved by various algorithms that differ significantly in their notion of what constitutes a cluster and how to efficiently find them. Popular notions of clusters include groups with small distances among the cluster members, dense areas of the data space, intervals or particular statistical distributions [5].
The section I discuss about the introduction of data mining and the clustering algorithm. Section II gives the analysis about literature survey. Section III explains the methods that are used clustering algorithms. The result and discussion are explained in section IV. Section V concludes this analysis work.
II. LITERATURE REVIEW
DR. YASHPAL SINGH, ALOK SINGH CHAUHAN (2005) presented a paper on clustering algorithms such as Neural Network Clustering, Regression, and Decision Trees. They proposed the Back Propagation Algorithm suited for large dataset and produced accurate result as compared to other algorithm [6].
Dr. Sankar Rajagopal (2011) proposed a paper on technique using I-miner customer clustering. The final result of this paper to demonstrate that the proposed approach revealed the high value customer [7].
Mythili S, Madhiya E (2014) presented a paper on the study of various algorithms. They discussed the various types of algorithms such k-means clustering algorithm, etc., and analyses the advantages and shortcomings of the algorithms [8].
proposed the Sequential Meta-Analysis (SMA), an approach aimed to find significant gene expression signatures by merging multiple microarray studies in chronological order, avoiding type I errors [9].
T. Balasubramanian, R.Umarani (2012) presented a paper on data mining techniques in health care. This paper identifies the risk factors associated with the high level of fluoride content in water, using k-means, and finds meaningful hidden patterns which gives meaningful decision making to this socio-economic real world health hazard [10].
Konstantinos Rematas et.al (2015) proposed a paper on dataset fingerprints, a new and powerful method based on data mining that extracts meaningful patterns from a set of images. This paper they proposed a novel way of summarizing and browsing an image collection [11].
Amit Gupta et.al (2015)reviewed on explores the applications of data mining clustering techniques. The clustering has been applied many fields such as Healthcare, Retailing, Financial/Banking and etc. [12].
Sam Fletcher et.al (2015) proposed a paper on techniques have been developed to measure the information quality of a dataset by using Anonymization techniques. Clustering techniques was mainly used for measurement analysis of quality information [13]. Babu C Lakshmanan et.al (2015) proposed the new methodology was based on clustering and classification that classifies the success rate of Tuberculosis treatment. The Two Step clustering (TSC) used to group data into different and assigned classes based on age and weight [14].
Aditya Joshi et.al (2015) presented a paper by using clustering and association mining approach is used to classify stock data and find associated patterns. From the experimental results it is clear that the approach is very efficient for mining patterns of huge stock data and predicting the factors affecting the sale of products [15].
III. METHODOLOGY
The proposed research methodology consists of three phases as shown in Fig.1. The first phase is pre-processing. The second phase is clustering in data mining in which four algorithms namely Make density based, Hierarchical clustering, Farthest First Clustering, and canopy are used. The last phase is used to evaluate the performance of clustering algorithms using different evaluation metrics.
Fig.1 Methodology
The proposed research methodology consists of three phases as shown in Fig.1. The first phase is pre-processing. The second phase is clustering in data mining in which four algorithms namely Make density based, Hierarchical clustering, Farthest First Clustering, and canopy are used. The last phase is used to evaluate the performance of clustering algorithms using different evaluation metrics.
A. Clustering Algorithms
1) Well-Separated Clusters: A cluster is a set of points such that any point in a cluster is closer (or more similar) to every other point in the cluster than to any point not in the cluster.
2) Center-Based:- An object is more close to or similar to the cluster in which it resides then the other clusters then it is called as center-based cluster.
3) Contiguous Cluster: A cluster is a set of points such that a point in a cluster is closer (or more similar) to one or more other points in the cluster than to any point not in the cluster.
4) Density based Cluster: A cluster is a dense region of points, which is separated by low-density regions, from other regions of high density. This type of cluster used only when the clusters are irregular or intertwined and when noise and outliers are present [16].There are many algorithms for clustering in data mining in which four clustering algorithms Hierarchical, Density Based clustering, Canopy, and Farthest First are chosen for experimental study that explained in next paragraphs.
5) Make Density Based Clustering Algorithm: Density based clustering algorithm has played a vital role in finding non-linear shapes structure based on the density. Density-based spatial clustering of applications with noise (dbscan) is most widely used density based algorithm. It uses the concept of density reach-ability and density connectivity [17].
6) Farthest-First: The farthest-first traversal of a bounded metric space is a sequence of points in the space, where the first point is selected arbitrarily and each successive point is as far as possible from the set of previously-selected points. The same concept can also be applied to a finite set of geometric points, by restricting the selected points to belong to the set or equivalently by considering the finite metric space generated by these points. For a finite metric space or finite set of geometric points, the resulting sequence forms a permutation of the points, known as the greedy permutation [18].
7) Canopy: The canopy clustering algorithm is an unsupervised pre clustering algorithm introduced by Andrew McCallum, Kamal Nigam and Lyle Unger in 2000. It is often used as pre-processing step for the K-means algorithm or the Hierarchical clustering algorithm. It is intended to speed up clustering operations on large data sets, where using another algorithm directly may be impractical due to the size of the data set. The number of instances of training data that must be compared at each step is reduced. There is some evidence that the resulting clusters are improved [19].
8) Hierarchical: Agglomerative Hierarchical clustering - This algorithm works by grouping the data one by one on the basis of the nearest distance measure of all the pair wise distance between the data point. Again distance between the data point is recalculated but which distance to consider when the groups has been formed [20].
IV. RESULTS AND DISCUSSION
A. Dataset Description
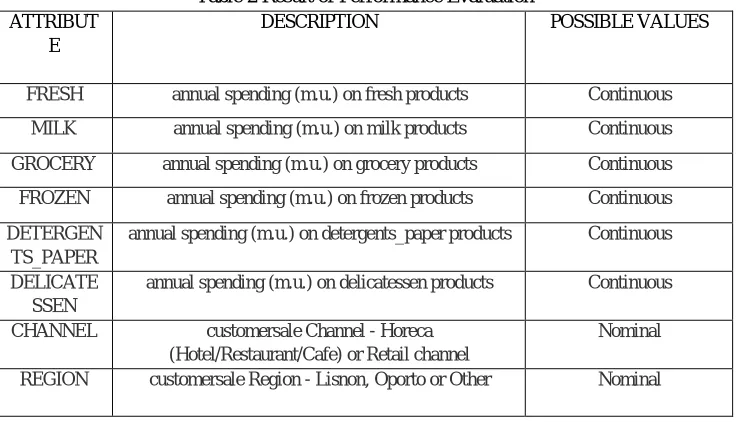
[image:4.612.124.492.521.732.2]The Tabel1 contains the Wholesale customer dataset [21].Wholesale customer dataset having 8 attributes from the Wholesale data are considered for the retail shop required for the category of products. The following attributes with nominal values are considered: fresh, milk, grocery, frozen, detergents paper, delicatessen, channel, and region.
Table 2 Result of Performance Evaluation ATTRIBUT
E
DESCRIPTION POSSIBLE VALUES
FRESH annual spending (m.u.) on fresh products Continuous
MILK annual spending (m.u.) on milk products Continuous
GROCERY annual spending (m.u.) on grocery products Continuous
FROZEN annual spending (m.u.) on frozen products Continuous
DETERGEN TS_PAPER
annual spending (m.u.) on detergents_paper products Continuous
DELICATE SSEN
annual spending (m.u.) on delicatessen products Continuous
CHANNEL customersale Channel - Horeca
(Hotel/Restaurant/Cafe) or Retail channel
Nominal
B. Result of Clustering Algorithms
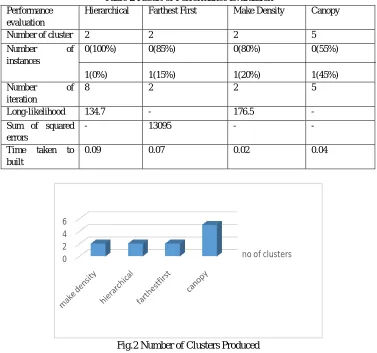
[image:5.612.118.495.139.492.2]The Table 2 shows the result of performance evaluation of the clustering algorithms namely Hierarchical, Density Based clustering, Canopy, and Farthest First.
Table 2 Result of Performance Evaluation Performance
evaluation
Hierarchical Farthest First Make Density Canopy
Number of cluster 2 2 2 5
Number of
instances 0(100%) 1(0%) 0(85%) 1(15%) 0(80%) 1(20%) 0(55%) 1(45%)
Number of
iteration
8 2 2 5
Long-likelihood 134.7 - 176.5 -
Sum of squared errors
- 13095 - -
Time taken to
built
0.09 0.07 0.02 0.04
Fig.2 Number of Clusters Produced
[image:5.612.192.457.545.713.2]The Fig.2 shows the number of clusters grouped between different algorithms. The Canopy algorithm grouped into 5 clusters and remaining algorithms mostly grouped into 2 clusters. The canopy algorithm would be grouping into cluster slightly different from remaining algorithms.
Fig.3 Number of Iterations Taken no of clusters 0
2 4 6
no of iterations 0
The Fig.3 shows the numbers of iterations performed for grouping the cluster between different algorithms. Here Hierarchical algorithm takes more iteration for grouping the cluster as compare to different algorithms. The remaining algorithms take similar number of iterations for grouping the cluster.
Fig.4 Time Taken to Build Clusters
The Fig.4 shows the time taken for building the clusters between different algorithms. The Hierarchical clustering algorithm taken more time to build compared to remaining algorithms.
The four clustering algorithms have been validated using the important metrics as shown in Table 2 and same as depicted in Fig.2, Fig.3 and Fig.4. The result shows that Hierarchical, farthest first and gives better accuracy result than density based algorithm and canopy algorithm.
V. CONCLUSION
Sales and marketing helps in planning launching new marketing campaigns in prompt and cost effective way. In sum, data mining in marketing is very helpful because business owners can able to summarize and analyse to discover useful information. They have capability to increase the profit and reduce the cost of products. Collecting data gives business firms a lot of good things, such as increased profits, keeping company in competition with other companies, and streaming outreach between consumer and companies.
This paper implementing four algorithms canopy, hierarchical, make density based and Farthest First. By grouping the products into clusters, the maximum number of products that are being saled and marketized is observed in high ratio by using hierarchical clustering algorithm in which the output is resulted 100%. The second phase of algorithm is canopy and their result is 54%. The third phase of algorithm is make density based algorithm its results Is 80%. The last phase is Farthes First algorithm this algorithm produce the result is 85%.
REFERENCES [1] Cluster%20analysis%20-%20Wikipedia.htm
[2] Matt Hartely “Using Data Mining to predice inventory levels” IEEE, 2005 7. D [3] Data%20Clustering%20Algorithms.htm
[4] DR. YASHPAL SINGH, ALOK SINGH CHAUHAN, ” NEURAL NETWORKS IN DATA MINING”, Journal of Theoretical and Applied Information Technology
[5] Dr.SankarRajagopal, ” CUSTOMER DATA CLUSTERING USING DATA MINING TECHNIQUE”, International Journal of Database Management Systems ( IJDMS ) Vol.3, No.4, November 201
[6] Mythili S, Madhiya E,” An Analysis on Clustering Algorithms in Data Mining”,Mythili S et al, International Journal of Computer Science and Mobile Computing, Vol.3 Issue.1, January- 2014, pg. 334-340
[7] Spampinato AG and Cavallaro S,” Meta-Analysis of Genomic Data: Between Strengths, Weaknesses and New Perspective”,International Journal of Biomedical Data Mining
[8] T.Balasubramanian, R.Umarani,” Clustering as a Data Mining Technique in Health Hazards of High levels of Fluoride in Potable Water”, (IJACSA) International Journal of Advanced Computer Science and Applications, Vol. 3, No.2, 2012.
time taken 0
[9] KonstantinosRematas, Basura Fernando, Frank Dellaert, and TinneTuytelaars,” Dataset Fingerprints: Exploring Image Collections Through Data Mining”, cvpr2015
[10] Amit Gupta, Ritul Kumar, and Manish Mittal,” DATA MINING AND ITS APPLICATIONS FOR KNOWLEDGE MANAGEMENT”, International Journal of Electrical and Electronic Engineering &Telecommunications.
[11] Sam Fletcher and MdZahidul Islam,” Measuring Information Quality for Privacy Preserving Data Mining”, International Journal of Computer Theory and Engineering, Vol. 7, No. 1, February 2015
[12] Babu C Lakshmanan, ValarmathiSrinivasan, ChinnaiyanPonnuraja,” Data Mining with Decision Tree to Evaluate the Pattern on Effectiveness of Treatment for Pulmonary Tuberculosis: A Clustering and Classification Techniques”, Scientific Research Journal (SCIRJ), Volume III, Issue VI, June 2015 43 ISSN 2201-2796
[13] Aditya Joshi, NidhiPandey, (Professor) RashmiChawla, Pratik Patil,” Use of Data Mining Techniques to Improve the Effectiveness of Sales and Marketing”, International Journal of Computer Science and Mobile Computing, Vol.4 Issue.4, April- 2015, pg. 81-87
[14] What%20is%20Clustering%20in%20Data%20Mining%20.html [15] Density-based%20clustering.html
[16] Farthest-first%20traversal%20 %20wikipedia.html [17] Canopy%20clustering%20algorithm%20-%20wikipedia.htm