PROCESSES CONTROLLING THE FATE AND
TRANSPORT OF TRACE METALS IN THE SUBSURFACE
DURING CHANGING REDOX POTENTIAL
Thesis by
Claire Farnsworth
In Partial Fulfillment of the Requirements
for the Degree of
Doctor of Philosophy
CALIFORNIA INSTITUTE OF TECHNOLOGY
Pasadena, California
2011
ii
© 2011
iii
Acknowledgements
First and foremost, I must thank Janet Hering, my advisor. I’m especially grateful for her editorial standards, financial and personal support, career guidance, and her invitation to move to Eawag. I attribute much of my personal growth over the course of my graduate work either directly or indirectly to Janet.
Jess Adkins, Michael Hoffmann, and Victoria Orphan have been supportive committee members from afar. Jim Morgan pointed me in the right direction towards some key papers and concepts early in my graduate work.
Rich Wildman became my unofficial graduate school mentor. From the shores of Lake Powell to the shores of Greifensee, Rich’s enthusiasm and unwavering support gave me confidence and kept me going in the tough times. I thank both Rich and his wife, Zena Harris, for being my “training wheels” in Zürich. Vanessa Sternitzke listened to far more details of uncooperative Mn-oxidizing bacteria than any person should have to and made sure that I saw a bit of Switzerland as long as I was there. I would not have survived this Ph.D. without her patient friendship and our hiking adventures. Kate Campbell introduced me to gels and manganese in the lab. The consummate professional, it took me a couple of months to realize that she didn’t already know the results of my doped-gel experiments.
iv
beim Tegeler See. Sarah Griffis worked hard and asked good questions, besides getting in Lake Tegel on a cold day in July. I’m grateful to my microbiologist collaborators: Dianne Newman’s group at Caltech, especially Alexa Price-Whelan and Yun Wang; Colleen Hansel’s group at Harvard, especially Derek Learman and Cara Santelli; and Frederik Hammes, Hans-Ulrich Weilenmann, Karin Lautenschlager, and Johannes Wolf at Eawag. Andreas Voegelin performed all XAS sampling and analysis, and maintained good spirits throughout the long hours at the beamline.
Stephan Hug kindly let me be an unofficial member of his research group at Eawag. Edi Hoehn spent a full morning discussing bank filtration with me at the original Glattfelden site, and suggested collaboration with Gudrun Massmann. Peggy O’Day, Lars Maechler, and Matthias Brennwald had some key input in the initial design of my column experiments. Linda Roberts, Helen Rowland, Benoit Pernet-Codrier, Lenny Winkel, and Christine Wenk offered helpful discussions and friendship at Eawag. Megan Ferguson, Arthur Fitzmaurice, Azra Bilgin, Tom He, Diana Stefanescu, and Tao Cheng created a pleasant working group at Caltech. Maria Luisa Ruiz-Ripoll, Cristina Mojica, Yvonne Chen, and Katie Cychosz have provided six years’ worth of graduate school sympathy and career advice. I’m grateful for Kathleen Wyss-Shore’s professional guidance when I most needed it.
v
with general hypotheses to be tested rather than explicit laboratory instructions, gave me my first taste in designing and executing chemistry experiments.
vi
Abstract
This study investigated the cycling of Mn and Fe as oxic surface water entered shallow sediments and was reduced, and as reduced groundwater became exposed to oxygen and was oxidized. A Mn-oxide doped gel probe sampler was developed to study in situ rates of reductive dissolution and was validated with laboratory studies with ascorbic acid and Shewanella oneidensis MR-1 as model reductants. The sampler was deployed in the bank sediments of Lake Tegel, Berlin, Germany. Modeling of the diffusion-controlled reaction converted the mass loss from the gels in the sampler to a profile of pseudo-first-order rate constants as a function of depth. The rate constants were highest at depths with high dissolved Fe and low operationally defined fractions of reducible oxides of Fe and Mn in the sediments.
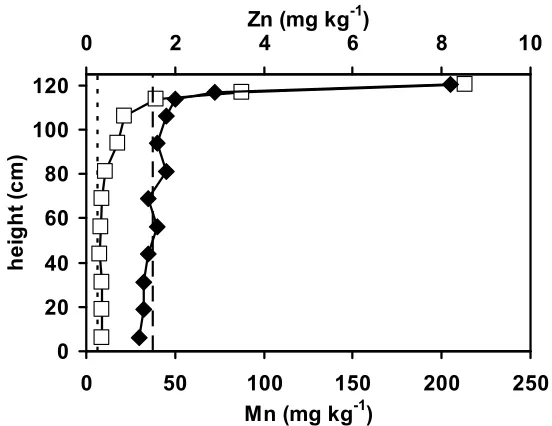
A laboratory column experiment showed that 1.3-m water table fluctuations, as observed in bank filtration sites around Berlin, were able to provide sufficient dissolved oxygen delivery for Pseudomonas putida GB-1, an obligate aerobe, to oxidize Mn(II) in situ. Accumulation of Mn on the quartz sand in the column at the end of the experiment was limited to the top 60 cm, as measured with X-ray fluorescence (XRF), and X-ray absorption spectroscopy (XAS) analysis confirmed that the solid formed was a Mn(IV) oxide characteristic of biogenic origin. After a period of “filter ripening” in the column, rates of in situ oxidation were still lower than rates in engineered aerated sand filters.
vii
viii
TABLE OF CONTENTS
Acknowledgements ... iii
Abstract ... vi
Table of Contents ... viii
List of Figures ...x
List of Tables ... xiii Chapter 1: Introduction ... 1-1 Chapter 2: Inorganic Geochemistry and Redox Dynamics in
Bank Filtration Settings ... 2-1
Abstract ... 2-1 Introduction ... 2-2
Geochemistry of Bank Filtration ... 2-6 Reduction near the bank ... 2-9 Oxidation near the production well ... 2-12 Dissolution of carbonate minerals in the aquifer ... 2-15 Sorption in the aquifer ... 2-19
Chapter 3: A Hydrous Manganese Oxide Doped Gel Probe Sampler for Measuring In Situ Reductive Dissolution Rates: I. Laboratory Development ... 3-1
Abstract ... 3-1 Introduction ... 3-2 Experimental Section ... 3-4 Results ... 3-11 Discussion ... 3-16 Acknowledgements ... 3-21
Chapter 4: A Hydrous Manganese Oxide Doped Gel Probe Sampler for Measuring In Situ Reductive Dissolution Rates: II. Field Deployment ... 4-1
Abstract ... 4-1 Introduction ... 4-2
Materials and Methods ... 4-4 Results ... 4-10 Discussion ... 4-15 Acknowledgements ... 4-21
ix
Introduction ... 5-2 Experimental Section ... 5-3
Results and Discussion ... 5-10 Acknowledgements ... 5-21
Chapter 6: Mn and Fe Dynamics in the Shallow Groundwater Adjacent to Lake Tegel, Berlin, Germany ... 6-1
Abstract ... 6-1 Introduction ... 6-2 Experimental Section ... 6-3
Results and Discussion ... 6-6 Acknowledgements ... 6-15
Chapter 7: Conclusions ... 7-1
Summary ... 7-1 In Situ Rates of Reductive Dissolution ... 7-1 Oxidizing Conditions Induced by Water Table Oscillations ... 7-5 Field Conditions Necessary for In Situ Mn and Fe Oxidation ... 7-6 Future Research in Inorganic Geochemistry Relevant to Bank
Filtration ... 7-7 Wider Implications ... 7-11
x
LIST OF FIGURES
Figure
Page
Number
2.1 Schematics of various types of managed aquifer recharge ... 2-4 2.2 Profile of geochemical changes along a natural and bank
filtration flow path ... 2-7 2.3 pe-pH predominance plot for Fe and Mn under typical pH and
redox conditions for groundwater ... 2-9 2.4 Soluble metal concentrations in equilibrium with calcite and
metal carbonates ... 2-18
3.1 Integrated expression for the rate of Mn release as a function of
time at pH 8.0 ... 3-13 3.2 1-D model output of Mn(II) accumulation in the bulk solution ... 3-16
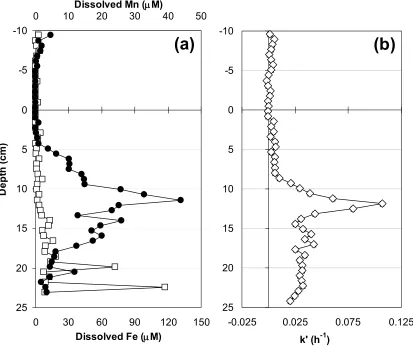
4.1 Location of sampling site at Lake Tegel ... 4-5 4.2 Porewater concentrations of dissolved Mn and Fe and apparent
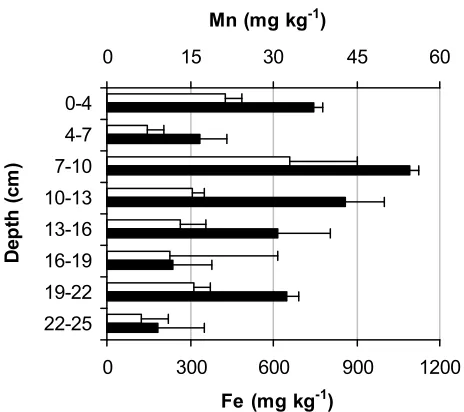
pseudo-first-order rate coefficient k′ ... 4-12 4.3 Total extracted Mn and Fe from sediment cores in sequential
extraction ... 4-13 4.4 Mn and Fe concentrations measured in sediments, expressed as
percentage of the total elemental concentration recovered in all
5 sequential extraction steps ... 4-14
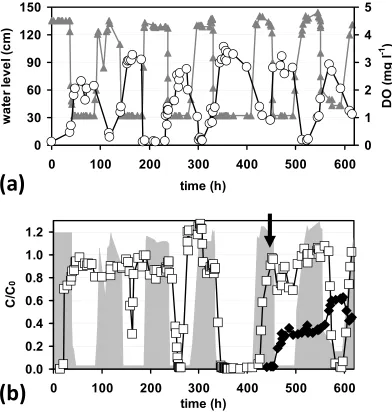
5.1 Changes in the visible water level in the column, the effluent dissolved oxygen, and filtered relative effluent concentrations
of Mn and Zn over time ... 5-11 5.2 XRF profile of Mn and Zn along the column at the end of the
experiment... 5-15
6.1 Map of sampling locations and bank filtration well galleries at
Lake Tegel ... 6-4 6.2 XRF concentrations of Mn and Fe as a function of depth in the
xi
6.4 Mn K-edge XANES spectra of Lake Tegel aquifer samples
from different depths compared to reference spectra ... 6-11 6.5 Fe K-edge XANES and EXAFS spectra of Lake Tegel aquifer
samples from different depths compared to reference spectra ... 6-12
A.1 X-ray diffractogram for synthesized HMO ... A-2 A.2 AQUASIM model output for the reaction of ascorbate and
HMO-doped gels in gels ... A-7 A.3 AQUASIM model output for the reaction of ascorbate and
HMO-doped gels in a miniprobe ... A-8 A.4 AQUASIM model output for the reaction of S. oneidensis
MR-1 and HMO-doped gels in solution ... A-9 A.5 AQUASIM model output for the reaction of S. oneidensis
MR-1 and HMO-doped gels in a miniprobe ... A-MR-10 A.6 Theoretical behavior of Mn reduction in an HMO-doped gel,
in the absence of diffusion ... A-11 A.7 Rate estimates as a function of time for the reaction of S.
oneidensis MR-1 and HMO-doped gels in miniprobes ... A-12 A.8 Comparison of Mn concentrations measured in clear gels
deployed in the same probe as HMO-doped gels and in a
separate gel probe 85 cm away ... A-13
B.1 Moles of HMO lost in each gel per s of deployment time ...B-4 B.2 Extracted Mn and Fe concentrations per kg dry sediment, as
determined by sequential extraction ...B-5 B.3 Particle size in Lake Tegel shoreline sediment ...B-5 B.4 Dissolved Mn and Mn oxide inside of a gel, as calculated by
the Matlab m-file “ksolver” ...B-10 B.5 Apparent pseudo-first-order rate coefficient k′ from
HMO-doped gel probe deployed 20 m from the shoreline of Lake
Tegel, Berlin, Germany ...B-11 B.6 Apparent pseudo-first-order rate coefficient k′ from
HMO-doped gel probe deployed at Laguna Figueroa salt flats, Baja
California, Mexico ...B-12
xii
C.3 Mn XANES and EXAFS spectra at the top of the sand column ...C-5 C.4 XRF profile of P at the end of the experiment ...C-7 C.5 Mass balance for unreacted gels and batches at the end of the
xiii
LIST OF TABLES
Table
Page
Number
3.1 Summary of linear regression data for laboratory-measured
rates of reductive dissolution ... 3-14 3.2 Summary of literature values for Mn oxide reduction by S.
oneidensis MR-1 ... 3-19
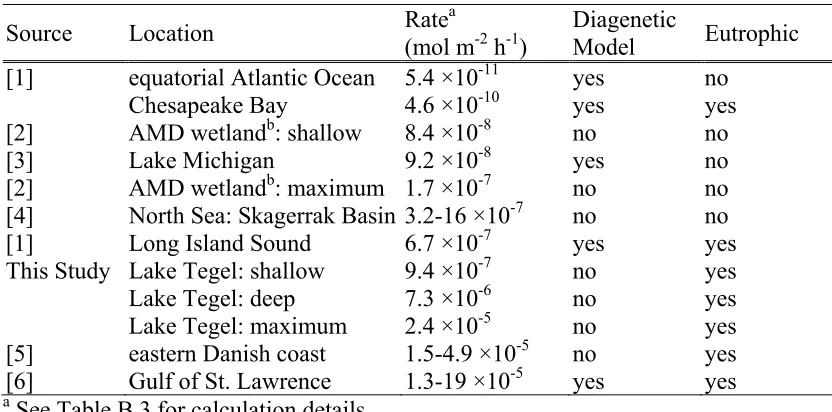
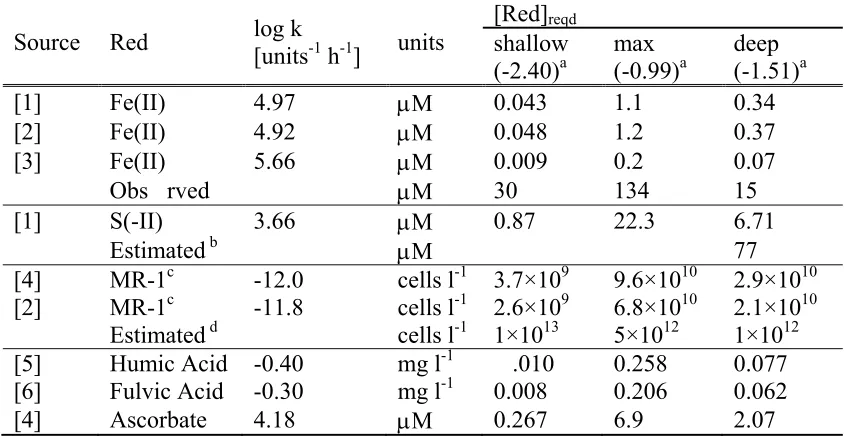
4.1 Experimental conditions for sequential extraction ... 4-10 4.2 Surface-area-normalized Mn reduction rates from field studies ... 4-17 4.3 Summary of literature values for Mn oxide reduction rate
coefficients ... 4-19
5.1 Mn removal parameters for each water table oscillation ... 5-12 5.2 Potential rates of Mn oxidation and reduction in the column ... 5-18
6.1 Composition of artificial groundwater for sorption experiments ... 6-6 6.2 Average groundwater composition in production well 18 ... 6-10
A.1 Final mass balance in abiotic miniprobe reductive dissolution
experiments ... A-2 A.2 Basic components of MR-1 minimal medium ... A-3 A.3 Parameters input to or solved by AQUASIM model ... A-4 A.4 AQUASIM mass balance at steady state ... A-5 A.5 [Mn(II)] release over time ... A-6 A.6 Bias of clear gels co-located in the same miniprobe as
HMO-doped gels ... A-13
B.1 Lake Tegel sediment characterization ...B-3 B.2 Porewater concentrations of detectable trace elements ...B-4 B.3 Calculation of surface-area-normalized Mn reduction rates
from field studies ...B-6 B.4 Gel probe data input to Matlab m-file “ksolver” and output k′
xiv
B.5 Sequential extraction fractions of Mn (mg kg-1) ...B-14 B.6 Sequential extraction fractions of Fe (mg kg-1) ...B-14
C.1 Results of oxidation assays at the end of the column
experiment...C-2 C.2 Linear combination fit results for Mn XANES and EXAFS
spectra at the top of the sand column ...C-6 C.3 Pseudo-first-order rate coefficients for Mn oxide reduction and
OD600 during the reduction assay ...C-7 C.4 Observed levels of water table during experiment ...C-12 C.5 Dissolved oxygen concentrations in the column effluent ...C-13 C.6 pH values in the column effluent ...C-14 C.7 Mn C/C0 values in the column effluent ...C-15 C.8 Zn C/C0 values in the column effluent ...C-16 C.9 XRF concentrations of Mn and Zn in the column at the end of
1-1
Chapter 1
Introduction
Population growth and expansion of irrigated agriculture put increasing demands on
current water resources management. Combined with anticipated increases in the
frequency and intensity of drought and precipitation due to climate change, these
pressures may render existing surface water storage insufficient (Barnett and Pierce
2008), if not impractical in arid and semi-arid areas subject to lower streamflows and
excessive evaporation (Gleick 2002, Brikowski 2008). Alternative water resources
management, if able to take advantage of water reuse and to reduce the capital- and
energy-intensity of water treatment, promises to improve sustainability and reliability in
light of these pressures.
One form of alternative water resources management with a long history in
Europe is bank filtration. In this system, groundwater is extracted from a well adjacent to
a river or lake, thereby inducing infiltration from the surface water body into the shallow
groundwater. The natural processes along the infiltration flow path lead to nutrient,
organic carbon, and pathogen removal, thereby improving the quality of the water
recovered (Schwarzenbach et al. 1983, Dillon 2005). Active in some locations for more
than 100 years (Eckert and Irmscher 2006), current estimates suggest that 27 million
1-2
Switzerland, and the Netherlands rely on bank filtration for their drinking water supply
(Hiscock and Grischek 2002).
An operational limitation of bank filtration is the release of iron (Fe) and
manganese (Mn) as the infiltrating water passes from oxic to reducing conditions in the
river- or lake-bank. High concentrations of Fe and/or Mn often necessitate
post-extraction treatment in bank filtration sites in Germany (Massmann et al. 2008b), the
Netherlands (de Vet et al. 2010), and Canada (Petrunic et al. 2005). However,
re-introduction of dissolved oxygen to the shallow groundwater along the infiltration path
could potentially precipitate Fe and Mn oxides in situ. Furthermore, the stability of Fe
and Mn oxides is known to control the release of other trace metals in groundwater
(Davranche and Bollinger 2000). A bank filtration site in Berlin, Germany, with Fe and
Mn concentrations above WHO guidelines (5 M and 2 M, respectively) was selected
to study the processes controlling these two key trace metals in further detail.
Scope and Objectives
The objective of this research is to quantify the rates and mechanisms controlling Fe and
Mn behavior in bank filtration systems. Specifically, it will address the following
questions:
How do the rates of reductive dissolution, the predominant mobilization pathway
for Fe and Mn, vary with depth in the bank sediments?
Do water table fluctuations in the vicinity of the production wells provide
1-3
What ambient conditions lead to the presence or absence of significant in situ Mn
and Fe oxidation?
A critical review of the inorganic geochemistry of bank filtration systems, in light of the
relevant physical and transport processes, is presented in Chapter 2. This chapter, along
with an additional section in Chapter 7 on future research needs, has been submitted to
Environmental Science and Technology for publication. A Mn-oxide-doped gel probe sampler was developed to measure in situ rates of reductive dissolution in shallow (< 50
cm) sediments. The laboratory development of this method, including experiments with
model reductants (ascorbic acid and Shewanella oneidensis MR-1) and modeling to
account for diffusion, is presented in Chapter 3. Gel probes were deployed in the
sediments of Lake Tegel (Berlin, Germany) in July, and in Chapter 4, the subsequent
reductive dissolution rates were paired with sequential extraction of nearby sediment
cores to understand the relevant diagenetic processes in this setting. Chapters 3 and 4
were published as companion papers in Environmental Science and Technology in
January 2010.
Anoxic microbial medium was flowed through a quartz-sand-filled column
inoculated with Pseudomonas putida GB-1 (a well-characterized Mn oxidizing bacterium)
and subjected to 1.3 m water level changes every 30–50 h for 600 h. The frequency and
amplitude of the water level fluctuations, as well as the flow conditions, were designed to
simulate the conditions present in the shallow groundwater at the Lake Tegel bank
filtration site. Analysis of the Mn removal rates in the column and the solid-phase Mn at
the end of the experiment are detailed in Chapter 5. Aquifer sediments up to 25 m depth
1-4
Tegel. In Chapter 6, the results the solid-phase characterization for Mn and Fe are
discussed in terms of the general conditions necessary for in situ Mn and Fe
accumulations in bank filtration settings. Chapter 7 presents the conclusions of this work,
including further commentary on Chapters 3 and 4 in light of more recent publications,
and a section on future research needs in bank filtration settings. Additional field and
experimental data can be found in the appendices; data are organized such that
Appendices A, B, and C provide supporting information for Chapters 3, 4, and 5,
2-1
Chapter 2
Inorganic Geochemistry and Redox Dynamics in Bank
Filtration Settings
Abstract
2-2
Introduction
Anthropogenic pressure on existing water resources management is growing due to population growth and the expansion of irrigated agriculture and may be exacerbated by climate change. The frequency and intensity of both drought and precipitation are
anticipated to increase as a result of climate change; glaciers are already retreating. In the western U.S., observations over the past 50 years include more winter precipitation falling as rain instead of snow, earlier snow melt, and associated changes in riverflow, as well as drier summer conditions due to regional warming (Barnett et al. 2008). Major Asian river basins that depend on glacial melt water are also susceptible to altered, and eventually decreased, flows as glaciers retreat and disappear (Immerzeel et al. 2010). Episodic groundwater recharge may also be significantly impacted by changes in precipitation events (Eckhardt and Ulbrich 2003, Ng et al. 2010). Population growth continues in areas of limited water resources (NRC 2008, Vorosmarty et al. 2010), and overdraft of groundwater, both seasonal and year-round, is a more and more common problem (Wada et al. 2010). In some coastal areas, existing use of groundwater resources has had to be curtailed or modified due to saltwater intrusion (Jha and Peiffer 2005, Brown and Misut 2010). Expansion of irrigated agriculture to feed burgeoning populations will further stress limited water resources; northern China, for example, contains 65% of the country’s arable land, but only 18% of its water resources (Piao et al. 2010).
2-3
high levels of threat to water security if not for massive investments in water
infrastructure in developed countries (Vorosmarty et al. 2010). The lower Colorado River basin may already be in overdraft, as inflows have decreased to Lakes Powell and Mead while outflows from Glen Canyon and Hoover Dams continue at legally mandated rates (Barnett and Pierce 2008). Indeed, surface water storage may become impractical in arid and semi-arid areas due to lower streamflows and excessive evaporation (Bouwer 2002, Brikowski 2008). In addition, it is estimated that 1 billion people still lack access to safe drinking water, and in the developing world, the cost of building and maintaining conventional water and wastewater treatment can be prohibitive (Buros and Pyne 1994). Clearly, demand exists for more water management in the coming decades, but existing large-scale dam and irrigation projects may be unable to provide adequate water
resources under the increasing anthropogenic pressure (Gleick 2002). Therefore,
alternate water management schemes are necessary to take increasing advantage of water reuse and to reduce the capital- and energy-intensity of water treatment systems.
2-4
recovered from a down-gradient well and can, at early recovery times, include a substantial component of the native groundwater. Infiltration ponds are usually
constructed off-stream where surface water is diverted and allowed to infiltrate (generally through an unsaturated zone) to an underlying unconfined aquifer. In soil-aquifer
treatment (SAT), treated sewage effluent, or reclaimed water, is infiltrated intermittently through infiltration ponds to facilitate nutrient and pathogen removal in passage through the unsaturated zone for recovery by wells after residence in the aquifer. Bank filtration refers to extraction of groundwater from a well or caisson near or under a river or lake, which induces infiltration from the surface water body, thereby improving and making more consistent the quality of water recovered (NRC 2008).
Figure 2.1. Schematics of various types of managed aquifer recharge. Adapted from Dillon (2005). WWTP denotes a wastewater treatment plant.
2-5
organic carbon, and microbes, especially pathogens, present in the source water (Schwarzenbach et al. 1983). Recent research in bank filtration settings has focused extensively on understanding the processes behind effective pathogen removal (Castro and Tufenkji 2008, Metge et al. 2010, Toze et al. 2010) and on quantifying the removal of persistent organic micropollutants (Massmann et al. 2008a, Hoppe-Jones et al. 2010), both of which are critical to determine the post-extraction treatment required for bank filtrate to meet water quality standards. The effects of inorganic geochemical processes along the infiltration flow path on the quality of extracted bank filtrate have received much less attention, despite the observed exceedance of WHO drinking water guidelines for iron (Fe) of 0.3 mg l-1 or 5 M and manganese (Mn) of 0.1 mg l-1 or 2 M at various well fields in Canada (Thomas et al. 1994), Germany (Hässelbarth and Lüdemann 1972), and the Netherlands (de Vet et al. 2010). Although the treatment to remove Fe and Mn is relatively simple in practice (often aeration and sand filtration (de Vet et al. 2010)), the presence of these elements can lead to well screen clogging (van Beek 1984, van Beek et al. 2009) and can also indicate conditions where trace metals associated with Fe and Mn oxide solids are released along the flow path (von Gunten and Kull 1986). Thus, in situ
sequestration of Fe and Mn could potentially decrease both the risk of breakthrough of Fe, Mn, and any associated trace metals at the extraction well and the need for
post-extraction treatment. If the sequestration occurs at some distance from the well screen, this could also decrease the likelihood of well clogging.
2-6
can be significant for inorganic geochemistry and pathogen and organic micropollutant removal alike (von Gunten et al. 1991, Castro and Tufenkji 2008, Massmann et al. 2008b). This review presents the fundamental geochemical processes of bank filtration systems, with a focus on Fe and Mn, in light of relevant physical and transport processes.
Geochemistry of Bank Filtration
2-7
Figure 2.2. Profile of geochemical changes along a natural (a,b) and bank filtration (c,d) flow path. Dissolved oxygen levels are indicated by white (a,c), and oxidized Mn by dark grey (b,d). Arrows indicate the dominant mechanisms of reaeration: diffusion and rain infiltration under natural conditions and water table oscillations during bank filtration. The relative concentration profiles of dissolved inorganic carbon (DIC), dissolved organic carbon (DOC), and nitrate in bank filtration are shown in (e) after Bourg and Bertin (1993).
2-8
well’s cone of depression draws down the water table, sometimes as far as to the bank itself (Massmann and Sültenfuß 2008), and on-off cycles of the production well cause oscillations of the water table (Figure 2.2), which affects oxygen delivery to the infiltrate (Kohfahl et al. 2009). Bank filtration wells may additionally induce native groundwater, which would not normally interact with surface water, to mix with infiltrate in or near the production well. This can help dilute and buffer concentrations in the infiltrate (Schubert 2002), or it can lead to undesirable geochemical processes such as Fe or Mn precipitation in production well screens (van Beek et al. 2009).
Fe and Mn are used to illustrate the geochemical processes below. Briefly, Mn has three common oxidation states in the environment (+II, +III, and +IV), and Fe has two (+II and +III) (Figure 2.3). Fe(II) and Mn(II) are soluble at low-to-neutral pH, and precipitate as Fe(OH)2 (s) and Mn(OH)2 (s), respectively, at very alkaline pH values (e.g., higher than pH 9 in Figure 2.3). Depending on the carbonate concentrations, which can be elevated in the subsurface, Fe(II) and Mn(II) can precipitate as siderite (FeCO3) and rhodochrosite (MnCO3). Mn(III) and Mn(IV) are largely insoluble, found most
frequently in Mn oxides and oxyhydroxides such as birnessite
(K(Mn3+,Mn4+)2O4·1.5H2O), pyrolusite (MnO2), hausmannite (Mn3O4), and manganite (MnOOH) (Post 1999). Fe(III) is also largely found in insoluble oxides and
oxyhydroxides, which are stable under more reducing conditions than those of Mn(III/IV) (Figure 2.3). Reductive dissolution of Fe and Mn oxides is largely microbially mediated (Lovley 1991, Lloyd 2003), and oxidative precipitation of Fe(II) and Mn(II) can be as well (Corstjens et al. 1992, Tebo et al. 2004). Although kinetics of abiotic Fe(II)
2-9
pH 9 (Morgan 2005), with abiotic Mn oxidation orders of magnitude slower than
microbially Mn oxidation (Hastings and Emerson 1986, Davies and Morgan 1989, Luther 2005). Recent studies of microbially-mediated Mn oxidation have suggested that the majority of naturally-occurring environmental Mn oxides are derived either from direct biogenic Mn(II) oxidation or from the subsequent alteration of biogenic oxides (Tebo et al. 2004).
Figure 2.3. pe-pH predominance plot for (a) Fe (total = 10 μM) and (b) Mn (total = 10
μM) under typical pH and redox conditions for groundwater (CT = 10 mM). Dashed vertical lines show the (a) Fe2+/ FeCO3 (s) and (b) Mn2+/ MnCO3 (s) equilibria for (1) CT = 5 mM, MnT = FeT= 5 μM, and (2) CT = 1 mM, MnT = FeT= 1 μM. Concentration changes slightly expand the -MnOOH (s) and Mn3O4 (s) predominance areas to lower pe and pH (not shown).
Reduction near the bank
2-10
sufficient microbial activity to exhaust the supply of oxygen and often nitrate, leading to the reductive dissolution of Mn and Fe oxides (Berner 1980). Seasonal variation in the organic carbon load to the sediments correlates with the extent of reduction in the groundwater. Higher surface water temperatures in the summer lead to increased algal and phytoplankton growth, which yield higher summer loads of dissolved organic carbon. Secondary to these higher loads are increases in microbial respiration rate in the shallow sediments due to higher summer temperatures; this temperature signal is, however, damped as the infiltrate travels along the flow path (Greskowiak et al. 2006). These seasonal effects lead to a greater extent of reducing conditions as compared to the winter (von Gunten and Kull 1986, von Gunten et al. 1991, Bourg and Richard-Raymond 1994, Hoffmann and Gunkel 2011a). Solid organic carbon in the aquifer sediments can
additionally promote reduction of oxygen, nitrate, and Mn oxides further along the flow path (Kedziorek et al. 2008).
2-11
The increase of the biomass of microbes that actively oxidize organic carbon can negatively impact the hydrologic properties of a bank filtration system. Microbial overgrowth leads to a clogged layer, especially in settings that are relatively stagnant compared to riverbanks. The development of a clogged layer at the bottom of an artificial recharge pond in Berlin caused a decrease in infiltration rate of one order of magnitude, at which point the layer was mechanically removed (Greskowiak et al. 2005). In a more natural lake bank filtration setting, the clogging layer cannot be removed. At Lake Tegel in Berlin, long-term pore water velocities were the same order of magnitude as the minimum at the above artificial recharge pond (Hoffmann and Gunkel 2011b). A significant portion of the pore volume of the shallow sediments was filled with algae, which occurred at concentrations nearly 1000× that in the overlying lake water (Gunkel and Hoffmann 2005). Nevertheless, transport through the clogged sands at the lake margins accounts for the majority of the bank filtrate in this site, so this issue is not likely to be prohibitive.
2-12
et al. 2000, Ruebush et al. 2006). Mineralogy plays a key role in both the reactivity (Burdige et al. 1992, Ruebush et al. 2006) and the sorption capacity (Post 1999) of Fe and Mn oxides; more crystalline solids are less reactive and have lower sorption capacities.
When solid-phase oxides in the sediments are reductively dissolved, Fe and Mn are released to sediment porewater. High levels of dissolved Fe and Mn in bank filtrate can be problematic in and of themselves (Thomas et al. 1994, Petrunic et al. 2005), but both Mn and Fe oxides are major sinks for trace metals (Lovley 1991), and sorbed metals are released to solution during their reduction (Davranche and Bollinger 2000). This was observed for Cd, Cr, Cu, Pb, U, and Zn, as well as phosphate, at the Glatt River site (von Gunten and Kull 1986, Jacobs et al. 1988, von Gunten et al. 1991, Lienert et al. 1994). Subsequent reduction in the P concentration in sewage effluent, as required by
regulations, resulted in lower levels of eutrophication in the surface water of the Glatt, effectively decreasing the organic carbon load in both the river and the bank filtrate. The decreased organic carbon load no longer supported extensive Fe- and Mn-oxide reduction, and dissolved metal concentrations were no longer elevated (Lienert et al. 1994), which illustrates the direct and indirect impacts of the reductive dissolution of Fe and Mn oxides on the quality of bank filtrate.
Oxidation near the production well
2-13
entrapment due to water table oscillations (i.e., induced by intermittent production-well use). Modeling at Lake Wann (Berlin, Germany) clearly indicated that the dominant reaeration pathway was gas entrapment due to water table oscillations, once oscillations were greater than 0.5 m (Kohfahl et al. 2009). Laboratory studies predict dissolved gas saturation in excess of air equilibrium when gas bubbles are entrapped and collapse under sufficient water pressure; subsequent water table oscillations induce downward
propagation of this “excess air” (Williams and Oostrom 2000). Excess air has been observed in the shallow groundwater of Berlin’s bank filtration sites (Massmann and Sültenfuß 2008), in support of the laboratory and model results. The generalized dissolved oxygen profile for bank filtration sites in Figure 2.2c reflects the reaeration of bank filtrate as the production well is turned on and off, especially in the vicinity of the cone of depression. In the winter, lateral infiltration of oxic surface water through the banks is an additional reaeration pathway as the extent of the near-bank reducing zone is limited by lower organic carbon loads and lower microbial respiration rates and dissolved oxygen solubility is higher (von Gunten et al. 1991, Massmann et al. 2008b). Thus, reaeration of the infiltrate is heavily influenced by the production well pump operation, seasonal nutrient loads, and temperature.
2-14
of oxygen (Boogerd and de Vrind 1987, Morgan 2005), and can be assumed to be microbially mediated based upon the relative rates of abiotic and microbial oxidation (Morgan 2000). Despite its slow oxidation kinetics, dissolved Mn at the Lot River (France) displayed an inverse trend with dissolved oxygen in the wells along the flow path (Bourg and Bertin 1993, Bourg and Bertin 2002). However, breakthrough of elevated, dissolved Mn at an oxic production well could occur either because of slow oxidation kinetics or a nearby reduction hotspot (Bourg and Richard-Raymond 1994). Attempts to use Eh-based measurements or thermodynamic calculations to predict locations susceptible to elevated Mn have been very limited in their success (Kedziorek and Bourg 2009).
2-15
The location and extent of reaeration can significantly affect the water quality at production wells and their flow rates as a result of clogging. In one site at the Seine River (France), a thick clayey sand layer inhibited the reaeration of the bank filtrate, and the prolonged reducing conditions generated elevated ammonium concentrations in the production well (Doussan et al. 1998). Dutch well fields often clog due to well-screen mixing of mildly oxic shallow groundwater and anoxic deep groundwater with elevated dissolved iron (van Beek et al. 2009). Iron oxidation is not generally observed far from the production wells in these well fields, which suggests that the infiltrate is not as readily reaerated along the flow path as other sites, given the fast kinetics (Luther 2005) of iron oxide precipitation. Many wells across Germany also clog with microbial Fe and Mn oxide encrustations, which require regular removal to maintain well yield (Hässelbarth and Lüdemann 1972). Bank filtration adjacent to polder settings in both Germany
(Massmann et al. 2004) and the Netherlands (de Vet et al. 2010) is susceptible to elevated concentrations of sulfide, ammonium, and methane in the infiltrate, which tends to
require post-extraction treatment for drinking water purposes. As polders are typically clay and peat soils reclaimed via extensive groundwater pumping and/or levees, their low hydraulic conductivity, long residence times, and sustained anoxic conditions are
unsurprising (Massmann et al. 2004).
Dissolution of carbonate minerals in the aquifer
2-16
susceptible to dissolution during bank filtration. Silicate mineral dissolution tends to be less extensive than carbonate mineral dissolution (Bourg and Bertin 1993, Bourg and Richard-Raymond 1994, NRC 2008). Sulfide mineral dissolution is often considered in deep-well ASR and ASTR (Herczeg et al. 2004), but significant sulfide mineral
abundances or dissolved sulfide concentrations are atypical in the shallow alluvial
aquifers targeted for bank filtration. Polder settings are an exception, as they can result in anoxic groundwater with enough sulfide to precipitate sulfide minerals (Massmann et al. 2003).
Infiltrate with lower alkalinity and/or pH than the ambient groundwater has been observed to promote calcite (CaCO3) dissolution in many field sites (von Gunten et al. 1991, Bourg and Bertin 1993, van Breukelen et al. 1998, Petkewich et al. 2004, Greskowiak et al. 2005) and some laboratory studies (Rinck-Pfeiffer et al. 2000, Patterson et al. 2010). Even if the infiltrate is chemically similar to the ambient
2-17
especially with reverse-osmosis-treated water in SAT sites (Johnson et al. 1999), but it is unlikely that natural surface water would threaten an aquifer’s structural stability during bank filtration.
Past the reducing zone near the bank, reprecipitation of calcite can sometimes be anticipated based upon geochemical transport models (van Breukelen et al. 1998,
Petkewich et al. 2004) and laboratory studies (Rinck-Pfeiffer et al. 2000). Many field studies do not explicitly consider reprecipitation, but if enough calcite has been dissolved, significant amounts of reprecipitated calcite could clog the pores of the aquifer, as has been observed in column studies (Rinck-Pfeiffer et al. 2000). Field-scale geochemical transport models nevertheless suggest that the reprecipitated quantities of calcite should not affect the aquifer’s porosity (van Breukelen et al. 1998, Petkewich et al. 2004).
Although carbonates are not major sinks for trace elements, in locations with sufficiently high alkalinity, carbonate minerals can control dissolved Fe, Mn, and other trace cation concentrations (Tessier et al. 1979). The carbonate solids of Fe (siderite) and Mn (rhodochrosite) are more soluble than those with most other trace metals. The
2-18
supersaturated in calcite and rhodochrosite or siderite, took more than 100 d to reach steady state (Jensen et al. 2002).
Figure 2.4. Soluble metal concentrations in equilibrium with calcite and metal carbonates (CT = 5.8 mM; CaT = 0.5 mM, the average value for North American fresh water (Morel and Hering 1993)). Solubility products (in the form MCO3 except Ag2CO3) taken from the MINTEQa2 database (2006). For simplicity, concentrations have been plotted with one line for each cluster of solubility products labeled on the figure (log Ksp within 0.5 units).
Multiple field sites have significant fractions of carbonate-bound Mn and Fe. In a polder setting in eastern Germany, dissolved Mn in groundwater was controlled by a combination of Mn and Ca carbonates (Massmann et al. 2004). Similarly, in an in situ
2-19
respiration in the Glatt riverbank released significant Mn and Fe, suggesting both were carbonate-bound (von Gunten et al. 1994). Trace cations have also been released during calcite dissolution, e.g., Zn, Co, Cd, Ni, and Pb in batch incubations of aquifer sediments (Descourvières et al. 2009), and sequestered via carbonate preciptitation, e.g., Cd at the Glatt river site (von Gunten et al. 1991).
Sorption in the aquifer
Sorption and ion exchange also occur because of disequilibrium between the bank filtrate and the native aquifer. Surface-associated ions of the aquifer material desorb, while ions from the bank filtrate adsorb, during infiltration. Significant desorption from
contaminated aquifer sediments would render the bank filtrate unusable without substantial post-treatment, and therefore such sites are avoided for bank filtration. In bank filtration settings, major ions dominate any ion exchange process, and as such, ion exchange rarely affects the quality of the bank filtrate. At one ASR site, exchange of carbonate for chloride in sediments did increase the chloride concentration beyond drinking water standards, and exchange of sodium in aquifer clays may have caused clay expansion and subsequent decreased permeability (Mirecki et al. 1998, Parkhurst and Petkewich 2002).
In contrast, sorption is the main retardation process for dissolved components during infiltration, especially for trace elements released to the bank filtrate in the
2-20
sorption at sites in Switzerland and France (von Gunten et al. 1991, Bourg and
Darmendrail 1992, Bourg and Bertin 1993). Copper, often bound to organic matter, was not as readily adsorbed as Cd and Zn (von Gunten et al. 1991). Similarly, ammonium generated under prolonged reducing conditions at the Seine River (France) only penetrated the first 10–20 m of aquifer sediments after twenty years of passage, due to sorption (Doussan et al. 1998).
Sorption depends upon the surface area of the sorbent and the affinity of the dissolved species for the sorbent surface sites. Trace element sorption on Al, Fe(III), and Mn(III/IV) oxides has been described extensively in the literature (Gadde and Laitinen 1974, Murray 1975, Axe and Trivedi 2002, Lee et al. 2002). Field observations of Al-, Fe(III)-, and Mn(III/IV)-oxide sequestration of trace metals support a strong correlation between the sorption of Mn(II) and other trace metals (Fuller and Harvey 2000, Kay et al. 2001, Lee et al. 2002). (Iron(II) sorption on oxide surfaces is complicated by rapid surface-catalyzed oxidation in the presence of oxygen (Wehrli and Stumm 1989).) Exceptions to this trend occur in sites with high levels of organically-bound Cu and Zn (von Gunten et al. 1991, Bourg and Darmendrail 1992), which remain mobile under conditions otherwise favorable to sorption on aquifer sediments.
The limitation of sorption in long-term bank filtration (e.g., sites in Berlin have been active since the late 1800s (Ziegler 2001)) results from saturation of the surfaces of the aquifer sediments. This causes an advancing sorption front in the aquifer, which can eventually reach the production well, as has been observed for Mn in Israel (Oren et al. 2007) and modeled for P in Canada (Spiteri et al. 2007). Sorption also plays a key role in
2-21
3-1
Chapter 3
A Hydrous Manganese Oxide Doped Gel Probe Sampler for
Measuring
In Situ
Reductive Dissolution Rates: I. Laboratory
Development
Abstract
3-2
gels prevent direct contact between the microbes and the HMO and hence preclude enzymatic reduction at the cell surface. Nonetheless, the HMO-doped gel probes offer the possibility to establish a lower bound for Mn-reduction capacity in sediments.
Introduction
Manganese (Mn) is an important and abundant element in the aqueous environment. Mn oxide solids are well-known sinks for metals and metalloids via sorption, and microbially mediated reduction of Mn oxides has been linked to the release of metals and metalloids to porewater (Lovley 1991). Biogeochemical cycling of Mn thus has implications for the cycling of other trace elements that pose a hazard to human health.
Furthermore, Mn(III,IV) oxide formation and reductive dissolution are key processes in the redox cycling of Mn and other redox-sensitive elements in sediments. The distribution of these elements with depth in sediment porewaters reflects the intensity of chemical and biological redox reactions during early diagenesis, such as the diffusion of dissolved chemical species and the rate of sediment accumulation (Berner 1980). Microbial processes dominate Mn(II) oxidation in the environment, as biological Mn oxidation is generally fast relative to abiotic Mn oxidation processes, including surface-catalyzed reactions (Davies and Morgan 1989, Morgan 2000). On the other hand, Mn(III,IV) oxides are readily reduced by both chemicals (Stone and Morgan 1984, Burdige and Nealson 1986, de Vitre et al. 1988, Wang and Stone 2006b, 2006a) and microbes (Myers and Nealson 1988a, Burdige et al. 1992, Ruebush et al. 2006).
3-3
2008a). The DET method uses polyacrylamide gels placed in a plastic holder, covered with a permeable membrane, and inserted vertically into sediments. The water inside the gel is allowed to equilibrate with the surrounding porewater solution via diffusion, and the composition of the ambient porewater can be determined upon removal. The early model of this device by Davison et al. (1994) used a single polyacrylamide gel slab; a modified ladder structure has been used more recently (Fones et al. 1998, Kneebone et al. 2002, Campbell et al. 2008b).
Polyacrylamide gels doped with Fe oxides have been used to evaluate of the effect of porewater composition on in situ sorption (Campbell et al. 2008a, 2008b). Similar probes containing agarose gels doped with Mn oxides have been used as qualitative redox indicators (Edenborn et al. 2002). These Mn oxide-doped gels take advantage of the high redox potential for Mn oxide reduction, as well as the pronounced difference in the solubility of largely insoluble Mn(III,IV) oxides as compared with the relatively soluble Mn(II) containing solids (Morgan 2000). Thus, under reducing conditions, Mn(II) can diffuse out of gels.
The purpose of this study was to develop and validate a method to quantify in situ
rates of reductive dissolution as a function of depth along a sediment profile by using a hydrous Mn oxide (HMO) doped gel probe sampler. Reductive dissolution of HMO is quantified by measuring Mn mass loss over the course of deployment in sediments. Laboratory validation of this method was performed using two model systems—one abiotic and one biotic. Ascorbate was used for abiotic experiments since it is an analog for some functional groups found in natural organic matter (Stone and Morgan 1984).
3-4
with a highly versatile electron transport chain (Ruebush et al. 2006) and a single polar flagellum (Abboud et al. 2005).
Experimental Section
Reagents
All chemicals used were reagent grade (Omnipure, EM Science unless otherwise noted) and used without further purification. All water used was 18 MΩ-cm deionized water (Elix/Milli-Q, Millipore). Solutions were stored in plastic containers that had been acid-washed in 5% hydrochloric acid. All nitric acid solutions were made with trace metal grade HNO3 (70%). All hydroxylamine solutions were made with trace metal grade hydroxylamine.
HMO synthesis
The HMO precipitate was prepared by adding 50 ml of 0.02 M KMnO4 (adjusted to pH 12.5 with 1M NaOH) dropwise to a stirred solution of 100 ml of 0.03 M MnSO4·H2O (adjusted to pH 7 with 1M NaOH), following the method of Murray (1974). The stirred suspension was allowed to equilibrate over 4 h while the pH stabilized. After 4 h, the HMO was washed 3 times with water, and the precipitate was resuspended in 200 ml of water, with a resulting concentration of approximately 40 mM Mn (3.5 g l-1). This form of HMO is an abiotic analog of biogenic Mn oxide best termed “triclinic Na-birnessite” (Villalobos et al. 2003, Jurgensen et al. 2004).
3-5
weeks. HMO was used within two weeks of synthesis to decrease the impact of changing crystallinity over time. The specific surface area measured by BET-N2 surface
adsorption was 60 m2 g-1, which declined to 38 m2 g-1 after 3 weeks, consistent with that of similar amorphous Mn oxide solids (Villalobos et al. 2003, Kennedy et al. 2004). Finally, the average oxidation state of the HMO solid, measured via a modified Winkler titration (Carpenter 1965), was 3.7 ± 0.1, again consistent with the values (3.6–4.0) for similar amorphous Mn oxide solids (Villalobos et al. 2003, Jurgensen et al. 2004).
Gels and gel probes
Polyacrylamide gel slabs were made by modifying the methods of Davison et al. (1994), Kneebone et al. (2002), and Campbell et al. (2008a). Gels were made by dissolving 3.75 g acrylamide (C3H5NO) and 0.075 g N-N’-methylene-bis-acrylamide
((CH2CHCONH)2CH2) in either 25 ml of water (clear gels) or 7.5 ml HMO stock diluted with 17.5 ml water (HMO-doped gels). The resulting solution was deoxygenated by bubbling with compressed argon for 30–45 minutes. The simultaneous addition of 150 μl of 100g l-1 sodium persulfate and 25 μl of tetramethylethylenediamine (TEMED) initiated the polymerization of the gel. The solution was mixed and quickly poured into a heated, acid-washed, glass Petri dish to increase the polymerization rate. Over 4 minutes, the gel completely solidified, upon which the dish was removed from the heat. After the gel cooled to room temperature, it was gently extracted from the Petri dish with a flexible plastic spatula and transferred directly into 1 l water, in which it hydrated for
approximately 24 h.
3-6
to one week to prevent dehydration. Gel probes were designed to hold the gel slabs in slots etched into a plastic holder, as described in previous work (Campbell et al. 2008b). “Mini-probes” were 4 cm long with a single column of six slots for gel slabs.
Ten gels from each batch of gel slabs were each placed in 10 ml of 0.5% hydroxylamine-HCl for ≥ 12 h to dissolve the HMO out of each gel. The supernatant was diluted and analyzed with ICP-MS to determine the total Mn in the gel, which averaged 1.50 μmol per gel, with less than 15% variation between batches of gels (some gels were excluded due to visual heterogeneity in Mn oxide distribution). Similarly, once a gel slab had reacted with a solution, the gel slab was removed and equilibrated for ≥ 12 h with 0.5% hydroxylamine-HCl, which reductively dissolved any remaining HMO solid. The equilibrating solution was diluted with 1% HNO3 and analyzed for total dissolved Mn via ICP-MS.
Laboratory experiments
A series of laboratory-based experiments were conducted to determine the abiotic and microbially mediated rates of HMO reductive dissolution in suspension and in doped polyacrylamide gels. All laboratory experiments were conducted in triplicate.
Abiotic reduction
3-7
experiments. Over 6 h, samples were taken from the stirred bulk solution, syringe-filtered (Whatman 0.2 μm mixed cellulose ester filters), and acidified in 1% HNO3 for analysis via ICP-MS. Because of the slow rate of Mn(II) oxidation by O2 (Morgan 2005), the total Mn remaining in recovered gel slabs at the end of the experiments was measured to confirm the mass balance. The bulk solution, gel storage bath, and recovered gels accounted for over 95% of the total Mn (Table A.1).
Microbially mediated reduction
Experiments with S. oneidensis MR-1 were conducted anaerobically, either in sealed anaerobic culture bottles (HMO and HMO-doped gels) or under N2 in a glovebox (HMO-doped mini-probes). Inocula for anaerobic cultures were grown aerobically (overnight at 30°C) in Luria Broth to stationary phase (~ 1012 cells l-1). Cells were transferred without washing to MR-1 minimal medium (pH 8; Table A.2), containing 6 mM lactate and amended with HMO, to achieve a cell density of ~ 1011 cells l-1. The medium contained a small amount of Mn(II), which was taken into account in subsequent Mn measurements. Culture bottles were sealed with rubber stoppers and aluminum caps and shaken at 30°C. An observed turbidity increase, indicating microbial growth over the course of the
experiments, was not quantified. Samples were removed through the rubber stoppers via N2-flushed syringes, over 8 h for HMO and over 36 h for HMO-doped gels. HMO-doped mini-probes were deployed in stirred plastic beakers at room temperature (22°C) in a glovebox. Over 63 h, these samples were removed from the bulk solution in N2-flushed syringes. All samples were subsequently filtered and acidified as in the abiotic
3-8
Data analysis
The stoichiometry of abiotic reduction at pH 8 is shown in equation (3-1).
MnO2 + C6H7O6 -→ Mn(II) + C6H5O6 - + 2 OH - (3-1)
The rate of reductive dissolution is assumed to be equal to the rate of Mn(II) production, with a rate expression shown in equation (3-2), where the rate coefficient for the
reduction of the solid MnO2 was calculated by measuring the increase in the
concentration of Mn(II) in solution as a function of time, and solving the rate expression. This expression assumes that the second e- transfer from Mn(III) to Mn(II) is
instantaneous (Stone and Morgan 1987), and that the reactivity of ascorbic acid
intermediates does not affect the 1:1 stoichiometry between Mn(IV) and C6H7O6 - (Toner and Sposito 2005).
dt )] II ( Mn [ d
k [C6H7O6 -]t [MnO2]t (3-2)
Here [MnO2] represents the moles of Mn solid per volume, giving k units of M-1 s-1. Multiplying k by the Mn oxide surface loading (m2 l-1) yields the surface-area-normalized rate coefficient, kSA (m2 mol-1 s-1). As the reaction proceeds, the concentration of MnO2, [MnO2]t, decreases and its value is assumed to be equal to the initial MnO2 concentration, [MnO2]0, minus the dissolved Mn concentration, [Mn(II)]t, at the sampling time (equation (3-3)).
[MnO2]t = [MnO2]0 – [Mn(II)]t (3-3)
3-9
should guarantee that the effect of reoxidation of any readsorbed Mn(II) on equation (3-3) is negligible (Toner and Sposito 2005).
The concentration of ascorbate, [C6H7O6 -]t, also decreases as the reaction proceeds, according to the stoichiometry of equation (3-1); however ascorbate
concentrations were deliberately maintained in approximately tenfold excess of the total Mn in the system so that the ascorbate concentration could be assumed to be roughly constant. Thus, the rate of reductive dissolution can be expressed as in equation (3-4) below.
2 0 t
2 0 t
0 6 7
6H O ] [MnO ] [Mn(II)] k [MnO ] [Mn(II)] C [ k dt )] II ( Mn [ d
(3-4)
Integrating this differential equation with respect to time yields the expression in equation (3-5). t k )] II ( Mn [ ] MnO [ ] MnO [ ln t 0 2 0
2
(3-5)
Plots of the left-hand side of equation (3-5) vs. time have been fitted with linear
regression (performed in Microsoft Excel). The slope of the regression line is equal to k′
(t-1), and the y-intercept is theoretically 0. Statistical differences between apparent rate coefficients and between y-intercepts and zero were assessed with the t-test at a
significance level of 95% in Microsoft Excel.
This approach was extended to describe microbially mediated reductive dissolution by making the simplifying assumption that this reaction occurs via a
hypothetical reductant, Red, with a constant concentration (see also discussion below).
3-10
To separate the diffusion component from the chemical reduction component of the observed reaction rates, a one-dimensional diffusion-reaction model was applied to the experimental data using AQUASIM 2.1 (Reichert 1994). This model represented an HMO-doped gel as a “biofilm reactor compartment” (at zero growth rate) containing a solid matrix with well-mixed water in the pore space (92% porosity). The chemical reduction of HMO to Mn(II), whose kinetics were represented as equation (3-2) above, was limited to the pore space of this compartment. The stirred bulk solution was represented as a “mixed reactor compartment”. The two compartments were connected with a “diffusive link”, modeling a diffusive boundary layer for the dissolved Mn(II) and the reductant.
Initial conditions in the simulations were set to match the experimental conditions, normalized to one gel, as summarized in Table A.3. Initially, all of the Mn was confined to the gel pore space as HMO, and all of the reductant was confined to the mixed reactor. In the microbial experiments, the hypothetical reductant Red was substituted for
ascorbate in equation (3-2); the diffusion coefficients for ascorbate were also used for Red. For the microbial experiments with HMO in suspension, direct (presumably enzymatic) reduction at the cell surface was incorporated as shown in equation (3-6):
dt )] II ( Mn [ d
k″[MnO2]t . (3-6)
This mechanism, however, was excluded for HMO-doped gels (see Discussion).
Simulations were performed in “Parameter Estimation” mode, which minimizes 2 values between the model and the experimental data to solve for a specific parameter.
3-11
system would generate the measured experimental data, with 100% (p-value of 1.00) being ideal goodness of fit.
Results
Laboratory experiments
Dissolved Mn was found to diffuse out of the gels in the absence of an externally added reductant. Prior to the reductive dissolution experiments, the HMO-doped gels were stored and, in the case of microbial studies, deoxygenated in Milli-Q water. It was observed that a substantial fraction of the total initial Mn (generally ≤ 20%) diffused out of the gels during deoxygenation and storage, which was attributable to desorption of Mn(II) sorbed to the HMO surface. Note that Mn(II) is present in stoichiometric excess in the synthesis method. In Milli-Q water, the rate of Mn loss was approximately 4.2×10 -11 M s-1. When the gels were transferred from Milli-Q water to the background
electrolyte (2 mM HEPES in 33 mM Na2SO4) used for the abiotic experiments, however, negligible loss of Mn was observed over 5 d (data not shown).
Abiotic experiments with HMO in suspension proceeded quickly relative to experiments with HMO embedded in the gels; dissolution of the HMO in suspension was complete within 2 minutes. A lower bound of the surface-area-normalized rate
coefficient based on this observation is kSA = 5 m2 mol-1s-1; the reported rate coefficient for this reaction at pH 7.2 is 4 m2 mol-1s-1 (Stone and Morgan 1984).
3-12
summarized in Table 3.1. The slopes correspond to the apparent rate coefficients for each experiment. Insignificant differences in rate coefficients were obtained using Mn concentrations from syringe-filtered (0.2 μm) and unfiltered samples in abiotic
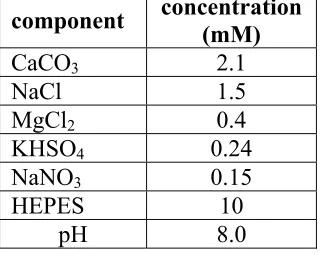
experiments with HMO-doped gels; syringe-filtered Mn concentrations were > 90% of unfiltered Mn concentrations (data not shown). Likewise, the use of different membrane pore sizes in the mini-probe experiments did not affect the observed rates (Table 3.1). Overall, abiotic Mn release rates are 1–2 orders of magnitude faster than biotic rates, as represented by k′. Embedding HMO in gels and placing gels in mini-probes affects the observed apparent rate coefficients more in the abiotic experiments than in the biotic experiments. Microbial experiments with HMO suspension and mini-probes exhibited a lag phase (Figure 3.1b: 1 hour, and Figure 3.1c: 8 hours, respectively), which was only statistically significant for the mini-probes (Table 3.1, see Discussion).
3-13 0.0 0.4 0.8 1.2 1.6 2.0
0 2 4 6
Time (h) ln [ M n O 2 ] 0 ([ M n O 2 ] t ) -1
(a)
-0.2 0.0 0.2 0.40 2 4 6
Time (h) ln [ M n O 2 ] 0 ([ M n O 2 ] t ) -1
(b)
0.0 0.2 0.4 0.6 0.8 1.00 40 80
[image:52.612.234.416.66.592.2]Time (h) ln [M n O 2 ] 0 ([ M n O 2 ] t ) -1
(c)
Figure 3.1. Integrated expression for the rate of Mn release, ln ([MnO2]0[MnO2]t-1), as a function of time at pH 8.0. (a) abiotic reaction of ascorbate ([C6H7O6-]0 = 2 mM) and HMO-doped gels (○; MnT = 184 M) or HMO-doped gels in mini-probes with 0.45 (; MnT = 52 M) or 1.0 (□; MnT = 52 M) μm membranes. (b, c) biotic reaction of S. oneidensis MR-1 (1011 cells l-1) with HMO suspension (b: ; Mn
3-14
Table 3.1. Summary of linear regression data for laboratory-measured rates of reductive dissolution
Reductant Oxidant k′ (s-1) ±95%
C.I.a y- intercept ±95% C.I. non- zero?e r
2
Ascorbate HMOb 5×10⁻² --- --- --- --- ---
HMO gels 1.0×10⁻⁴ 2×10⁻⁵ 7×10⁻² 1×10⁻¹ no 0.99 MP 0.45 mc 3.8×10⁻⁵ 7×10⁻⁶ 2×10⁻² 7×10⁻² no 1.00 MP 1.0 mc 3.5×10⁻⁵ 7×10⁻⁶ 7×10⁻² 8×10⁻² yes 0.98 S. oneidensis
MR-1 HMO 1.5×10
-5 1×10⁻⁵ -3×10⁻² 7×10⁻² no 0.95 HMO gelsd 2.7×10⁻⁶ 4×10⁻⁷ 5×10⁻³ 3×10⁻² no 1.00 MP 0.45 md 2.9×10⁻⁶ 7×10⁻⁷ -1×10⁻² 8×10⁻² yes 0.99 MP 1.0 md 3.3×10⁻⁶ 8×10⁻⁷ -1×10⁻² 1×10⁻¹ yes 0.99 a 95% confidence interval bounds for k′ (s-1)
b Rate estimated from complete dissolution in 2 minutes
c The rate coefficients of the two mini-probes reacted with ascorbate are not statistically different from each other.
d The rate coefficients of the HMO gels and the two mini-probes reduced by S. oneidensis MR-1 are not statistically different from each other.
e Is the y-intercept statistically different from zero, the initial value of ln ([MnO 2]0 [MnO2]t-1)?
One-dimensional model
The Mn release rates in the abiotic systems are quite different for HMO in suspension, in the gels, and in the mini-probes, even though the chemical reactants (i.e., HMO and ascorbate) are the same. This indicates that the physical properties of the systems (i.e., the embedding of the HMO in the gel and the placement of the gel in the mini-probe) must be accounted for. The AQUASIM model incorporates diffusive effects, thus allowing comparison of the different systems.
3-15
ascorbate in the gel (for abiotic experiments) and the rate coefficients k″ and k′ (for the microbial experiments with HMO in suspension and in gels, respectively). Inclusion of second and third fitting parameters did not significantly improve the fit to the data.
For the two abiotic experiments, values of k derived from k′ (HMO in suspension) divided by [C6H7O6-]0 (Table 3.1) were applied, and AQUASIM solved for the diffusion coefficient of ascorbate within the gel required for optimal fitting of the data (Figure 3.2). The diffusion coefficients of ascorbate in the bulk solution and Mn(II) throughout the system were adopted from literature (Yuan-Hui and Gregory 1974, Moreno et al. 2000, Nassef et al. 2007). This physical fitting parameter could account for the different Mn release rates in the two systems, so that the underlying chemical reaction rates are unaffected by the embedding of the HMO in the gel and the placement of the gel in the mini-probe.
3-16
Chi-squared values ranged from 1.2 to 2.6 (Figure 3.2; Table A.3), which correspond with p-values greater than 0.998. Note that an 8 hour lag phase (which was not attributable to diffusion) was excluded in fitting the data from the microbial mini-probe experiment; in Figure 3.2 (right panel), time equals zero corresponds to the end of the lag period. In all cases, mass balances were satisfied for the model at steady state, with less than 1% error (Table A.4).
0 50 100 150 200
0 1 2 3 4 5
Time (h)
[Mn
(I
I)] (
M)
0 25 50 75 100
0 20 40 60
Time (h)
Figure 3.2. 1-D model output (lines) of Mn(II) accumulation in the bulk solution for abiotic (left) and microbially mediated (right) experiments with HMO-doped gels (○) or HMO-doped gels in mini-probes with 1.0 m membrane (□). An 8 hour lag phase was removed from the microbial mini-probe data. Error bars are smaller than the size of the data markers in some cases. Conditions given in Figure 3.1.
Discussion
3-17
gels were placed in the mini-probes (1.0 10-6 cm2 s-1) than when they were not (4.3
10-7 cm2 s-1). Since slower reduction was observed for HMO-doped gels in the mini-probes, this difference in the fitted diffusion coefficients can be attributed to the physical constraints of the mini-probes, which are not explicitly incorporated into the 1-D model. The bulk ascorbate diffusion coefficient is three–sevenfold larger than these gel-based diffusion coefficients, which may reflect the impact of tortuosity on diffusion in a highly porous medium (Shen and Chen 2007) or Donnan effects within the gel (Yezek and van Leeuwen 2005); both of which are presumed to be more significant for ascorbate compared to the Mn(II) ion.
The model assumed the same mechanism for microbially mediated reductive dissolution in gels: direct reduction via an external reductant (Red) diffusing into the gel. This assumption is justified because the gels and membrane prevent direct contact
between Shewanella cells and the Mn oxide. The lack of contact is a function of
3-18
aeruginosa did not penetrate MnO2-doped agarose gels after 1 month of incubation (Edenborn et al. 2002), so representing microbial reduction with an external reductant in the 1-D model seems appropriate.
On the other hand, the 1-D model explicitly shows that the gels do not capture all of the microbial reduction, as represented by the additional reduction mechanism required in the HMO suspension experiment. The nonzero rate coefficient k″ represents direct enzyme-catalyzed reduction at the cell surface, to which Mn oxide is inaccessible when doped in gels. In terms of the overall microbial reduction rate with HMO in suspension, k″ constitutes 65% of the total rate, whereas k′, the product of k and [Red]0, constitutes the remaining 35% (Table A.3). In other words, Mn oxide-doped gels measure
by-3-19
products of metabolism, rather than by direct enzymatic microbial reduction, which is a distinct artifact. These biochemical compounds are likely to be smaller than the
membrane pore sizes, since like ascorbate, the pore size has no statistically significant effect on the reduction rate they produce (Table 3.1).
Table 3.2. Summary of literature values for Mn oxide reduction by S. oneidensis MR-1
Source Reported Rate
(units given)
Growth
Mediuma Mn oxideb
Rate
(mol s-1 cell-1)
Burdige et al.
(1992) 7.39 M d
-1c LO HMO 2.14×10⁻²⁰
4.65 M d-1c LO -MnO2 1.35×10⁻²⁰ 11.8 M d-1c LO birnessite 3.43×10⁻²⁰ Myers and
Nealson (1988a) 2.0-87×10
-10mol h-1 cell-1 LO -MnO
2 5.6-240×10-20 1.0-4.2×10⁻⁸mol h-1 cell-1 M1 -MnO2 2.9-12×10-18
Ruebush et al.
(2006) 7.4×10⁻⁸ mol min-1 mg-1 d M1e birnessite 1.1×10⁻¹⁹
this study --- M1 HMO 5.4×10⁻¹⁹
a LO medium is an undefined medium, whereas M1 is a defined, minimal medium. b Birnessite and -MnO
2 are structurally similar to HMO [21]. c Cell number is 4×10⁶ cells ml-1.
d Rates measured for total membrane (TM) fractions only (8.75 mg TM cell-1)
e M1 medium modified with 50 mM ferric citrate (replacing fumarate), 30 mM DL-lactate, 4 mM sodium phosphate, and 10 mM HEPES
3-20
Although reduction by ascorbate is much faster than microbially mediated reduction in these laboratory studies, the experimental conditions are not likely to be representative of the environment. The concentration of abiotic reductants may be substantially lower than the ascorbate concentration used. And conversely, the cell number (1011 cells l-1) is at the low end of the environmental range in shallow sediments of 1011–1013 cells l-1 (Capone and Kiene 1988, Wellsbury et al. 1996), although metal-reducing bacteria may be only a fraction of the total biomass.
Limitations of HMO-doped gel probes
Besides the above caveat regarding microbial reduction, HMO-doped gel probes are subject to three additional considerations. First, Mn readily leaches out of the HMO-doped gels at low rates in deionized water. This method of HMO synthesis uses excess Mn(II), which results in “pre-saturated” HMO sorption sites for laboratory experiments. On one hand, saturated sorption sites could avoid the issue of reduced Mn from the solid sorbing onto the surface, making bulk solution measurements of dissolved Mn(II) more representative of the surface reduction rate. On the other hand, Mn(II) could block access of reductants to the surface of HMO, depressing the measured rates. Nevertheless, since rates of HMO reduction are comparable to those in literature for both abiotic and
3-21
the storage time will minimize this effect, but failure to account for this could lead to an overestimation of the amount of Mn loss via reduction.
Second, S. oneidensis MR-1 exhibited an 8 h lag phase in experiments with HMO-doped gels in mini-probes. A possible consequence for field application is that microbial metabolism could require some amount of time to adjust to the newly available oxidant. For this reason, deployment times should allow for the lag time (≤ 8 h) to become insignificant relative to the total deployment time.
Finally, any field application of these gel probes must consider the impact of Mn addition to sediments. In sediments with high organic carbon sediments and high microbial activity but low Mn content, Mn-reducing physiology may be prevalent
(Lovley 1991) but not active under ambient conditions. The introduction of HMO-doped gels would then introduce a substrate that was not present in the sediments and the measured rate of reduction based on the HMO-doped gels would represent a potential rate of reduction (rather than the actual rate under ambient conditions). To account for this, solid phase analysis of sediment cores should accompany deployment to show definitively where Mn oxide is exhausted in the sediment. In light of this consideration, this technique may be taken to represent a lower bound (i.e., corresponding to the indirect reduction pathway only) of the potential for Mn reduction (i.e., where the solid substrate is not limiting) in a saturated environment.
Acknowledgements
3-22

![Figure 3.1. Mn Integrated expression for the rate of Mn release, ln ([MnO2]0[MnO2]t-1), as a function of time at pH 8.0](https://thumb-us.123doks.com/thumbv2/123dok_us/8591779.863709/52.612.234.416.66.592/figure-integrated-expression-rate-release-mno-mno-function.webp)