Spatial Analysis of Groundwater Quality of Malwa
Region of Punjab using Multivariate Statstical
Techniques
Sudhanshu1, S.K. Sharma2 1
ME Scholar, Environmental Engineering, PEC University of Technology, Chandigarh 2
Professor, Civil Engineering Department, PEC University of Technology, Chandigarh
Abstract: The Multivariate platform examines multiple variables to see how they relate and more than one dependent variable is analyzed simultaneously with other. This research explored the quality of groundwater of 43 wells during 5 years (2011-2015), in 12 districts of Malwa region, Punjab, to survey spatial variation of groundwater quality and also major sources of physico-chemical components for drinking and agricultural uses. Multivariate statistical techniques, cluster analysis (CA) and principal component analysis (PCA) had been integrated to assess and interpret spatial variations of water quality of wells. Hierarchical cluster analysis revealed all sites could be grouped into three clusters representing different levels of pollution: 16 relatively less polluted (LP) sites, 19 moderate polluted (MP) sites, and 8 highly polluted lower (HP) sites. Principal component analysis was used to explore the most important factors determining the spatial dynamics of water quality in Malwa region of Punjab. Principal component analysis is applied to each cluster to calculate optimum number of principal components required for describing the water quality variation using IBM SPSS 22. Principal components obtained from the analysis indicated the parameters responsible for water quality variation were mainly related to CO32- and SiO2 in less polluted areas mainly due to
natural cause, high salinity due to high EC, Cl- and Na+ due to use of fertilizers and sewage in moderately polluted areas and high concentration of Mg+, Ca+, NO3-, SO42- and TH due to high use of fertilizers, agricultures( non-point sources) and sewage,
industries of pulp-paper, textiles and fertilizers (point sources). This study suggested that multivariate statistical techniques are useful tools for identification of important water quality monitoring sites parameters and interpretation of complex data matrix, and in water quality assessment, identification of pollution sources/factors and understanding spatial variations.
Keywords: Malwa region, Punjab; Groundwater quality; Multivariate statistical techniques; Cluster analysis; Principal component analysis
I. INTRODUCTION
matrix rather than a covariance matrix. If the parameter variables are in wildly different units (concentrations in mg/L, pH, and temp in oC) then standard variates and correlation matrix should be used and if the variables are not to be considered of equal importance, then the analysis of the correlation matrix is not recommended (Karpuzcu et al. 1987).
In the present study, two different multivariate statistical techniques (CA, FA/PCA) were applied to evaluate the spatial variations in water-quality data set of the Groundwater of Malwa region of Punjab by data reduction without losing much information, which were generated during the 5-years (2011-15) and about 3000 observations.
II. METHODS A. Study Area
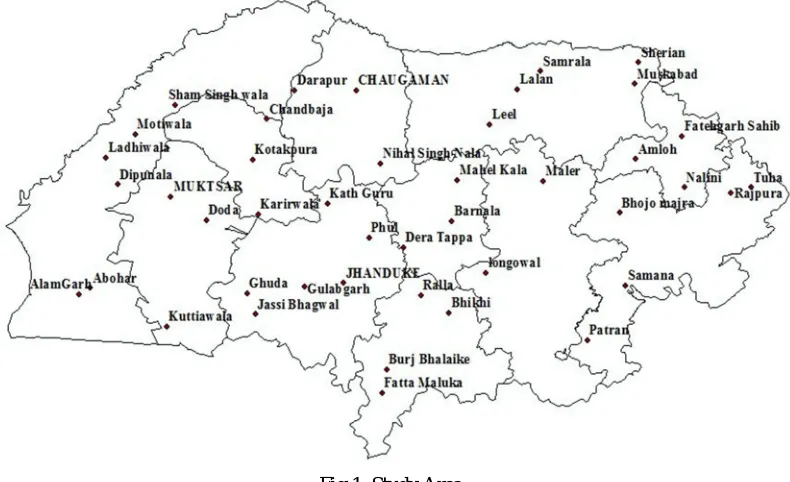
[image:3.612.111.506.343.584.2]The study area is the southern region of Punjab state of India. The geographical location of the study region of South Punjab is between latitude 29o20’ – 31o10’N and longitude 73o75’ to 76o50’E at an average elevation of 200 m from the mean sea level. It comprises 12 districts (Bhathinda, Faridkot, Fatehgarh, Firozpur, Fazilka, Ludhiana, Mansa, Moga, Muktsar, Nawanshar, Patiala and Barnala) with 43 sampling sites. The total study area is about 31500 sq. km with mean elevation of about 200 m from M.S.L. Average rainfall in this region is 750 mm and Sutlej is main river flows through some of the districts. Punjab state occupies only 1.5 per cent of the geographical area of the country and being most fertile regions in India produce around two-third of the food grains annually in the country. By the excessive use of pesticides, fertilizer and other chemicals Punjab took the lead in the Green Revolution and became the country’s no. 1 state in food grain production and also for the contaminated groundwater. Industrial units including food & food products, beverages, paper, textile, tanning, electroplating & machinery units which discharge their industrial wastes into drains which are responsible for the contamination of groundwater quality.
Fig 1. Study Area
B. Data Collection
C. Data Pretreatment and Multivariate Statistical Analysis
The Kaiser-Meyer-Olkin is the measure of sampling adequacy, which varies between 0 and 1. It indicates the proportion of variance which is common variance, The values closer to 1 are better and the value of 0.6 is the suggested minimum and in this case study KMO = 0.633 which indicates that the sample is adequate and may proceed with the Principal Component Analysis. The Bartlett's Test of Sphericity is the test for the correlation matrix has an identity matrix. It checks if there is a certain redundancy between the variables that we can summarize with a few number of factors. The significance level which is 0 in this study (less than 0.05) indicates that there are significant relationships among variables. Taking this into consideration, these tests shown in Figure 3 provide the minimum standard to proceed for PCA.
Multivariate statistical analysis of the river water-quality data set was analyzed through CA and PCA techniques (Wunderlin et al., 2001; Simeonova et al., 2003). Cluster analysis and FA/PCA were applied on z-scale standardized data to avoid misclassification due to large dissimilarity and variability in data dimensionality (Liu et al., 2003; Shrestha et. al. 2007). All statistical computations were made using MS Office Excel 2013 and SPSS 22.0
1) Cluster Analysis: Cluster analysis is an investigative data analysis tool for assembling observed data into meaningful clusters (groups) based on combinations of variables. Cluster analysis can perform the data reduction procedure objectively by reducing the information from the entire population of sample into the information about specific group. Clustering is a standard procedure in multivariate data analysis and the natural grouping of similar objects based upon input parameters. Cluster analysis is a grouping based upon distances proximity. The similarity, or dissimilarity, between two data objects is typically measured as the distance between the multi-dimensional feature vectors that represent the objects. It means the cluster formed are homogeneous within and heterogeneous across. The larger the distance between two data points, the less similar they are to each other. Hierarchical cluster analysis is a stepwise procedure that to identifies relative homogeneous groups of cases based on selected characteristics using an algorithm either agglomerative or divisive, resulting to a construction of hierarchy or tree like structure called dendogram diagram depicting the formation of clusters. CA was applied on the standrdized data set by means of the Ward’s method, using squared Euclidean distances.
2) Principal Component Analysis: Principal component is a technique used to emphasize variation and bring out strong patterns in a data set. (Wunderlin et al., 2001) PCA is a method which is applied to reduce the dimensionality of large set of correlated variables without losing much information and variability present in data set. The data reduction is attained by transforming the data set of original variable into new set of uncorrelated or orthogonal variables sets (called Principal Components) in the decreasing order of importance. Principal components are linear combination of original variables. In this research work Cluster analysis was applied to detect spatial representation for grouping of sites under the monitoring stations. PCA was applied to summarize the statistical relation among parameters in the water quality data set. Concentration order among all physico-chemical parameters differ greatly and the statistical outcomes should be highly biased by any parameter with high concentration. The calculation was performed based on the correlation matrix of parameters and the PCA scores were obtained from the standardized analytical data
III. RESULTS AND DISCUSSION
Water-quality monitoring of the groundwater was regularly conducted over a period of 5-years (2011-16) at 43 different sites. All the samples were analysed for 15 parameters and their station wise annual mean values are summarized in Table 1.
A. The Physical-Chemical Characteristics of Groundwater
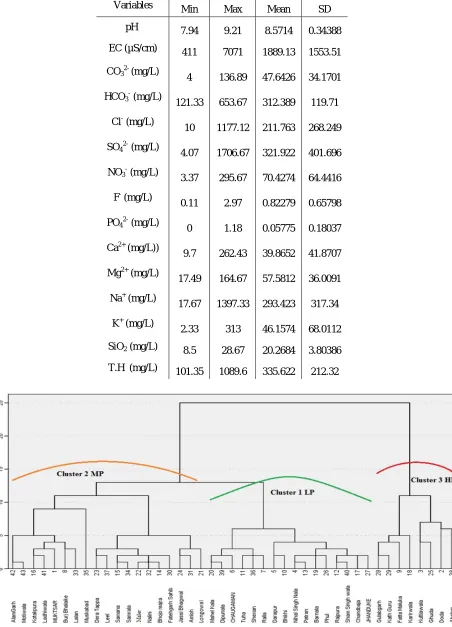
Table 1 Mean and Standard Deviation of Groundwater Quality Parameters
Variables Min Max Mean SD
pH 7.94 9.21 8.5714 0.34388
EC (µS/cm) 411 7071 1889.13 1553.51
CO32- (mg/L)
4 136.89 47.6426 34.1701
HCO3- (mg/L)
121.33 653.67 312.389 119.71
Cl- (mg/L)
10 1177.12 211.763 268.249
SO42- (mg/L)
4.07 1706.67 321.922 401.696
NO3- (mg/L)
3.37 295.67 70.4274 64.4416
F- (mg/L)
0.11 2.97 0.82279 0.65798
PO42- (mg/L)
0 1.18 0.05775 0.18037
Ca2+ (mg/L))
9.7 262.43 39.8652 41.8707
Mg2+ (mg/L)
17.49 164.67 57.5812 36.0091
Na+ (mg/L)
17.67 1397.33 293.423 317.34
K+ (mg/L)
2.33 313 46.1574 68.0112
SiO2 (mg/L) 8.5 28.67 20.2684 3.80386
[image:5.612.62.547.96.728.2]T.H (mg/L) 101.35 1089.6 335.622 212.32
B. Cluster Analysis
From results of cluster analysis, the water quality could be divided into three polluted areas. Cluster 1 corresponds to Rajpura, Patran, Chandbaja, Barnala, Mahel Kala, Phul, Jhanduke, Sherian, Dipunala, Sham Singh wala, Chaugaman, Ralla, Bhikhi, Tuha, Nihal Singh Nala, Darapur, the less polluted (LP) areas. Cluster 2 corresponds to Muktsar, Burj Bhalaike, Bhojo Majra, Samana, Kotakpura, Longowal, Maler, Dera Tappa, Jassi Bhagwal, Fatehgarh Sahib, Amloh, Nalini, Lalan, Samrala, Muskabad, Leel, Ladhiwala, Alamgarh and Motiwala, moderately polluted (MP) ares. Cluster 3 corresponds to Doda, Kuttiawala, Fatta Maluka, Karirwala, Ghuda, Gulabgarh, Kath Guru and Abohar, the highly polluted (HP) regions. A dendrogram of sampling sites obtained by Ward’s method is shown in Figure 2.
C. Principal Component Analysis
PCA is a robust pattern identification technique that explain the variance of a large set of data of inter correlated variables with a smaller set independent variables (Principal component) (J.A. Simeonova et. al. 2003). Principal component analysis was applied on the normalized dataset of 15 variables for 3 different grouped regions clustered by hierarchical cluster analysis, in order to identified important water quality parameters. An eigenvalue gives a measure of the significance of the factor: the factors with the highest eigenvalues are the most significant. Eigenvalues of 1.0 or greater are considered significant (S. Shrestha et. al. 2007). Factors loading can be classified as ‘strong’, ‘moderate’ and ‘weak’, according to definite loading values of >= 0.75, 0.75-0.5 and 0.5-0.3 respectively (Liu et. al. 2003). These factors with eigenvalue greater than 1 explain about 82.489 % of total sample variance in less polluted (LP) regions, 88.07% of total sample variance in moderately polluted (MP) regions and 91.87% of the total sample variance in highly polluted (HP) regions.
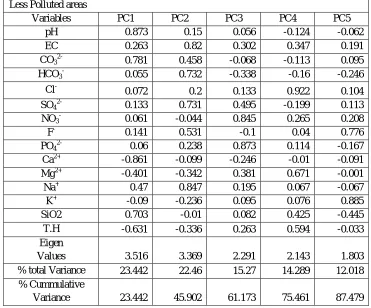
1) Principal Component Analysis in Less Polluted Region: In less polluted regions five components of PCA analysis showed 87.48 % of the variance in the data set, as the eigenvectors classified the 15 parameters of 16 monitoring stations into five
groups shown in Table 2. Among five PCs, PC1, explaining 23.42% of total variance, has strong positive loading on pH, CO32-
and SiO2 and strong negative loading of Ca2+ shows the alkalinity of groundwater in the regions due to natural causes. Silica released due to chemical breakdown of silicate minerals in rocks and sediments by chemical weathering is acquired by circulating groundwater. PC2, PC3 and PC4 explaining 22.46%, 15.27% and 14.289% of the total variance respectively, has strong positive loadings on EC, Na+, nitrate and chloride ions. This explains the salinity of groundwater due to presence of ions. These represent the seasonal and natural impact of discharge and temperature. PC5 showed the 12.01% variance due to strong loading of K+ and F- ions in the groundwater due to natural occurrence of fluoride in rocks and fertilizers leads to its infiltration in groundwater.
2) Principal Component Analysis in Moderately Polluted Region: In moderately polluted regions four components of PCA analysis showed 85.07 % of the variance in the data set, as the eigenvectors classified the 15 parameters of 19 monitoring stations into four groups shown in Table 3. Among four PCs, PC1, explaining 44.79% of total variance, has strong positive loading of EC, NO3-, SO42-, Mg+, Na+ and TH. This shows the infiltration of agricultural sub waste like fertilizers and domestic sewage wastewater through drains in groundwater. PC2 and PC3 shows 16.77% and 15.96% variance respectively due to strong loading of pH and PO43- caused by an increase of mineral and organic nutrients, intensified by human activities due to use of excessive phosphatic fertilizers
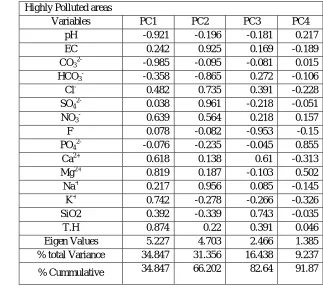
3) Principal Component Analysis in Highly Polluted Region: In highly polluted regions four components of PCA analysis showed 91.87 % of the variance in the data set, as the eigenvectors classified the 15 parameters of 8 monitoring stations into four groups
shown in Table 4. Among four PCs, PC1, explaining 34.87% of the total variance strong negative loading of pH, CO32-, with
Fig 3. The Kaiser-Meyer-Olkin is the measure of sampling adequacy, KMO = 0.633 which indicates that the sample is adequate and may proceed with the Principal Component Analysis. The Bartlett's Test of Sphericity checks if there is a certain redundancy between the variables that we can summarize with a few number of factors. The significance level which is 0 in this study (less than 0.05) indicates that there are significant relationships among variable and provide the minimum standard to proceed for PCA.
Table 2 Principle component analysis and the rotation method is varimax with Kaiser for less polluted areas. Less Polluted areas
Variables PC1 PC2 PC3 PC4 PC5
pH 0.873 0.15 0.056 -0.124 -0.062
EC 0.263 0.82 0.302 0.347 0.191
CO32- 0.781 0.458 -0.068 -0.113 0.095
HCO3- 0.055 0.732 -0.338 -0.16 -0.246
Cl- 0.072 0.2 0.133 0.922 0.104
SO42- 0.133 0.731 0.495 -0.199 0.113
NO3- 0.061 -0.044 0.845 0.265 0.208
F- 0.141 0.531 -0.1 0.04 0.776
PO42- 0.06 0.238 0.873 0.114 -0.167
Ca2+ -0.861 -0.099 -0.246 -0.01 -0.091
Mg2+ -0.401 -0.342 0.381 0.671 -0.001
Na+ 0.47 0.847 0.195 0.067 -0.067
K+ -0.09 -0.236 0.095 0.076 0.885
SiO2 0.703 -0.01 0.082 0.425 -0.445
T.H -0.631 -0.336 0.263 0.594 -0.033
Eigen
Values 3.516 3.369 2.291 2.143 1.803
% total Variance 23.442 22.46 15.27 14.289 12.018
% Cummulative
[image:7.612.120.491.409.717.2]Table 3Principle component analysis for moderately polluted areas
Moderately Polluted areas
Variables PC1 PC2 PC3 PC4
pH 0.192 0.858 -0.239 0.136
EC 0.966 0.19 0.071 -0.043
CO32- 0.367 0.697 -0.347 -0.235
HCO3- 0.26 -0.522 0.608 0.027
Cl- 0.96 0.106 0.054 -0.064
SO42- 0.755 0.552 0.015 -0.043
NO3- 0.716 -0.595 0.1 -0.019
F- 0.542 0.106 -0.038 0.731
PO42- -0.062 0.14 0.926 -0.067
Ca2+ 0.104 -0.083 0.86 0.061
Mg2+ 0.948 -0.077 0.052 0.046
Na+ 0.833 0.397 -0.008 0.133
K+ 0.58 0.1 0.06 -0.726
SiO2 -0.672 -0.309 0.332 0.062
T.H 0.897 -0.095 0.335 0.063
Eigen Values 6.672 2.516 2.393 1.181
% total Variance 44.479 16.77 15.956 7.87
% Cummulative
Variance 44.479 61.249 77.205 85.075
Table 4Principle component analysis for highly polluted areas Highly Polluted areas
Variables PC1 PC2 PC3 PC4
pH -0.921 -0.196 -0.181 0.217
EC 0.242 0.925 0.169 -0.189
CO32- -0.985 -0.095 -0.081 0.015
HCO3- -0.358 -0.865 0.272 -0.106
Cl- 0.482 0.735 0.391 -0.228
SO42- 0.038 0.961 -0.218 -0.051
NO3- 0.639 0.564 0.218 0.157
F- 0.078 -0.082 -0.953 -0.15
PO42- -0.076 -0.235 -0.045 0.855
Ca2+ 0.618 0.138 0.61 -0.313
Mg2+ 0.819 0.187 -0.103 0.502
Na+ 0.217 0.956 0.085 -0.145
K+ 0.742 -0.278 -0.266 -0.326
SiO2 0.392 -0.339 0.743 -0.035
T.H 0.874 0.22 0.391 0.046
Eigen Values 5.227 4.703 2.466 1.385
% total Variance 34.847 31.356 16.438 9.237
[image:8.612.135.458.452.743.2]Variance
IV. CONCLUSION
In this case study, multivariate statistical techniques, cluster analysis and principal component analysis were used to evaluate spatial variations of the groundwater quality of the Malwa region. This show the applicability of the use of multivariate statistical analysis for the pollution studies of groundwater. CA shows the significant three clusters in which region can be divided and classified as the less polluted (LP), moderately polluted (MP) and highly polluted (HP). Groundwater pollution is a major concern from the past few years in Punjab. Malwa region is worst hit due to agricultural revolution with the use of wide varieties of fertilizers and pesticides. PCA study shows that most of the groundwater in the moderately polluted area is not fit for drinking and other household purposes due to moderate to high concentration of electrical conductivity, fluoride, magnesium and potassium. But in the highly polluted region the water is not even useful for the agricultural purposes too due to high salinity and high concentration of ions. The groundwater of Malwa region of Punjab in mainly polluted due to excessive use fertilizers and pesticides in agricultural activities and due to industrial units disposing their waste into drains and landfills without proper treatment.
V. ACKNOWLEDGEMENTS
The authors would like to thank the Central Ground Water Board, North Western Region (CGWB, NWR), Chandigarh for providing
the groundwater quality data of the Punjab. Also, authors would like to thank Punjab Engineering College (PEC), University of Technology for providing the platform to carry out the study.
REFERENCES
[1] Asaad, M., Armanuos, Negm, A. and Oliver C., 2016. “Groundwater Quality Investigation Using Multivariate Analysis — Case Study: Western Nile Delta Aquifer, Egypt”. International Journal of Environmental Science and Development, Vol. 7, No. 1.
[2] Chatfield, C., Collins A. J., 1980. “Introduction to Multivariate Analysis”. Chapman t Hall, London and New York, 246.
[3] Karpuzcu, M. and Senes, S., 1987. “Design of Monitoring Systems for Water Quality by Principal Component Analysis and a Case Study”. Proceedings of the International Symposium on Environmental Management. Environment ’87, Vol.1, 673-690.
[4] Liu, C.W., Lin, K.H. and Kuo, Y.M., 2003. “Application of factor analysis in the assessment of groundwater in a Blackfoot disease area in Taiwan”, Science of the Total Environment, 313(1-13): 77-89.
[5] Palma, P., Alvarenga, P., Palma, V.A., Fernandes, R.M., Soares,A. M. V. M., , Barbosa, I. R., 2010. Assessment of anthropogenic sources of water pollution using multivariate statistical techniques: a case study of the Alqueva’s reservoir, Portugal, Environ Monit Assess 165:539–552.
[6] Shrestha, S. and Kazama, F., 2006. “Assessment of surface water quality using multivariate statistical techniques: A case study of the Fuji river basin, Japan”. Environmental Modelling & Software 22: 464-475.
[7] Simeonova, P., Simeonova, V. and Andreev, G., 2003. “ Environmetric analysis of the Struma River water quality central”, European journal of Chemistry, 2: 121-126.
[8] Simeonova, V., Stratisb, J.A., Samarac C., Zachariadisb G., Voutsac D., Anthemidis A., Sofonioub, M. and Kouimtzis, T., 2003. “Assessment of the surface water quality in northern Greece”, Water Research 37: 4119-4124.
[9] Singh, K.P., Malik, A., Mohan, D. and Sinha, S., 2004. “Multivariate statistical techniques for the evaluation of spatial and temporal variations in water quality of Gomti River (India): a case study”. Water Research 38, 3980-3992.
[10] Sunne, V.E., Sanchez, V.X. and Carrera, J., 2005. “Introductory review of specific factors influencing urban groundwater, an emerging branch of hydrogeology, with reference to Barcelona, Spain”. Hydrogeol J 13:522–533.
[11] Wunderlin, D.A., Diaz, M.P., Ame, M.V., Pesce, S.F., Hued, A.C. and Bistoni, M.A., 2001. “Pattern recognition techniques for the evaluation of spatial and temporal variations in water quality. A case study: Suquia river basin (Cordoba, Argentina)”. Water Research 35, 2881-2894.