Technology (IJRASET)
©IJRASET : All Rights are Reserved
495
Study and Analysis of Various Pre-Processing
Techniques used in Breast Cancer Detection using
Image Processing
Vidya.M#1, S. Dilip Kumar*2
#
Department of Instrumentation and Control Engineering, Sri Krishna College of Technology
Abstract— In this paper various image pre-processing techniques for mammogram images including filtering and enhancement techniques are studied and analyzed. In the re-cent days’ breast cancer detection has become a very important role for women to save their life. Due to the poorly captured mammogram image quality pre-processing is the most important step in mammogram analysis. Few enhancement techniques like CLAHE, Power Law Transformation, Contrast Stretching and filters like Gaussian, Median and Average Filtering techniques are applied to the MIAS database that has more than 320 images. The obtained results are compared on the basis of statistical parameters like Peak Signal to Noise Ratio (PSNR)and Mean Square Error (MSE)and are presented in this paper. A higher PSNR value relates to the better suitability of the various pre-processing techniques. Keywords— Image Pre-processing, PSNR, Mammogram, Enhancement, Filtering
I. INTRODUCTION
Mammography is widely used method for screening women for detecting breast cancer at the early stage. To improve the accuracy of detection various computer-aided diagnosis (CAD) systems has been developed. Basically there are two process namely Computer-Aided Detection (CADe) and Computer-Aided Diagnosis (CADi). The ability to identify abnormalities and classify the mammogram images as positive and negative detection can be used. When the given image is detected has to be classified as benign and malignant diagnosis can be done. The most important crucial step to be started with in all the image processing applications is Image Enhancement. Image Enhancement is used to improve the perception of information in images. It also modifies the attributes of an image and makes it suitable for a task. Different types of filters are available to remove noise in mammogram images.
II.MATERIALSANDMETHODS
The need for the pre-processing techniques are to improve the image quality by removing noise and unwanted background components of mammogram images. Also there are various enhancement process which helps to improve the contrast and sharpen the images for further processing. The contrast between the normal and malignant tissues will be present but it cannot be viewed by the human directly. Hence enhancement is the basic requirement for perception of images and to provide better 'input' for next process. There are basically two major classifications of enhancement methods namely Spatial Domain and Frequency Domain methods. Spatial domain methods directly deal with pixels of the images. But in frequency domain method initially the image is transferred to frequency domain by calculating the Fourier Transform of the image. Later inverse Fourier Transform is calculated to get the resultant image. These processes are done to modify the brightness, contrast and grey level distribution. As a result, the pixel values of the resultant image is modified based on the transformation function applied to the input image. There are number of image enhancement techniques but for mammogram processing the techniques should not degrade the quality of image or modify existing information content in the image. Image enhancement includes changes in image intensity and contrast. This helps to reduce the noise, removal of back-ground data and to avoid artefacts [1]. Enhancement process can be done to a particular region which helps to increase the contrast between selected region and image back-ground. Some of the common characteristics for any medical images are noise, poor image contrast and presence of unwanted components in the image. All these problems can be rectified using pre-processing techniques. Few Pre-Processing techniques has been discussed below in this paper with comparative result images.
III.FILTERINGMETHODS
Technology (IJRASET)
©IJRASET : All Rights are Reserved
496
give visual interpretation of images that can be further used for computer aided processing. Filters are used to evaluate the value of each pixel in an image. It then revaluates the values based on the transformation applied. The new value would be based on the pixel values that are nearer to the local neighbourhood and a centralized window on that pixel. Filters can be linear or nonlinear types [2]. In linear filters output values are linear combination of pixels on the original image. They are easy to compute and understand but they cannot perform smoothing operation without simultaneously blurring the edges. But nonlinear filters do smoothing without blurring and also detects the edges of the images clearly.
A. Mean or Average Filter
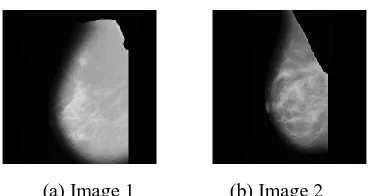
The need for mean filter is to improve the image quality and contrast. So in this filter, each pixel of the image is replaced with the average value of the neighbourhood intensities. It helps to reduce the variance of the image. It is a method of smoothing images by reducing the amount of intensity variation between neigh boring pixels. It operates by moving through the image pixel by pixel and then replaces each value with average value of the neigh-boring pixels. It uses a mask over each pixel in an image. The below shown images are filtered using average filter.
[image:3.612.205.389.452.550.2](a) Image 1 (b) Image 2 Figure 1: Sample for Average Filtered Images
B. Median Filters
A median filter is also a nonlinear filter that helps to remove salt and pepper noise. It also helps to sharpen the edges of the images and also removes noise. Each pixel would be considered and replaced by the median value of its surrounding pixels. The pattern of neighbours is called the "window" that helps to slide pixel by pixel over the entire image [3]. Initially the median value is calculated by sorting pixel values from the window into numerical order. Then it would be replacing the pixel being considered with the median (middle) pixel value. The below shown images are filtered using median filter.
(a) Image 1 (b) Image 2 Figure 2: Sample for Median Filtered Images
C. Gaussian Filters
In Gaussian filter the impulse response is a Gaussian function. It modifies the input signal by convolution with a Gaussian function. The Gaussian smoothing operator is a 2D convolution operator which can be used to "blur" the images and then removes noise and un-wanted detail. It uses a Kernel that is used in image convolutions. Gaussian smoothing can also be computed with a larger standard deviation by convolving image several times with smaller Gaussian [4]. The degree of smoothing can be determined by the standard deviation value of the Gaussian. The output value is a 'weighted average' of each pixel's neighborhood.
IV.ENHANCEMENTMETHODS
Technology (IJRASET)
©IJRASET : All Rights are Reserved
497
A. Un-sharp masking
In this method a fraction of the high-pass filtered image is added to the original image. This method helps to enhance the local change of image intensity and this corresponds to the output of the linear high pass filter works by subtracting the smoothed image from the original image. So it helps to enhance the high frequency components and attenuate low frequency information and gives a more sharpened image. It is a low pass filtered version of the original image and the resultant image is multiplied by a weighing factor and then subtracted from the original image.
B. Contrast Limited Adaptive Histogram Equalisation (CLAHE)
Another well-known technique is Histogram Equalization in which the dynamic contrast range of an image is modified such that the histogram gives the required shape. This entire process is done by using cumulative distributive function as the mapping function. The histogram peaks are stretched and troughs are compressed which indicates changes in intensity level. Type of histogram equalization is Adaptive Histogram Equalization (AHE) that can be used to increase the image contrast. This method computes several histograms that corresponds to each distinct section of the image. So helps to increase the local contrast. But this tends to increase and over amplify the noise in homogeneous regions of an image. Hence an improved version named Contrast Limited Adaptive Histogram Equalization(CLAHE)was introduced which limits the. In this process an image is divided into number of tiles and contrast of each tile is enhanced. During the process histogram is clipped in order to avoid over amplification of noise. The histogram of the output image matches with the Uniform Distribution or Rayleigh Distribution. The Bi-linear interpolation can be used to combine the neighboring tiles which helps to eliminate artificially induced boundaries
C. Morphological Process
The morphological operations are applied to the enhance the images. Erosion and Dilation are the two important operations in the mathematical morphology. In mathematics the sets are defined as combinations of related elements. Similarly, in image processing it is defined as objects. The objects of an image are similar to the sets in Mathematics. One set is full image and another is the part of the image which acts as the structuring element.
V.PARAMETEREVALUATION
In this paper number of contrast enhancement algorithms and filters has been discussed. Numerical quantity analysis can be performed to quantify error, image quality and to study about contrast and brightness. The parameters used to analyse the images are discussed below.
A. Peak to signal ratio
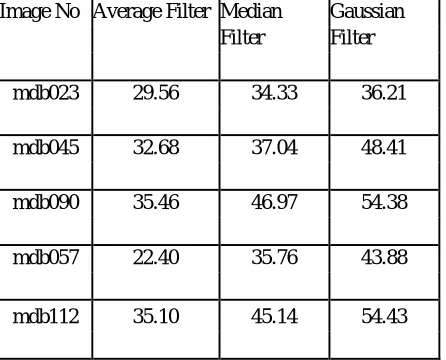
[image:4.612.196.419.519.699.2]It is defined as a measure of de-noising and contrast enhancement, which can be expressed as ratio between maximum possible value (power) of a signal to the power of distorting noise that affects the quality of image. PSNR is usually expressed in terms of the Logarithmic decibel scale
Table 1 Peak Signal to Noise Ratio Values in dB for Different Filtering Techniques Image No Average Filter Median
Filter
Gaussian Filter
mdb023 29.56 34.33 36.21
mdb045 32.68 37.04 48.41
mdb090 35.46 46.97 54.38
mdb057 22.40 35.76 43.88
Technology (IJRASET)
[image:5.612.175.435.101.391.2]©IJRASET : All Rights are Reserved
498
Table 2 Peak Signal to Noise Ratio Values in dB for Various Enhancement Techniques
Methods/ Image No
mdb0
23 mdb045 mdb090 mdb057 mdb112
Unsharp Masking 27.9
8
24.95 47.01 33.89
37.27
Morphological
31.9
7 28.49 30.95 31.89 31.50
Power Law Transformation 55.21 55.9
2 56.48 57.80 54.75
Contrast Stretching 24.3
7 25.77 33.44 18.39 29.50
Contrast Enhanced Adaptive Histogram Equalization 16.9
0 18.88 18.30 20.36 17.10
B. Mean Square error
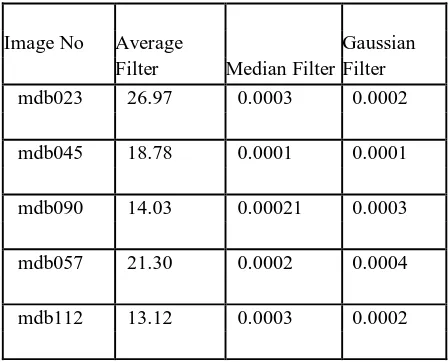
When there are two gray scale images only one of the image would be actual and desired. MSE calculates the average of squares of errors between original and required image. The value would be minimum when both images are almost similar. When it is used to measure the enhancement degree, higher value of MSE indicates a better.
Table 3 Mean Square Error Values for Different Filtering Techniques
Image No Average
Filter Median Filter
Gaussian Filter
mdb023 26.97 0.0003 0.0002
mdb045 18.78 0.0001 0.0001
mdb090 14.03 0.00021 0.0003
mdb057 21.30 0.0002 0.0004
[image:5.612.193.417.503.684.2]Technology (IJRASET)
©IJRASET : All Rights are Reserved
499
Table 4 Mean Square Error Values for Various Enhancement Techniques
Methods/Image No mdb023 mdb04 5 mdb09 0 mdb05 7 mdb11 2
Un sharp Masking
1.38 1.03 0.68 1.27 0.73
Top-Hat Bottom Hat
74.37 137.39 120.60 98.75 123.66
Power Law Trans- formation
24.08 8.95 14.522 15.78 17.97
Contrast Stretching
655.33 890.98 206.98 932.67 435.64
Contrast Enhanced Adaptive Histogram Equalization
981.24 768.68 881.24 748.46 780.34
VI. CONCLUSIONS
The paper analysed and reviewed various enhancement and filtering techniques for MIAS database that has more than 320 images. Statistical parameters PSNR and MSE were used to compare the techniques. From the result it is seen that among the filtering process Gaussian Filtering has highest PSNR values and lower Mean Square Error values. On comparing the enhancement techniques, it is seen that Power Law Transformation has highest PSNR values and Unsharp Masking has lower Mean Square Error Values. So these methods can be used for pre-processing of mammogram images which helps for next process in computer aided detection.
REFERENCES
[1] Jaya Sharma, J. K. Rai and R. P. Tewari (2014) Iden-ti cation of Pre-processing Technique for Enhance-ment of Mammogram Images",International Confer-ence on Medical Imaging, m-Health and Emerging Communication Systems (MedCom),978-1-4799-5097-3/14/2014 IEEE.J. Breckling, Ed., The Analysis of Directional Time Series: Applications to Wind Speed and Direction, ser. Lecture Notes in Statistics. Berlin, Germany: Springer, 1989, vol. 61.
[2] Raman Maini and Himanshu Aggarwal (2010) 'A Com-prehensive Review of Image Enhancement Tech-niques', Journal of Computing Volume 2, Issue 3, ISSN 2151-9617
[3] Karen Panetta, Yicong Zhou, SosAgaian and Hongwei Jia. (2011). Nonlinear Unsharp Masking for Mammo-gram Enhancement, On Information Technology In Biomedicine, Vol. 15, No. 6, November.