5
X
October 2017
Motif Detection Using Numerical Data
Optimization Technique in ECG Signals
Ramandeep kaur1, Balkrishan Jindal2
1
Student of Yadavindra College of Engineering, Talwandi Sabo, Bathinda, Punjab (India) 2Assistant Professor, CE Section, YadavindraCollege of Engineering, GKC, Punjabi University,
Talwandi Sabo, Bathinda, Punjab (India)
Abstract- The motif discovery mechanism is used for the analysis of the ECG signal along with the efficient particle swarm optimization algorithm. In this method motif detection in the ECG signal sequences is presented. The proposed method is based upon the variable length of motif and detected the repetitive patterns in input ECG signal. This method has been visualized to analyse the signal data under the in-depth vigilant analytical method.Optimization of signals in the proposed method is performed by Particle Swarm Optimization technique (PSO) for improving the quality of signals. The data set used in this work is collected from the University of California, Riverside (UCR). The performance of the proposed method is measured using various parameters like Execution time, Precision, Recall and F1-measures. The performance of the proposed method is compared with existing methods in terms of accuracy and execution time. The Execution time and Accuracy of proposed method is in more improved form than the existing methods.
Keywords-Motif detection, Particle Swarm Optimization,ECGSignal analysis, Execution time.
I. INTRODUCTION
Electro Cardio Gram is a diagnosis device that represented the electrical activity of the heart. Electro Cardio Grams delivers the large amount of data relating with the physical position of the heart. The foremost necessary strategies are used in the analysis of cardiovascular problems. Heart related problems are the resultant of many disorders within the heart rate changes, irregularity, and position of origin or conductivity in internal organ which are in the form of electrical term [1]. Categorization in heart condition is a crucial phase in generating devices for observing the fitness of people [1]. Electro Cardio Gram (ECG) is device that is used for the treatment of heart diseases. The monitoring periods which are in larger size, there is the need of compressing is necessary for handling that type of data. This extends the volume of records wherever huge amount of signals are store for observing and evaluation.
he ECG feature abstraction method produces the important patterns that are utilized in the sequence spontaneous examination. The various approaches will be used in the discovery of these patterns. However, representing the signal in a better way or in compressed form is very much important. If any of the abnormality occur in the signal that signifies the heart problems [2].
A. P ripple denotes the magnitude of voltage wave is in lower rate that signifying the depolarizing and shrinkage of the rightward and leftward atria.
B. The transparent P ripple signifies the sinus pulse.
C. Absence of P shape might recommend artery fibrillation, functional beat or chamber beat
D. is terribly troublesomethe analysis of P wavelet of high SNR proportion in Electro Cardio Gram waveform. E. . QRS compositeis the biggest volt level deflection around 10mv.
F. Twentymilli Volt however might variation in magnitude depends upon age, and gender. The V magnitude of wave shape might additionally offer data regarding the cardiac disease
G. Period of the QRS composite specifies how much time required by the ventricles to modify and should provide data regarding conduction issues within the ventricles
H. Largest T ripple might specify the Hyperkalaemia and ischemia.
II. RELATED WORK
Liu et al. [3] explained the Motif detection method for large scale statistics (MDLats). Finding the pattern in time seriesthenthistechnique is used to eliminate the redundancy. This technique worked with the exact and approximate algorithms in the detection of better motifs. The Symbolic Aggregate Approximation (SAX) and Piecewise Aggregate Approximation (PAA) algorithm has been used in the detection of sub sequences.
Harvey et al.[4]explained the automatic features detection for numerical series by using the Genetic technique. Designing of features performed by using various approaches such as Model based, Distance based or Similarity based approaches. Autofead mechanism wasusedfor the automated features. Autofead has the ability to reduce the large features into minimal form of features. In this method, the fitness of population has been calculated by applied various optimum values of parameters.
Melgani et al. [5] explained the classification system of PSO-SVM. Particle Swarm Optimizationisusedtoimprovetheperfrmance rate of the Support Vector Machine classifier. The SVM classifier has been optimized for finding the best parameter value that used with the discriminant function. On the basis of ECG data the experiment was performed. The dataset taken from the MIT-BIH database. The normal and abnormal beats find out in this. For the comparison, the two reference classifiers has been used i.e. K Nearest Neighbour classifier and Radial basis function neural network classifier.
Wang et al. [6]explained the work on the bag-of-words or pattern of ECG data representation for medical specialty time series classification. In this work, the Artificial Neural Network (ANN) and Probabilistic Neural Network (PNN) classifier was used. Time series patterns represented in the form of histograms. The proposed technique treats a statistic as a text document and extracts native segments from the time series as words.
Yasser et al. [7] described the problem of Constrained Motif Detectionusingtwo approaches. MC-Full and MC-Inc has been utilized for solving the constrained motif detection issues in a more effective way. In this, unconstrained motif finding issues are converts in the constrained by applying the change-point detection procedure. The Robust Singular Spectrum Transform compared with ancient Singular Spectrum Transform by applied artificial and real group of data.
III. PROPOSED METHOD
A. Proposed Algorithm
1) Step-1:Select the particular ECG signal from the UCR data set.
2) Step-2: Input initial parameters of minimum and maximum length of motif. 3) Step-3: Set the threshold value for the motif
4) Step-4: Compute the total length variance over the signal. 5) Step-5: Evaluates the fitness value of all signals
6) Step-6: If fitness value recorded higher than personal best value of solutions obtained on other rounds. 7) Step-7: Then update the current PBest as the global best value (g Best).
8) Step-8: Elect the best p Best value in all of the iterations as the global best observed on all iterations in the system 9) Step-9: Observe the velocity of the signals according to the equation (1).\
10) Step-10:Shifting the position of the signals according to the equation (2)
11) Step-11: If the termination criterion is not satisfied then again calculates the fitness value of signals 12) Step-12:Motifs are detected.
[ ] = [ ] + 1∗ ( )∗( [ ]− [ ] + 2∗ ()∗ [ ]− [ ] (1)
[ ] = [ ] + [ ] (2)
Where q[i] is denoted the signal velocity, p R[i] provides the present output for signalsthat are hold in a random way. p B[i] and g B[i] are locally and globally best fitness ranks for every signal correspondingly. Rand () is a random number between (0, 1). CL1, CL2 are learning elements.
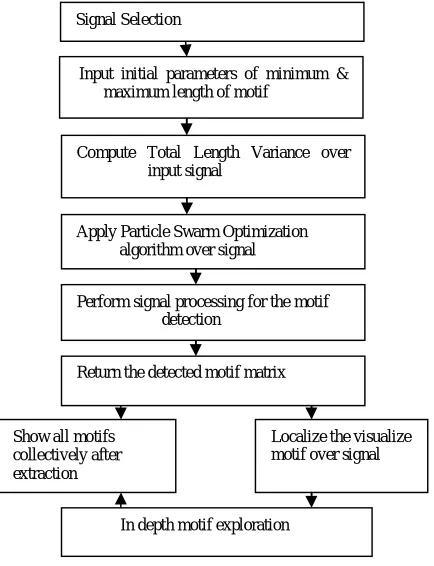
B. The proposed method shows the main three loops of the algorithm.
1) Motif Detection using the Total Length Variance (TLV) method.:Acquisition of the ECG signals take place.The size of signals taken in the form of arrays or in the form of number of rows and columns. Then the initialization of values performed. After this initialize the window size. The size of window is depends upon minimum motif length then run the iterations equals to the
Signal Selection
Input initial parameters of minimum & maximum length of motif
Compute Total Length Variance over input signal
Apply Particle Swarm Optimization algorithm over signal
Perform signal processing for the motif detection
Return the detected motif matrix
Show all motifs collectively after extraction
Localize the visualize motif over signal
[image:4.612.173.390.78.361.2]In depth motif exploration
Total Length Variance (TLV). The signal is acquired according to the length of the signal.Then extracts the values of the signal which are fetched. Then apply the sliding window analysis to find the fittest pattern in the input window.Afterthis finding the pattern of signals in the given data whose value not exceeding the TLV. If that type of pattern is found. Then mark the position of the detected motif. Obtain the motif length then add the position to the position array and add the motif length to length array. The computation of squared distance performed for the classification of the pattern. After this update the best pair for length. Return the motif length and position list.
2) Signal processing for the motif detection.Read the selected ECG wavesignaland converted into the vector form. After this computing the signal drift using the drift error evaluation. The return of drift vector which is equal with the length of the ECG signal. Then eliminate the drift from the original signal. There is the drift freesignal is returned. Then assess the degree of fitness over the signal after the elimination of the drift. Then run the iterations according to number of blocks in the input signal. Input the degree of polynomial up to fourth order then calculate the least squaresand the polynomial value. Get the fittest polynomial coefficients then the shift of each signal block according to the evaluated value. If that is the last iteration then return the signal. Then analyse the R-peaks by utilizing the early stage detection with the usage of relative gradient.In the block based manner, Analysis of the signal coefficients of each curve of themotif.ThendeterminetheRRintervalbetweenthe two R peaks. Identify the first R wave in the signal. Enlist and mark each R wave fter the classification of first R wave. Thenfinish the iterations after identifying the last R wave using the decision rule. Identify the false negative cases. Delineate the sub-signal region in the false negative case by employing the change of slope rate for false positive case elimination. Then apply the median filter once again. Eliminate the base line drift from the final signal.
3) Detection of motif using cross-correlation and variable threshold.Input the signal data with the length of N-entities, step size between the ranges of 0.04 seconds to 0.12 seconds. Then initialize the threshold values for the motif discovery. Find the initial motif according to the input threshold value. After this find out the numerical sequence within the given range by defining the alternative range formed from threshold. Then finalize the training motif length according to the initial pattern discovery. Find out the maximum amplitude pattern in particular window and after that assign the pattern to the training motif data. Find autocorrelation between the signal and training motifs. Then return the detected motif data matrix and motif locate.
IV. RESULTS AND DISCUSSION
The results of the proposed method are presented and discussed. The proposed method is analysed with data set of ECG signals from the University of California, Riverside (UCR). There are 200 ECG signals are used for the analysis. The implementation is performed in the Matlab.The ECG data is the continuous data, which arises every second and received in the fixed length of segments.
The execution time for the motif detection has been recorded in milliseconds for each entry. The proposed method has been tested upon the ECG datasets for the performance evaluation of the motif detection in the terms of Precision, Recall and F1-measure etc.
A. Elapsed Time
The elapsed time is the parameter, which records the overall time taken to perform a specific task. The elapsed time is recorded by measuring the difference of finish time and start time, which can be defined with the following equation:
= ℎ − (3)
B. Precision
The precision is the case giving the statistical accuracy by computing the accuracy against the false positive results. The false positive results represent the false matches produced by the classification algorithm. The precision value predicts the impact of the false positive cases and returns the accuracy of the positive cases. The precision is also known as the sensitivity and elaborated with the following equation:
= ( ) + (4)
C. Recall
Recall is the performance parameter, which computes the true positivity of the results against the false negativity. The recall parameter gives the results by computing the following equation:
D. F1-Measure
The F1-Measure is the cumulative parameter to assess the overall impact of the precision and recall, to study the overall impact of the false positive and false negative cases over the overall accuracy assessed from the preliminary statistical parameters. The F1-score value is represented in the range of 0 to 1 or 0 to 100, decided as per the maximum ranges of the precision and recall. The following equation is utilized to measure the F1-measure:
1 = 2∗ ∗ + (6)
1) Time Oriented Analysis: The proposed method has been analysed for the elapsed time as it becomes the important factor while processing the ECG data discovers the motifs in the given signal set. The proposed method is aimed to improve the elapsed time parameter and has been done better than the existing methods on nearly all of the iterations. The motif discovery has been performed in the minimum time. The proposed method has been analysed for the elapsed time as it becomes the important factor while processing the ECG data discovers the motifs in the given signal set. The proposed method is aimed to improve the elapsed time parameter and has been done better than the existing methods on nearly all of the iterations. The motif discovery has been performed in the minimum time
2) Accuracy Oriented Analysis :The proposed method has been also analysed under the various accuracy oriented parameters, which includes the Precision, Recall and F1-measure. The proposed method has been performed up to the mark as per recorded in the results table. The proposed method represents the variations studied in the Table 2. The proposed method has been found with the value of 89% for recall, 95% for precision and 90.50% for the F1-measure when analysed with the lower bound limit of 80 and upper bound limit of 110. The results of lower bound value of 90 and upper bound of 120 produces the 94% precision,92.30% recall and 93% F1-measure, which is adequately acceptable for the case of motif detection.
3) analysis of proposed method with existing methodsAnalysis in the terms of execution time
The time oriented analysis has been conducted for the comparison of the proposed method with the Brute Force, Moen Keogh, RP-1, RP-2 and MDLats.
Table- 1
Comparative analysis of the proposed method with Brute Force, Moen Keogh, Random Projection- 1, Random Projection- 2 and MDLats in terms of elapsed time at different threshold values.
iterations Execution time (ms)
Brute force [3] eh=80 el=40 Moen Keogh [3] eh=80 el=40 Random projection 1 [3] e=80 Random projection 2 [3] e=40 MDLats [3] eh=80 el=40 Proposed method eh=80 el=40
1 40098 6124 680 783 702 665 2 41522 6843 678 765 670 662 3 49172 6057 669 770 671 663 4 48074 6280 692 778 701 682 5 48270 6081 670 786 676 673 6 48399 6372 674 762 688 672 7 47832 6751 671 789 678 662 8 48407 6306 687 781 697 671 9 48259 6991 690 792 712 676 10 48069 6623 660 776 677 663
improved form than the existing systems. The proposed method ranges between 662 and 682 milli-seconds, whereas the nearest contender Motif Discovery Method for Large Scale Time Series (MDLats) has been found performing between 670 and 712 milli-seconds.The running time of each algorithm is recorded in the table and each algorithm is run ten times, the matrix threshold value is set in each algorithm. The value of threshold is denoted by e. el denotes the lowest threshold value and eh is the highest threshold value. According to the threshold value every algorithm works.Results of the Random Projection (RP-1), RP-2, Motif Discovery Method for Large Scale Time Series (MDLats) and the proposed method are shown in Figure 2 with same dataset. From the experimental results it has been concluded that the proposed method is better than RP-1, RP-2 and MDLats methods in the terms of execution time. The proposed method has been found marginally better than the time oriented values of RP-1and MDLats which shows the marginal differences nearly during all of the iterations to mark the significant improvement.
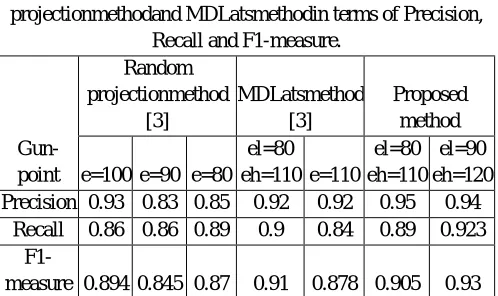
Table-2
Comparative analysis of the proposed method with Random projectionmethodand MDLatsmethodin terms of Precision,
Recall and F1-measure.
Gun-point
Random projectionmethod
[3]
MDLatsmethod [3]
Proposed method
e=100 e=90 e=80 el=80 eh=110 e=110
el=80 eh=110
el=90 eh=120 Precision 0.93 0.83 0.85 0.92 0.92 0.95 0.94
Recall 0.86 0.86 0.89 0.9 0.84 0.89 0.923
F1-measure 0.894 0.845 0.87 0.91 0.878 0.905 0.93
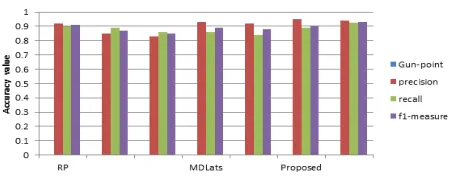
[image:7.612.183.432.429.577.2]The accuracy oriented results show the significant improvement in the proposed method, which has been compared against the two nearest contenders on the basis of the variable upper bound and lower bound ranges. Comparison with Brute Force and Moen Keogh is not feasible on the basis of accuracy. The proposed method has been found efficient in the terms of precision, recall and F1-measure parameters. From experimental results, it has been concluded that the proposed method is better than Random projections and MDLats in terms of accuracy in the Figure 3. This shows the variations between the proposed method, MDLats and Random Projection methods during the comparative analysis.
V. CONCLUSION
In this paper, the study of the motif detection in the ECG signal is presented. Motif discovery mechanism is used for the analysis of the ECG signal based on Particle Swarm Optimization Algorithm. The proposed method improves the detection rate of motifs and the load on the data communication links also reduced. The elapsed time is alsoimproved.In the smaller time periods, the normal and abnormal beats are detected.Particle Swarm Optimization necessitates only primitive and basic mathematical operators as compared with existing techniques; it is computationally cheap in terms of both memory and runtime.
The proposed method has been found efficient in discovering the motifs within the significantly lower time, as it has been recorded with the time span of lower than 686 ms on all of the iterations, which was average motif discovery time for the existing method in the ten iterations. By using the suitable parameters and Particle Swarm Optimization Technique, the proposed method gives better results than the existing techniques.
REFERENCES
[1] Khazaee, A., 2013. Heart Beat Classification Using Particle Swarm Optimization. International journal of Intelligent System and Applications, 5(6): pp. 25-33. [2] Karpagachelvi, S., Arthanari, M. and Sivakumar, M. 2010. ECG feature extraction techniques-a survey approach. 8(1): pp. 76-80.
[3] Liu, B and Chen, Q. 2015.Efficient Motif Discovery for Large-Scale Time Series in healthcare, IEEE Transactions. Industrial informatics, 11(3): pp.583-590. [4] Dustin, Y and Michael, D. Todd. 2015. Automated feature design for numeric sequence classification by genetic programming. Evolutionary Computation,
IEEE Transactions, 19(4): pp. 474-489.
[5] Melgani, F. and Bazi, Y. 2008. Classification of electrocardiogram signals with support vector machines and particle swarm optimization. IEEE transactions.Information technology in biomedicine, 12(5), pp. 667-677.
[6] Kouzani, A and Nahavandi, S. 2013. Bag-of-words representation for biomedical series classification. Biomedical Signal Processing and Control 8(6): pp. 634-644.
[7] Mohammad, Y. and Nishida, T. 2009. Constrained motif discovery in time series.New Generation Computing. 36(1): pp. 319-346.
[8] Fedotov, A and Aleksandra, A.2014.Uncertainties in measurement of nonlinear dynamics in heart rate variability. Proc. of the IEEE International Conference of the International Federation for Medical and Biological Engineering, 19 Feb. Samara, pp. 102-105.
[9] Dustin, Y and Michael, D. Todd.2014.Robust evaluation of time series classification algorithms for structural health monitoring. International Society for Optics and Photonics. 90640(1): pp. 1-8.
[10] Yahyouti, H. and Al-Mutairi, A. 2016.A feature based trust sequence classification algorithm. Information Sciences, 328(3): pp. 455-484. [11] Gabr, M. and Fatehy, M. 2013. Time series classification.Journal of Statistics Applications & Probability. 2(2):pp.123-133.
[12] Chaturvedi, B. and Patil, N.2009.A novel semi-supervised approach for protein sequence classification. Proc. of the IEEE International Conference on Advance Computing.12-13 June.Banglore, pp.1158-1162.
[13] Al-Shrouf, A., Abo-Zahhad, M. and Ahmed, S.M. 2003.A novel compression algorithm for electrocardiogram signals based on the linear prediction of the wavelet coefficients.Digital Signal Processing, 13(4): pp. 604–622.
[14] Khare, A., Saxena, M. and Nerkar, V. 2011. ECG Data Compression Using DWT. International Journal of Engineering and Advanced Technology. 1(1) pp. 2249-8958.
[15] Bendifallah, A., Benzid, R. and Boulemden, M. 2011. Improved ECG compression method using discrete cosine transform, Electronic letters, 47(2):pp.87-89. [16] Kumari, R.S.S. and Sadasivam, V.2007. A novel algorithm for wavelet based ECG signal coding. Computers and Electrical Engineering. 33(3): pp. 186-194. [17] Mehmet, K. and Berat, D.2010. ECG beat classification using particle swarm optimization and radial basis function neural network. Expert Systems with
[image:8.612.187.412.88.178.2]Applications. 37(12): pp. 7563-7569.