5
II
February 2017
Technology (IJRASET)
©IJRASET: All Rights are Reserved
691
691
LabView Based Implementation of Image
Denoising Algorithm using Wavelet Transform
Lovika V. Bhagwatkar1, Kalyani A. Akant2, Milind M. Khanapurkar3
1
Research scholar, 2Associate Professor, 3Professor , Electronics and Telecommunication Department, GHRCE, RTMN University Nagpur
Abstract: Digital image processing has become important in the areas of communication, medicine, remote-sensing, seismology, industrial automation, robotics, aerospace and education. Image denoising is the technique used to remove the noisy components from the image and also to preserve the information carrying components. Noise can be introduced in the image for various reasons as well as in different steps in image processing like image acquisition or image compression. Wavelet transform method using Neigh SURE (Stein’s Unbiased Risk Estimator) thresholding is applied for image denoising because of some distinct advantages offered by the technique like its quantization property. This method will be implemented on LabVIEW. In this method first wavelet transform decomposition is obtained over noisy image to get sub divided components then by thresholding the coefficient is adjust according to thresholding and filter out unwanted noise components. Then by applying inverse wavelet transform the denoised image is reconstructed called derived image. By means of PSNR (Peak Signal to Noise Ratio) and MSE (Mean Square Error) algorithm calculates the performance, quality and accuracy of the resultant image. Keywords— Wavelet Algorithm, Neigh SURE thresholding, Image decomposing, Image processing, LabVIEW.
I. INTRODUCTION
The image processing containing various operations in the field of image compression, edge detection, blurred restoration and denoising. It is the method used to increase value in the appearance of an image restoration, called the image denoising. It was found that output images consist of noise, while data can obtained from the actual world. Ideally this noise may be reduced to minute levels, while in many practical circumstances the signal to noise ratio should be increased to some consequential levels for all practical purposes denoising is a necessity. The level of noise present in the image has two consequences; one is the degradation in the quality of the image, and the second that make the image faint, blurred, dark, and indistinct. Image denoising is removing unwanted noise in order to restore the original image using LabVIEW applying wavelet transform. Corrupted image and problems emerged in any applications in the field of image processing due to presence of noise is very crucial problem, hence it was dedicated to image restoration. This included not only the image removal technique but also the image enhancement techniques to highlight the image in certain portions. Due to such noisy components present in the image are not compatible with human visibility, so we have to take priority for reducing the noise as low as possible. Thus, the algorithm which reduces and eliminate noise in the image is called image denoising.
Wavelet Transform is recently adopted technology which is more advantageous than Fourier Transform (FT), Discrete Sine Transform (DST) and the Discrete Cosine Transform (DCT). Wavelet is an algorithm with the components like decomposition, thresholding and reconstruction of the original image. There are tremendous applications in the area of image denoising which are used in scientific and engineering technology fields, medical science, Security and military services.
The proposed algorithm has introduced to be able to regenerate noisy and hazy images. It can be manipulate blurring only without noise, because the noise present at high frequencies. Wavelet transformation compares among low frequency and high frequency elements, thus it pretended that it has no effect of noise at low frequencies. The algorithm gives the resultant image and the quality of it is identified by measuring PSNR and MSE by comparing original image.
Technology (IJRASET)
©IJRASET: All Rights are Reserved
692
692
A. NI LabView
The NI LabVIEW stands for National Instrument Laboratory Virtual Engineering Workbench. LabVIEW offers a graphical coding to create an application. It offers a platform for designing a system virtually. It is also called as “G” which refers that coding is to be done in a graph form. LabVIEW programs are called as virtual instruments because it creates the hardware design/model on software platform. LabVIEW can be categorized into two main programming: Data flow programming and Graphical programming. The components of LabVIEW consist of namely acquisition, analysis and display. The three major aspects are required to complete a VI are,
front panel of LabVIEW Block diagram of LabVIEW Icon/connector
The LabVIEW files are not any text files but they use an extension called Virtual Instrument file or VI file. This VI is only executable in LabVIEW only.
B. Noise
A noise can be said to be an anomaly which is introduced in the image during the steps of image processing like acquisition, compression or segmentation etc. This noise is an unwanted element in the image which produces undesired effects in the original image like blurring or grainy effect in the image. There are various types of noise can be introduced in the image which degrades and reduces the quality and precision of noise.
C. Gaussian Noise
Gaussian noise is an additive noise which can be represented as
( , ) = ( , ) + ( , ) (1)
Where q(x, y) is the original image, r(x, y) is the noise introduced in it and u(x, y) is the resulting corrupt image. The above equations are formulated at the pixel level. The additive nature finds its application in image morphing whereas the multiplication represents the brightness variation. Gaussian noise is an evenly spaced noise with bell shaped distribution function.
II. WAVELET TRANSFORM
A. Wavelet Decomposition
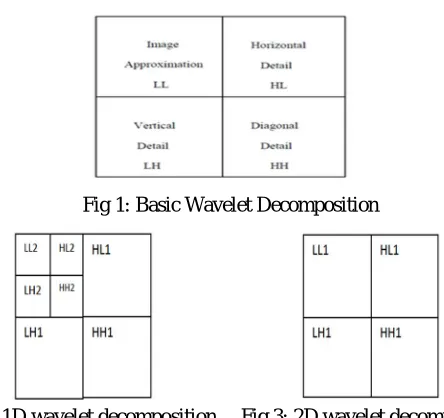
In Wavelet Transform the image is divided into low and high frequency components. The conversion into subcomponents mostly depend upon the characteristic and properties of defined image. These obtained subcomponents are approximate details like average, horizontal details, vertical details and diagonal details. These are the decomposed details of the image after application of DWT.
[image:3.612.191.413.492.701.2]Fig 1: Basic Wavelet Decomposition
Technology (IJRASET)
©IJRASET: All Rights are Reserved
693
693
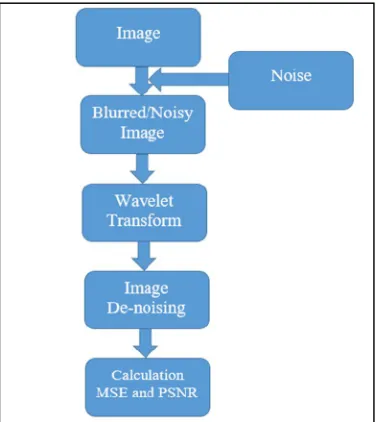
This wavelet decomposition is implemented through LabVIEW VI. It consists of various level of decomposition. Basic 1D decomposition of an image is shown in Fig.2. For 2D decomposition the LL1 in Fig.3 is again decomposed into low and high frequency components. Likely for 3D, 4D, 5D,…..nD wavelet decomposition.
III. METHODOLOGY
A. Algorithm for Image Denoising
[image:4.612.213.402.209.420.2]This is the basic algorithm shown in Fig. 4 to be used in the image denoising using the wavelet transform with Neigh SURE. It consists of six different stages starting from noising the clean image to reconstructing the original image by using inverse wavelet transform. The thresholding is the most important step in the algorithm which in this case is neigh shrink with SURE. It is the common architecture which is followed in every denoising algorithm using wavelet transform.
Fig 4: Algorithm for image denoising using wavelet transform with Neigh SURE
B. Neigh SURE Thresholding Method
The technique which is used in our algorithm is a soft thresholding method known as the neighborhood shrinking or neigh shrink method. The neigh shrink method is used with SURE thresholding to form a new hybrid method by combining the two methods and using the selected parameters of the two techniques to achieve superior performance.
Fig 5: An Illustration of the Neighboring Window of size 3× 3 surrounding the Wavelet Coefficient to be Shrinked
The neigh shrink is a pixel level shrinking method which directly works on the spatial level of the image. In the neigh shrink a threshold is calculated by getting the median magnitude of the pixel value surrounded by the neighboring window, and then modifying all the components inside the window by replacing original value with the median value.
Technology (IJRASET)
©IJRASET: All Rights are Reserved
694
694
denotes the pixel of the image. Now, we considered Aij is a neighboring window of xij. The value of i and j gives location of coordinates of the pixel. Fig.5 shows neighboring window of size 3×3 surrounding the wavelet coefficient.
Let,
, =∑( , ) (2) Where, m and n are neighbouring window’s co-ordinate.
The shrinked wavelet coefficient is given by,
, = , , (3) The shrinkage factor is given by,
, = (1− / ) (4) The T is the universal threshold which is given by,
= 2 ( ) (5)
Where r denotes the length of signal and σ denotes noise variance of signal.
The neigh shrink is effective in removing the noise but due to application of only one threshold throughout the whole window will average the pixel values in window, thus any high or low contrast showing pixels like edge showing will get smoothen and lowers its sharpness hence will lose the image information. Also due to same window size for all the values will mean that even if they are low energy pixels they will also have to parse through premium threshold. Due to these drawbacks neigh shrink have tendency to smoothen the edges of the image.
IV. DESIGN AND IMPLEMENTATION
The design and implementation of an algorithm for image denoising technique using wavelet transform with Neigh SURE. The software platform which is used is LabVIEW.Designing of an algorithm is done in LabVIEW with input default test images. It is implemented in LabVIEW with the simulation results containing denoised images with their PSNR and MSE value. The LabVIEW implementation is done on the wavelet denoising using SURE and normal threshold.
A. Image Denoising Algorithm in LabVIEW
The image denoising algorithm is implemented in the LabVIEW platform. This is a basic denoising algorithm which uses the SURE shrink as the thresholding. It requires the advanced signal processor toolkit.
B. Clean Image
[image:5.612.198.440.639.716.2]
Fig 6: WA Data Sample VI
Technology (IJRASET)
[image:6.612.229.387.98.177.2]©IJRASET: All Rights are Reserved
695
695
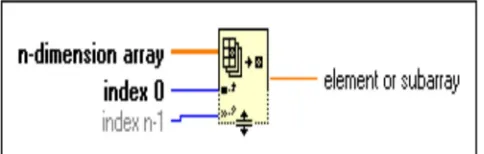
Fig 7: Index Array and Reshape Array VI
[image:6.612.217.395.254.330.2]The clean image 2D array is first downsized into 1D array sequence of 32 bits using Array size VI which returns the number of elements in each dimension of array. This array is given to multiple array element VI which samples the image array. The output is also given to the index array VI which converts any n-dimensional array into sub-arrays.
Fig 8: Gaussian White Noise VI
The sampled image is given as input to the Gaussian white noise VI. It is the most important VI which controls all the noise parameters of the Gaussian noise. With input of samples of image and the standard deviation or variance it gives output Gaussian distributed pseudorandom noise pattern. The output noise is given to the reshape array which converts it in the 2D array sequence. Finally with the help of adder, the input of clean image and noise are added to produce noisy image corrupted with Gaussian noise.
C. Wavelet Transform Decomposition
Fig 9: WA Integer Wavelet Transform VI
The output noisy image 2D sequence is given as input to the WA Integer Wavelet Transform VI. This VI has the inputs of decomposition levels and wavelet selection options like Haar and bior wavelets. Control is created at both these inputs so level of decomposition and choice of wavelet can be chosen. An error constant is also given as input. As output it gives out error, the decomposed image and an Integer wavelet transform coefficient sequence.
D. Image Denoising and Reconstruction
[image:6.612.218.396.437.511.2] [image:6.612.220.395.621.708.2]Technology (IJRASET)
©IJRASET: All Rights are Reserved
696
696
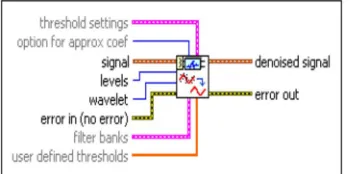
The output Integer Wavelet Transform coefficients is given to WA Integer Wavelet Transform VI which converts the IWT sequence into a 2D image array signal. This signal is given to the WA Denoise VI which has the input of image signal, threshold settings which can be set to SURE, hybrid, normal or minmax thresholdings. The most efficient is SURE so we chose it. Another control is given to the inputs of levels and wavelet to select our desired settings. Error constant is also given as input. The output is the denoised image signal.
V. Calculation of MSE and PSNR
Fig 11: VI For the calculation of MSE and PSNR
After the denoised image is obtained, it is analyzed to calculate the MSE and PSNR of that image. For MSE, the denoised image is subtracted from the original image. Then the result is multiplied with itself to get the square and sum of all values then this result is divided by the total number of elements in the row and columns of the image or number of pixels to obtain MSE in dB.
The PSNR is the measure of sound to noise fidelity of the system. It is calculated by taking log of the base 10 of the pixel value 255 and dividing it with MSE to get PSNR in db.
The PSNR used to calculate the noise fidelity of the image is given by, PSNR (db) = 10log10 (255)2 /MSE
MSE is the mean square error and shows the average square error between clean image and one with error, lower the MSE higher the denoising performance.
= ( ( , )− ( , ))
,
Where, Q and D are the dimensions of image, Ib is original basic image and Ir is the resultant denoised image. i and j are the co-ordinates of the image.
V. EXPERIMENTAL RESULTS
Simulation results of image denoising algorithm are shown below. The experimental trials are applied on LabVIEW default test images available like Camera Man, Finger Print, Iris Flower and Lake Image of resolution 512 ×512 in gray scale. The noise which is added to original test image is of Gaussian nature. Then, the image is decomposed to 2D by taking wavelet transform. These wavelet coefficients are modified according to neigh shrink with SURE.
A. Simulation Results in LabView
The front panel of the VI shows the result images like the Selected Image, Image corrupted with noise, Image Decomposition, Reconstructed Image then Finally Denoised Image.
Technology (IJRASET)
©IJRASET: All Rights are Reserved
697
697
Fig 13: LabVIEW Front Panel of Image Denoising Algorithm of Finger Print Image with variance=20
[image:8.612.90.529.48.424.2]Fig 14: LabVIEW Front Panel of Image Denoising Algorithm of Iris Flower Image with variance=30
Fig 15: LabVIEW Front Panel of Image Denoising Algorithm of Lake Image with variance=40
B. Performance With PSNR and MSE on LabView
IMAGES VARIA NCE
PSNR MSE TIME
OF EXECUT
ION (MS)
CAMERA MAN
10 38.470 2
37.4702 274
20 34.600 1
90.8920 273
30 32.426 8
149.918 275
40 31.108 2
203.102 0
275
FINGER PRINT
10 33.378 4
120.421 281
20 31.237 4
Technology (IJRASET)
©IJRASET: All Rights are Reserved
698
698
30 29.855 4
271.017 275
40 28.854 1
341.294 279
IRIS FLOWER
10 36.937 3
53.0653 286
20 33.966 7
105.166 272
30 32.270 5
155.413 277
40 31.182 7
199.652 284
LAKE
10 37.402 47.6366 286 20 33.569
6
115.233 278
30 31.576 4
182.336 6
279
40 30.020 7
260.897 292
VI. CONCLUSION
This Paper, shows the implementation of the algorithm with modified Neigh SURE shrink which performs better than its predecessor. It can also be noticed that the algorithm implemented on LabVIEW gives better performance and accuracy with respect to PSNR and MSE. The coding in LabVIEW is simple and gives better results in terms of PSNR and MSE. It also has an advantage that it require less processing power and consumes less time for execution.
REFERENCES
[1] Fadil A. Ali, “Labview with DWT for Denoising The Blurred Biometric Images” International Journal on Computational Sciences & Applications (IJCSA) Vol.4, No.3, June 2014
[2] Binsheng Wu Handan and Chaozhi Cai Handan, “Wavelet Denoising and Its Implementation in LabVIEW”, China International Conference, 2009
[3] Poonam Kaur, Prof. R.K. Sharma, “LabView Based Design of Heart Disease Detection System” IEEE International Conference on Recent Advances and Innovations in Engineering, Jaipur, India (ICRaIE-2014)
[4] Meenal Bhatia, and Swati.R.Dixit, “Edge Detection for X-Ray Image using LabVIEW”, International Journal of Advanced Research in Computer and Communication Engineering, March 2016
[5] Ms. Jignasa M. Parmar, Ms. S. A. Patil, “Performance Evaluation and Comparison of Modified Denoising Method and the Local Adaptive Wavelet Image Denoising Method”, International Conference on Intelligent Systems and Signal Processing (ISSP) 2013
[6] Varsha.A, Preetha Basu, “An Improved Dual Tree Complex Wavelet Transform based Image denoising using GCV thresholding"2014 First International Conference on Computational Systems and Communications (ICCSC) | 17-18 December 2014 | Trivandrum
[7] D.Srinivasulu Reddy, Dr.S.Varadarajan, Dr.M.N.Giriprasad, M. Sadasiva," A Novel Approach To Image Denoising Using Diversity Enhanced Wavelet Transforms", Advanced Computing Technologies (ICACT), 2013 15th International Conference on Year: 2013
[8] Sameer Khedkar, Kalyani Akant, Milind M. Khanapurkar, “ IMAGE DENOISING USING WAVELET TRANSFORM”, International Journal of Research in Engineering and Technology (IIJRET), April 2016
[9] Shuo Zhang, Yongqian Li, Xingrong Li, Zhi Yang, Lijuan Zhao, “System of Synchronous Averaging De-noising Based on Labview”, International Conference on MultiMedia and Information Technology, 2008
[10] Manish Yadav, Swati Yadav, Dilip Sharma ,"Image Denoising using Orthonormal Wavelet Transform with Stein Unbiased Risk Estimator "Electrical, Electronics and Computer Science (SCEECS), 2014 IEEE Students' Conference on Year: 2014.