International Journal of Emerging Technology and Advanced Engineering
Website: www.ijetae.com (ISSN 2250-2459,ISO 9001:2008 Certified Journal, Volume 4, Issue 8, August 2014)
311
Effect of Light intensity and Temperature on Crystalline
Silicon Solar Modules Parameters
A. El-Shaer
1, M. T. Y. Tadros
2, M. A. Khalifa
3 1Physics Department, Faculty of Science, Kafr El-Sheikh University, Kafr El-Sheikh, Egypt
2,3Physics Department, Faculty of Science, Mansoura University, Mansoura, Egypt
Abstract— It is significant to understand the effect of the
light intensity and temperature on output performance of the crystalline solar modules. Therefore, it is possible to evaluate the J-V curves of solar module under various environmental conditions. This paper discuses the effect of light intensity and temperature on performance parameters of mono-crystalline and poly-crystalline silicon solar module. The experiments have been carried out under a solar simulator for various intensity levels in the range 0.2-1.0 Sun and 10–50oC, respectively. The results of the two modules indicated that light intensity has a dominant effect on current parameters. It is found that photocurrent; short circuit current and maximum current have been increased linearly with increasing light intensity. So, concentrating system may be regarded as a best choice to enhance the power output of solar system. The power density of the mono-crystalline and poly-crystalline silicon solar module increased from 8.96 and 7.72 mW/cm2 to 46.72 and 40.4 mW/cm2 for light intensity 0.2 and 1 Sun respectively. On the other hand, it has been observed that module temperature has a dramatic effect on voltage parameters. Open circuit voltage and maximum voltage are decrease with increasing module temperature. So, the maximum power density of the mono-crystalline and poly-crystalline silicon solar module decreased from 43.4 and 48.76/cm2 to 36.32 and 41.88mW/cm2 for temperature 10oC and 50oC respectively.
Keywords— Crystalline Silicon Solar Modules, Light Intensity, Module temperature, J-V characteristics
I. INTRODUCTION
Solar energy is one of the most promising renewable energy since it provides an unlimited, clean and environmentally friendly energy [1]. Sunlight is by far the largest carbon-free energy source on the planet. More energy from sunlight strikes the Earth in 1 hour (4.3 x10²⁰J) than all the energy consumed on the planet in a year (4.1 x10²⁰J).one of its drawback is that it is considered as a dilute energy since the solar flux is rarely have a value more than 1 KW/m2 in the very hot regions in the earth [2]. Therefore, to overcome this disadvantage, it is important to use modules from solar cells for the technological applications. The solar energy converts into three forms of energy such as electricity, chemical fuel, and heat energy [3]. The conversion of sunlight to electrical energy occurs by solar modules.
Solar module is a collection of a solar cell which is a device that converts the sunlight directly into direct current (DC) of electrical energy by the photovoltaic phenomena. Among various solar module devices, the Si solar module was first developed, and is still the most widely used photovoltaic device, occupying more than
90% of the solar market nowadays [4] because of the
advantages of the Si material over any other materials, such as martial stability, high crystal quality, non-toxic and its crystalline form has an almost ideal band gap for solar energy conversion, i.e. Eg=1.11 eV. Therefore, Silicon has dominated most solar module applications for almost 60 years. The solar irradiation and light intensity are changed daily, due to the rotation of the earth around its own axis, which cause the consequence variation of day and night, and seasonally due to the rotation of the earth around the sun in an elliptical orbit [2]. All solar module parameters, including short-circuit current, open-circuit voltage, fill factor, efficiency and impact of series and parallel resistances are changed due to changing the light intensity and temperature. Therefore, it is important to study the effect of the light intensity on the output performance of the solar module. In this work, a detailed experimental investigation of module parameters with light intensity and temperature has been carried out. The steady state current–voltage(J–V) characteristics of a silicon p–n junction module is often described based on one diode model as given in the following equation:
sh R
s R J V
nkT s R I V q Exp o J ph J J
1 ) (
(
(1)
(1)
Where q is the elementary charge (1.6x10⁻¹⁹Coulomb),
V is the measured module voltage, k is the Boltzmann’s constant (1.38x10⁻²³ J/K) and T is the temperature in Kelvin. Eq.(1) consists of different parameters known as, the light generated current density (Jph), the reverse
saturation current density (Jo), the diode ideality
factor (n), the series resistance (Rs) and parallel
resistance (Rsh) . These parameters have a dominant
International Journal of Emerging Technology and Advanced Engineering
Website: www.ijetae.com (ISSN 2250-2459,ISO 9001:2008 Certified Journal, Volume 4, Issue 8, August 2014)
312
The performance of the solar module, characterized by the values of the short circuit current density (Jsc), open
circuit voltage (Voc), fill factor (FF) and efficiency (η) of
the solar module [5] can be determined. The large values
of Jsc give the maximum power generated by solar
module. The open circuit voltage (Voc) occurs when there
is no current passing through the module, i.e. V (at I=0). Large Voc gives the maximum power generated by solar
module and is given by.
ln 1
o J
ph J
q KT oc V
(2)
Fill factor (FF) is a measure for the quality of the solar
module. It is the ratio of maximum power density (Pmax)
to the theoretical power density (Pt). Large FF means
maximum power generated by solar module.
oc V sc J
m V m J
FF
(3)
Efficiency (η) is the ratio of the electrical output power (P
out) compared to the solar input power (Pin). Efficiency
is related by Jsc, Voc and FF,
in oc sh
in out
P
V
J
FF
P
P
(4)
Where Pinis the power of the incident light, i.e. Pin is the
product of the incident light irradiance, measured in W/m2
or in suns (1000 W/m2), at the surface area of the solar
module (m2). In real modules power is dissipated through
the resistance of the contacts and through leakage currents around the sides of the device. These effects are equivalent electrically to two parasitic resistances in series and in parallel with the equivalent circuit of solar
module. For an ideal module, Rsh would be infinite and
would not provide an alternate path for current to flow, while Rs would be zero, resulting in no further voltage
drop before the load [6]. Most of silicon solar modules are designed to work under normal sunlight and their performances are evaluated at 25oC under an air mass (AM) 1.5 and solar irradiation intensity of 1 Sun.
II. EXPERIMENTAL WORK
In this work; a detailed experimental study of all solar module parameters for commercial mono and poly crystalline silicon under different light intensity and temperature. A solar simulator was used to carry out the experiments under any constant light intensity and temperature.
The light source unit contains the xenon lamp (150W), power supply for the lamp and all necessary optics to simulate sunlight. Two commercial solar modules are used in this study mono-crystalline silicon and poly-crystalline silicon. The module displays under the xenon lamp in the solar simulator.
The standardization of the xenon lamp was performed with respect to the solar spectrum before carry out the experiments by using sensor. The temperature unit was
used to adjust a constant temperature from 0 to 60oC for
the solar module. Therefore this unit is connected to J-V measurement system to measure the effect of actual light intensity at constant temperature The J–V characteristics of the modules were measured with the help of a "KEITHLEY 2400" Source Meter. The experiments were carried out in the light intensity range 0.2-1.0 Sun with temperature was adjusted at 25oC and temperature from 10 to 50oC with light intensity 1 Sun.
III. RESULTS AND DISCUSSION
A. Effect of light intensity on modules parameters
The solar simulator has been calibrated and the
module temperature has been adjusted to 25oC via
the temperature unit. Under the steady-state conditions, the J–V and power-voltage (P-V) characteristics have been obtained for each module with light intensity as shown in Figure (1, 2). A similarity in the characteristics of mono- and polycrystalline silicon solar modules was found. For the two modules, the short circuit current JSC
increases with increasing the light intensity and decreases with increasing the module voltage. For intensity 1 Sun, the Jsc is about 33.7 mA/cm2 and 34.8 mA/cm2 for the mono- and poly-crystalline modules respectively. At the same above light intensity, the Jsc decreases [7] with
increasing the voltage VOC up to 2.44 and 2.08 Volt
respectively.
0.0 0.4 0.8 1.2 1.6 2.0 2.4 2.8
0.00 0.01 0.02 0.03
0.04 (a)
1.0Sun 0.8Sun 0.6Sun 0.4Sun 0.2Sun
Voc
0.2 Sun 0.4 Sun 0.6 Sun 1.0 Sun
0.8 Sun
J
(A
/
C
m
2)
V (volt)
Cell type = mono C-Si
International Journal of Emerging Technology and Advanced Engineering
Website: www.ijetae.com (ISSN 2250-2459,ISO 9001:2008 Certified Journal, Volume 4, Issue 8, August 2014)
313
0.0 0.4 0.8 1.2 1.6 2.0 2.4
0.00 0.01 0.02 0.03 0.04
(b)
1.0Sun 0.8Sun 0.6Sun 0.4Sun 0.2Sun
Jsc
Voc
Cell type = poly C-Si
0.2 Sun 0.4 Sun 0.6 Sun 0.8 Sun 1.0 Sun
J
(A
/
C
m
2)
[image:3.595.71.250.154.318.2]V(volt)
Fig. 1: The J-V curves of: (a) Mono C-Si and (b) Poly C-Si for Tc=25 oC at different light intensities.
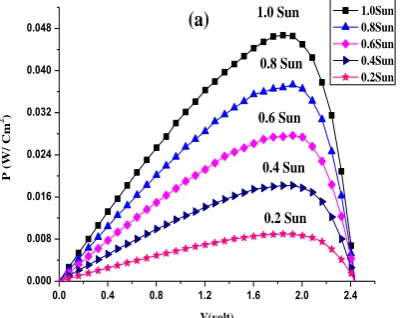
Figure 2 shows that the maximum power density for the two modules increases with increasing the light intensity. The maximum power density of the mono- and the poly-crystalline modules for light intensity=0.2 Sun was only 8.96 mW/cm2 and 7.72 mW/cm2, respectively. Increasing the light intensity to be 1 Sun causes the increase of the power by 80% to reach values 46.72
mW/cm2 and 40.4 mW/cm2. So, concentrating system
may be regarded a better choice to enhance the output power of solar systems [8].
0.0 0.4 0.8 1.2 1.6 2.0 2.4
0.000 0.008 0.016 0.024 0.032 0.040
0.048 (a)
1.0Sun 0.8Sun 0.6Sun 0.4Sun 0.2Sun
P
(W/
C
m
2)
V(volt)
0.8 Sun 1.0 Sun
0.6 Sun
0.4 Sun
0.2 Sun
0.0 0.4 0.8 1.2 1.6 2.0 2.4
0.000 0.008 0.016 0.024 0.032 0.040 0.048
(b)
1.0Sun0.8Sun 0.6Sun 0.4Sun 0.2Sun
0.6 Sun 0.8 Sun 1.0 Sun
0.4 Sun
0.2 Sun
P
(W/
C
m
2)
[image:3.595.323.525.157.318.2]V(volt)
Fig. 2: The P-V curves of: (a) Mono C-Si and (b) Poly C-Si for Tc=25 oC at different light intensities.
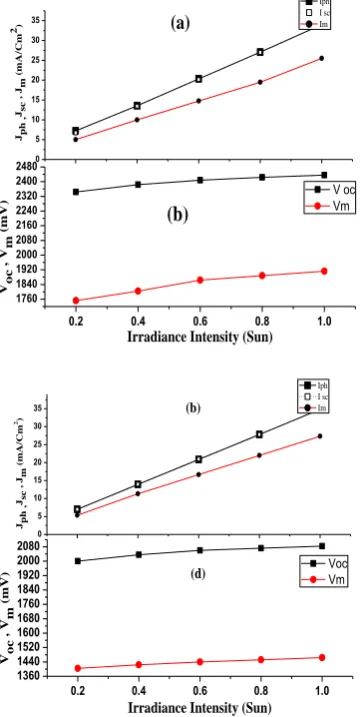
The dependence of the current parameters with light
intensity for the two modules is shown
in Figure 3(a, c). It can be easily to say that current parameters of silicon solar module are highly dependent on the light intensity level. Although the values of Jsc for
the mono- and the poly-crystalline modules for light
intensity 0.2 Sun were only 6.7 mA/cm2 and 6.9 mA/cm2,
respectively, their values increases to be 33.7 mA/cm2
and 34.8 mA/cm2 for intensity 1 Sun. Current parameters
increase linearly with increasing light intensity. A similar result has been theoretically and experimentally verified by numerous works [9-12]. The values of Jph and Jsc are
very close to each other or even the same for both mono- and the poly-crystalline modules.
Figure 3(b, d) illustrates the dependence of voltage parameters, for the two modules, on the light intensity. It has been found that voltage parameters of each module demonstrated a small rise with increasing light intensity.
The values of Voc for the mono- and the poly-crystalline
modules for light intensity = 0.2 Sun was 2.344 V and 1.999 V, respectively. These values were slightly raised to be 2.43V and 2.08 mV for light intensity =1 Sun.
[image:3.595.60.261.496.655.2]International Journal of Emerging Technology and Advanced Engineering
Website: www.ijetae.com (ISSN 2250-2459,ISO 9001:2008 Certified Journal, Volume 4, Issue 8, August 2014)
314
0 5 10 15 20 25 30 35
0.2 0.4 0.6 0.8 1.0
1760 1840 1920 2000 2080 2160 2240 2320 2400 2480
(a)
Iph I sc Im
Jph
,J
sc
, J
m
(
mA
/C
m
2)
(b)
V oc Vm
Irradiance Intensity (Sun)
Voc
, V
m
(mV
)
0 5 10 15 20 25 30 35
0.2 0.4 0.6 0.8 1.0 1360
1440 1520 1600 1680 1760 1840 1920 2000 2080
(d) (b)
Iph I sc Im
Jp
h
,
Jsc
, J
m
(
mA
/C
m
2)
Voc Vm
Irradiance Intensity (Sun)
Voc
, V
m
(mV
[image:4.595.69.251.152.511.2])
Fig. 3: Light intensity dependency of current and voltage parameters of: Mono C-Si (a, b) and Poly C-Si (c, d) Therefore, concentrating systems such as Fresnel lenses and Booster mirrors can be used to enhance photocurrent, short circuit current and maximum current values of module.
The dependence of efficiency on light intensity, for the two modules, is shown in Figure 4. It has been found that the efficiency of each module demonstrated a small increase with light intensity [13].
The fill factor of the mono- and the poly-crystalline modules was 68% and 44%, respectively and kept constant with change of light intensity.
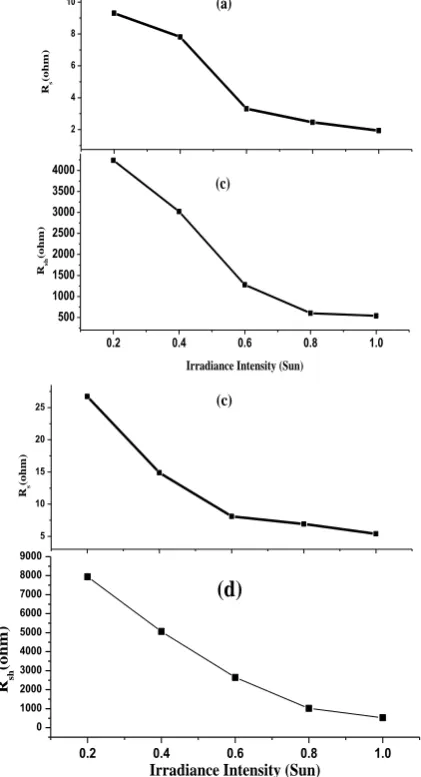
Figure 5(a, c) shows the dependence of series resistance with light intensity for the two modules. It has been found that the series resistance, of each module, decreases with increasing light intensity due to the increase in conductivity of the active layer with the increase in the light intensity [1].
The dependence of parallel resistance with light intensity for each module is shown in Figure 5(b, d). It has been found that the parallel resistance for the two modules decreases with light intensity. This decrease can be explained in terms of a combination of tunneling and trapping of the carriers through the defect states in the space charge region of the device. These defect states either act as recombination centers or traps depending up on the relative capture cross sections of the electrons and holes for the defect [1, 14, 15].
0.2 0.4 0.6 0.8 1.0
9.5 10.0 10.5
11.0 (a)(a)
Eff
e
c
ie
n
c
y (
%)
Irradiance Intensity (Sun)
0.2 0.4 0.6 0.8 1.0
8.0 8.5 9.0 9.5
(b)
Irradiance Intensity (Sun)
Eff
e
c
ie
n
c
y (
[image:4.595.330.514.270.601.2]%)
Fig. 4: Light intensity dependency of efficiency of: (a) Mono C-Si and (b) Poly C-Si
B. Effect of temperature on modules parameters
International Journal of Emerging Technology and Advanced Engineering
Website: www.ijetae.com (ISSN 2250-2459,ISO 9001:2008 Certified Journal, Volume 4, Issue 8, August 2014)
315
2 4 6 8 10
0.2 0.4 0.6 0.8 1.0 500
1000 1500 2000 2500 3000 3500 4000
(c) (a)
R
s
(ohm
)
Irradiance Intensity (Sun)
R
sh
(ohm
)
5 10 15 20 25
0.2 0.4 0.6 0.8 1.0
0 1000 2000 3000 4000 5000 6000 7000 8000 9000
(c)
Rs
(ohm
)
(d)
Irradiance Intensity (Sun)
Rsh
(oh
m
[image:5.595.62.273.163.552.2])
Fig. 5: Light intensity dependency of series and parallel resistance of Mono C-Si (a, b) and Poly C-Si (c, d)
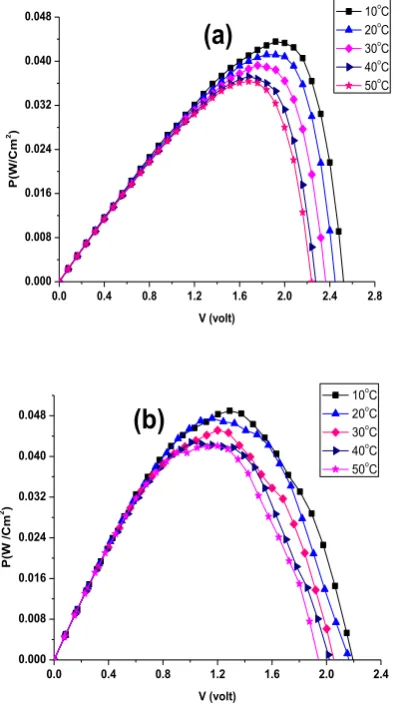
Figure 7 shows the variation of the maximum power density with module temperature. It has been found that the maximum power density of the two modules decreases with increasing module temperature, where the maximum power density of the mono-crystalline and the poly-crystalline modules for temperature=10oC was
43.4 mW/cm2 and 48.76 mW/cm2, respectively.
Increasing the temperature to 50oC causes the decrease of
the power by 25% and 14% to reach values 36.32
mW/cm2 and 41.88 mW/cm2 respectively.
So, the poly-crystalline silicon solar module is better than mono-crystalline silicon for hot area.
0.0 0.4 0.8 1.2 1.6 2.0 2.4 2.8 0.000
0.005 0.010 0.015 0.020 0.025 0.030 0.035
10o
C 20oC
30oC
40o
C 50o
C
I(
A
/C
m
2)
V (volt)
Cell type = mono c-Si
Isc
Voc
(a)
0.0 0.4 0.8 1.2 1.6 2.0 2.4 0.00
0.01 0.02 0.03 0.04 0.05
0.06
(b)
10o
C 20oC
30oC
40oC
50oC
Cell type = poly C-Si
J
(A
/C
m
2)
V (volt)
Fig. 6: The J-V curves for light=1.0 Sun at different temperatures of (a) Mono C-Si and (b) Poly C-Si
The dependence of the current parameters with
temperature for the two modules is shown
in Figure 8(a, c). It can be to say that current parameters of silicon solar module are slightly affected with temperature. Although the value of Jsc for the
mono-crystalline module for temperature=10oC were 29.4
mA/cm2, this value decreases to be 29.07 mA/cm2 for temperature=50oC. Decrease of Jsc by about 1% with
increasing module temperature. The value of Jsc for the
poly-crystalline module for temperature=10oC were
[image:5.595.337.513.177.522.2]International Journal of Emerging Technology and Advanced Engineering
Website: www.ijetae.com (ISSN 2250-2459,ISO 9001:2008 Certified Journal, Volume 4, Issue 8, August 2014)
316
0.0 0.4 0.8 1.2 1.6 2.0 2.4 2.80.000 0.008 0.016 0.024 0.032 0.040 0.048
(a)
10o
C 20o
C 30o
C 40o
C 50o
C
P
(W
/C
m
2)
V (volt)
0.0 0.4 0.8 1.2 1.6 2.0 2.4 0.000
0.008 0.016 0.024 0.032 0.040
0.048
(b)
10oC
20oC
30o
C 40o
C 50o
C
V (volt)
P
(W
/
C
m
[image:6.595.327.520.142.509.2]2)
Fig. 7: The P-V curves for light=1.0Sun at different temperatures of (a) Mono C-Si and (b) Poly C-Si
Increase of Jsc by about 1% with increasing module
temperature can be attributed to the band gap Eg decreases. On the other hand, the decrease in Jm arises
from the dramatic drop in voltage parameters [16]. For any value of module temperature, the difference between Jsc and Jm of mono-crystalline module has been found to
be smaller than that of the poly-crystalline module. This result indicates that the mono-crystalline module is more appropriate for the ideal module definition.
21 22 23 24 25 26 27 28 29 30
10 20 30 40 50
1600 1800 2000 2200 2400 2600
Jsc
, J
m
(
m
A/Cm
2)
I sc Im
(a)
(c)
V oc Vm
Tc (oC)
Voc
, V
m
(
m
V
)
36 38 40 42 44 46 48 50 52 54 56 58 60
10 20 30 40 50
1200 1400 1600 1800 2000 2200
(c)
Jsc
, J
m
(
m
A/Cm
2)
I sc Im
(d)
Vm Voc
Voc
, V
m
(
m
V
)
[image:6.595.60.266.148.503.2]Tc (oC)
Fig. 8: Module temperature dependency for current and voltage parameters of Mono C-Si (a, b) and Poly C-Si (c, d) Figure 8(b, d) shows the variation of the voltage parameters with temperature. It has been found that voltage parameters of each module decrease with increasing temperature. The values of Voc and Vm for the
mono-crystalline module decreases from 2.52V and
1.94V at temperature=10oC to 2.24 V and 1.65V at
temperature=50oC. About 11% and 14.7% decrement in
Voc and Vm, respectively has been determined. The
values of Voc and Vm for the poly-crystalline module
decreases from 2.2V and 1.3V at temperature=10oC to
International Journal of Emerging Technology and Advanced Engineering
Website: www.ijetae.com (ISSN 2250-2459,ISO 9001:2008 Certified Journal, Volume 4, Issue 8, August 2014)
317
About 11.3% and 14.4% decrement in Voc and Vm,
respectively has been observed. It can be noted from the results that the temperature has a crucial impact on voltage parameters of solar module rather than the current parameters [17].
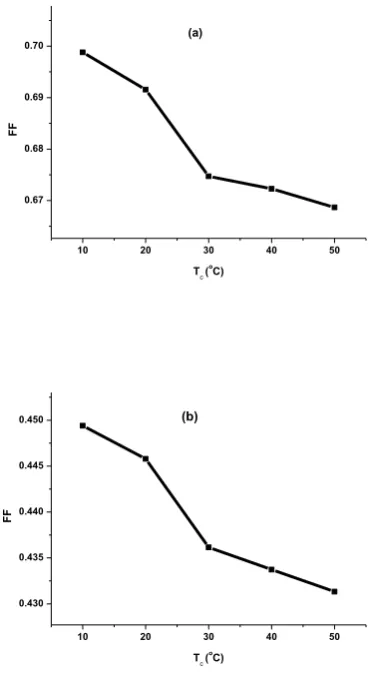
The dependence of fill factor with temperature for each module is shown in Figure 9. It has been found that the fill factor of each module also demonstrated a decrease with temperature increases [1]. The dependence of efficiency with temperature for each module is shown in Figure 10. It has been found that the efficiency of each module demonstrated a decrease with temperature [1,18].
10 20 30 40 50
0.67 0.68 0.69 0.70
Tc (o
C)
FF
(a)
10 20 30 40 50
0.430 0.435 0.440 0.445 0.450
FF
Tc (o
C)
[image:7.595.336.508.151.435.2](b)
Fig. 9: Module temperature dependency of fill factor of: (a) Mono C-Si and (b) Poly C-Si
10 20 30 40 50
8.5 9.0 9.5 10.0 10.5 11.0
(a)
Tc ( o
C)
Effe
c
ie
n
c
y
(%
)
10 20 30 40 50
8.5 9.0 9.5 10.0 10.5 11.0
(a)
Tc ( oC)
Effe
c
ie
n
c
y
(%
[image:7.595.64.252.289.627.2])
Fig. 10: Module temperature dependency for efficiency of: (a) Mono C-Si and (b) Poly C-Si
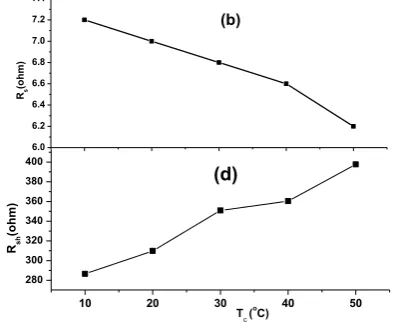
Figure 11(a, c) shows the dependence of series resistance on temperature for the two modules. It has been found that the series resistance of mono-crystalline module demonstrated a small increase with temperature increases, while the poly-crystalline module shows a small decrease with temperature.
1.0 1.2 1.4 1.6 1.8 2.0
10 20 30 40 50
500 1000 1500 2000
Rs
(oh
m
)
(a)
(c)
Rsh
(o
h
m
)
[image:7.595.332.537.548.735.2]International Journal of Emerging Technology and Advanced Engineering
Website: www.ijetae.com (ISSN 2250-2459,ISO 9001:2008 Certified Journal, Volume 4, Issue 8, August 2014)
318
6.0 6.2 6.4 6.6 6.8 7.0 7.2 7.4
10 20 30 40 50
280 300 320 340 360 380 400 Rs
(o
h
m
)
(b)
(d)
Tc (
o
C)
Rsh
(o
h
m
[image:8.595.67.265.145.308.2])
Fig. 11: Module temperature dependency of series and parallel resistance of: Mono C-Si (a, b) and Poly C-Si (c, d)
The dependence of parallel resistance with
temperature for each module is shown in Figure 11(b, d). It has been found that the parallel resistance of mono-crystalline module decrease with temperature.
The parallel resistance of poly-crystalline module increase with temperature. This increase can be attributed to the existence of local in-homogeneities leading to non-uniform current flow or to the charge leakage a cross the p-n junction in the module [1].
IV. CONCLUSION
Accurate knowledge of solar module performance parameters from the measured J–V characteristics is very important for the quality control and the performance assessment of solar system. In this paper, light intensity and temperature dependency of output performance parameters of mono-crystalline silicon and poly-crystalline silicon solar modules has been experimentally investigated. The results of the two modules indicated that light intensity has a dominant effect on current parameters. Short circuit current and maximum current are increase linearly with increasing light intensity. So, the maximum power density output increased by 80% with increasing light intensity from 0.2 Sun to 1.0 Sun. On the other hand, it has been observed that module temperature has a dramatic effect on voltage parameters. Open circuit voltage and maximum voltage are decrease with increasing module temperature. So, the maximum output power density decreased by 25% and 14% for the mono-crystalline and poly-crystalline silicon with
increasing module temperature from 10oC to 50oC. From
the results obtained, it can be concluded that the best way to improve the performance of solar system is maximizing the light intensity falling on the solar module’s surface to enhance the maximum output power of solar system.
And also, to avoid the drop in open circuit voltage and maximum voltage, module temperature should be kept as low as possible.
Acknowledgment
This study was supported by Egyptian Science and Technological Development Fund (STDF), call name: Renewable Energy Research Program, Project ID: 1473.
REFERENCES
[1] Cuce E, Cuce P and Bali T. An experimental analysis of light intensity and temperature dependency of photovoltaic module parameters. Applied Energy 2013;111:374–382
[2] Foster R, Ghassemi M, Cota A. Solar energy-renewable energy and the environment, Taylor and Francis Group, 2010.
[3] George W. Crabtree and Nathan S. Lewis. Solar energy
conversion Physics Today 2007;60.
http://dx.doi.org/10.1063/1.2718755
[4] http://article.sapub.org/10.5923.j.ep.20120203.03.html
[5] Antonio Luque and Steven Hegedus). Handbook of Photovoltaic Science and Engineering, John Wiley and Sons, 2003.
[6] Van E, Meyer EL. Analysis of the effect of parasitic resistances on the performance of photovoltaic modules. Renewable Energy 2004;29:333–44.
[7] Guptaa B, Shishodiaa PK, Kapoor A, Mehraa RM, Sogab T, Jimbob T and UmenocM. Effect of light intensity and temperature on the I-V characteristics of n-C/p-Si heterojunction. Solar Energy Materials & Solar cells 2002; 73:261–267.
[8] Meng T, Zhang C, Liu C and Meng S. Experimental Study of Light Intensity on I-V Characteristic of Single Crystalline Silicon Solar Module. Advanced Materials Research 2012;418-420: 725-1728.
[9] Khan F, Singh SN and Husain M. Effect of light intensity on module parameters of a silicon solar module. Solar Energy Materials & Solar cells 2010;94:1473–6.
[10] Cuce PM and Cuce E. A novel model of photovoltaic modules for parameter estimation and thermodynamic assessment. Int J Low-Carbon Technol 2012;7(2):159–65.
[11] Srivastava T and Sudhakar K. Energy and exergy analysis of 36 W solar photovoltaic module. Int J Ambient Energy 2013. http://dx.doi.org/10.1080/01430750.2013.770799.
[12] Cuce E and Bali T. Variation of module parameters of a p-Si PV module with different solar irradiances and module temperatures in humid climates. In:Fourth International Exergy, Energy and Environment Symposium, Sharjah, United Arab Emirates, April19–23,2009.
[13] Chen Y, Wang X, Li D, Hong R, &Shen, H. Parameters extraction from commercial solar cells I–V characteristics and shunt analysis. Applied Energy2011;88(6):2239-2244.
[14] Kassis A, Saad . Analysis of multi-crystalline silicon solar modules at low light levels using a modified two-diode model. Solar Energy Materials & Solar cells 2010; 94: 2108–2112. [15] Chegaar M, Hamzaoui A, Namoda A, Petit P, Aillerie M and
Herguth A. Effect of light intensity on solar modules parameters. Energy Procedia 2013;36:722 – 729
[16] Radziemska E. The effect of temperature on the power drop in crystallinesilicon solar cells. Renew Energy 2003;28:1–12. [17] Rodriguez D, Horley P, Hernandez J, Vorobiev V, Gorley N.
Photovoltaic solar modules performance at elevated temperatures. Solar Energy 2005; 78:243–250.