R E S E A R C H
Open Access
2× genomes - depth does matter
Michel C Milinkovitch
1*, Raphaël Helaers
2, Eric Depiereux
2, Athanasia C Tzika
1,3, Toni Gabaldón
4Abstract
Background:Given the availability of full genome sequences, mapping gene gains, duplications, and losses during evolution should theoretically be straightforward. However, this endeavor suffers from overemphasis on detecting conserved genome features, which in turn has led to sequencing multiple eutherian genomes with low coverage rather than fewer genomes with high-coverage and more even distribution in the phylogeny. Although limitations associated with analysis of low coverage genomes are recognized, they have not been quantified.
Results:Here, using recently developed comparative genomic application systems, we evaluate the impact of low-coverage genomes on inferences pertaining to gene gains and losses when analyzing eukaryote genome evolution through gene duplication. We demonstrate that, when performing inference of genome content evolution, low-coverage genomes generate not only a massive number of false gene losses, but also striking artifacts in gene duplication inference, especially at the most recent common ancestor of low-coverage genomes. We show that the artifactual gains are caused by the low coverage of genome sequenceper se rather than by the increased taxon sampling in a biased portion of the species tree.
Conclusions:We argue that it will remain difficult to differentiate artifacts from true changes in modes and tempo of genome evolution until there is better homogeneity in both taxon sampling and high-coverage sequencing. This is important for broadening the utility of full genome data to the community of evolutionary biologists, whose interests go well beyond widely conserved physiologies and developmental patterns as they seek to understand the generative mechanisms underlying biological diversity.
Background
In the context of investigating correlations between gen-ome and phenotype evolution, describing the evolution of genome content (in terms of protein-coding genes) should theoretically be straightforward given the increasing number of available sequenced genomes and of large-scale expression studies, accompanied by a con-stantly growing number of software and databases for better integration and exploitation of this wealth of data. However, this endeavor of mapping gene gains (includ-ing duplication events) and losses suffers from the lack of explicit phylogenetic criteria in analytical tools, and the overemphasis, in genome sequencing programs, on detecting conserved genome features.
The first problem relates to the fact that many of the methods and databases available for identifying duplica-tion events and assessing orthology reladuplica-tionships of
genetic elements among genomes avoid the heavy com-putational cost of phylogenetic trees inference and the difficulties associated with their interpretation, even though phylogeny-based orthology/paralogy identifica-tion is widely accepted as the most valid approach [1-4]. Recently, however, the problem has been largely recog-nized and increasingly addressed by the comparative genomics community. For example, ENSEMBL [5,6] and the ‘phylome’approach [7,8] are automated pipelines in which orthologs and paralogs are systematically identi-fied through the estimation of gene family phylogenetic trees. Furthermore, the recently developed MANTiS relational database [9] integrates phylogeny-based orthology/paralogy assignments with functional and expression data, allowing users to explore phylogeny-driven (focusing on any set of branches), gene-phylogeny-driven (focusing on any set of genes), function/process-driven, and expression-driven questions in an explicit phyloge-netic framework. Such application systems should help in investigating whether the gene duplication phenom-enon is generally relevant to adaptive evolution (that is,
* Correspondence: [email protected] 1
Laboratory of Artificial and Natural Evolution (LANE), Department of Zoology and Animal Biology, Sciences III, 30, Quai Ernest-Ansermet, 1211 Geneva 4, Switzerland
beyond the classical examples of, for example, globins, olfactory receptors, opsins, and transcription factor diversifications), and might even help in understanding the causal relationships between genome evolution and increasing phenotypic complexity. However, the effi-ciency of these analytical tools inescapably depends on the amount and quality of the available genome sequence data. This leads us to the second, more perva-sive problem of biases in whole genome sequencing pro-gram strategies.
Sequencing and analyzing the complete genome of a eukaryotic species is a formidable and challenging task, and the human genome project [10,11] will probably remain a landmark in the history of science. Incentives for sequencing genomes of non-human species mirror historical motives for selecting laboratory model species: the potential power of these species for understanding human biology and generating biomedically relevant data. This criterion has generated a striking taxonomic bias in the choice of model species and sequencing pro-jects [12]. For example, only 3% of full-genome sequen-cing projects use the localization of the corresponding
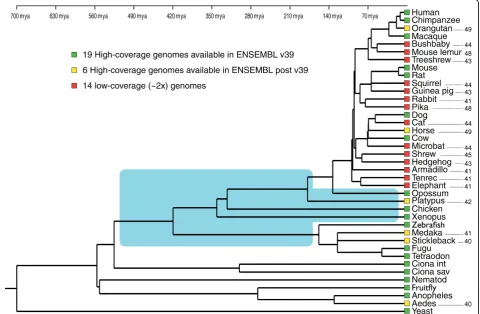
species in the tree of life as a primary motivation [13]. As a result, prominent databases like ENSEMBL [14], which generates and maintains automatic annotation of selected eukaryotic genomes, included 25 mammalian and 5 teleost fish genomes, but only one bird, one amphibian, and no reptile in its version 49 (Figure 1).
[image:2.595.59.540.368.682.2]One major explicit goal of genome sequencing pro-jects is that comparisons of the human genome with those of other eukaryotes allow detection of coding and non-coding conserved (hence, likely functional) elements in the human genome. Importantly, the statistical power of such comparisons depends on the sum of branch lengths of the phylogenetic tree among the species used [15]. However, it is likely that a significant proportion of these possibly biomedically relevant conserved features are recent and thus specific to relatively shallow branches (for example, mammals, eutheria, primates) rather than common to all eukaryotes. In that case, the only way to increase statistical power is to increase the number of sequenced genomes for species belonging to the monophyletic group defined by the relevant shallow branch. This realization has motivated the development
Figure 1Phylogeny among the 39 species whose genomes are available in version 49 of the ENSEMBL database. Approximate age of nodes is from [34]. The area shaded in blue indicates long branches in vertebrates that should preferentially be interrupted by the sequencing of additional full genomes. Levels of sequence coverage are color-coded and numbers on the right of the tree indicate the ENSEMBL version in which the species appeared for the first time in the gene family trees. Mya, million years ago.
Milinkovitchet al.Genome Biology2010,11:R16 http://genomebiology.com/2010/11/2/R16
of the ‘Mammalian Genome Project’ [16] aiming at sequencing the genome of multiple placental mammals with a low mean coverage of 2×. The sequenced species were chosen to maximize the ratio [Sum of branch lengths within mammals]/[Number of genomes sequenced]. Note that the decision to choose the placen-tal mammal branch is somewhat arbitrary: there is noa priori reason to believe that there are more (or more important) Eutherian-specific than, for example, Ther-ian-specific biomedically relevant conserved features, and sequencing a few well-chosen marsupial species would have generated more cumulative branch length for less species. However, this decision might have been motivated by the facts that using a shallower branch will facilitate annotation of the newly sequenced genomes and that some of the chosen species are laboratory model species.
We think that the emphasis on searching for evolu-tionary conservation - hence, the decision to prefer 24 low-coverage (2×) genomes to, for example, 6 genomes at 8× coverage, hurts more general endeavors, such as the mapping of gene gains and losses in the evolution of eukaryotic genomes. Although the inherent limitations associated with low coverage genome analyses are recog-nized [15], their impact on understanding differences among organisms (rather than similarities) has not been quantified.
Here, we evaluate the impact of low-coverage gen-omes on inferences pertaining to gene gains and losses when analyzing the mode and tempo of eukaryote gen-ome evolution through gene duplication. Such assess-ments are important for broadening the utility of full genome data to the community of evolutionary biolo-gists, whose interests go well beyond widely conserved physiologies and developmental processes/patterns as they seek to understand the generative mechanisms underlying biological diversity.
Results and Discussion
On the basis of the 38 metazoan genomes (longest splice-variant of each protein-coding gene) available in version 49 of the ENSEMBL database (that is, six pri-mates, one tree shrew, four rodents, two lagomorphs, two carnivores, one perissodactyl, one cetartiodactyl, one bat, two insectivores, one xenarthran, two afrother-ians, one marsupial, one monotreme, one bird, one amphibian, five teleost fishes, two urochordates, one nematode, and three insects), and using the baker’s yeast as an outgroup, we used MANTiS version 1.0.15 [17] to generate two datasets including information on the presence/absence of genes. The first dataset (’families only’) contains one character for each single (species-specific) gene and for each protein family (that is, onlyde novo gains are considered), whereas in the
second dataset (’with duplications’), a new character was additionally created for each duplication event, such that each protein family is represented by several characters. Additional details are given in [9]. To investigate the influence of low-coverage (2×) genomes on inferred gen-ome evolutionary patterns, we also generated with MANTiS the corresponding datasets using versions 39 to 48 of ENSEMBL (Figure 1) and the human phylome [8], available at [18]. The ENSEMBL v39 archive data-base includes 18 metazoan species with 7 placental mammal genomes of coverage >4 (except for the rhesus macaque,Macaca mulatta), whereas subsequent ver-sions include an increasing number of low mean cover-age (2×) genomes (v49 includes 38 metazoan species with 24 placental mammal genomes, of which 14 are of 2× mean coverage). The PhylomeDB database uses only high-coverage genomes and an improved phylogenetic pipeline that includes alignment trimming, branch-length optimization, evolutionary model testing, and maximum likelihood and Bayesian phylogeny inference (see Materials and methods for details).
the insectivore or the lagomorph nodes). The two remaining low coverage genomes (bushbaby and mouse lemur) suffer less artifactual losses probably because a large number of false losses have been assigned to dee-per ancestors of these two species and because annota-tion of these genomes was greatly facilitated by the use of the high-quality human genome.
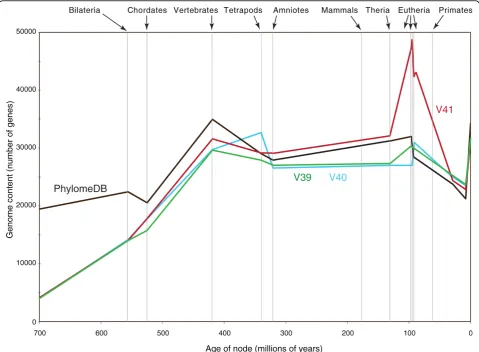
We used MANTiS to map genome size against evolu-tionary time (for the lineage leading to human) for var-ious versions of the ENSEMBL database and for the Phylome database. These analyses indicate that the addi-tion of low-coverage genomes (appearing in version 41 of ENSEMBL) generate the high, and probably
artifactual, rate of gene gains in the first eutherian branches, whereas the presence of an increased rate of gene gains in the vertebrate branch is robust to the removal of low-coverage genomes (Figure 4).
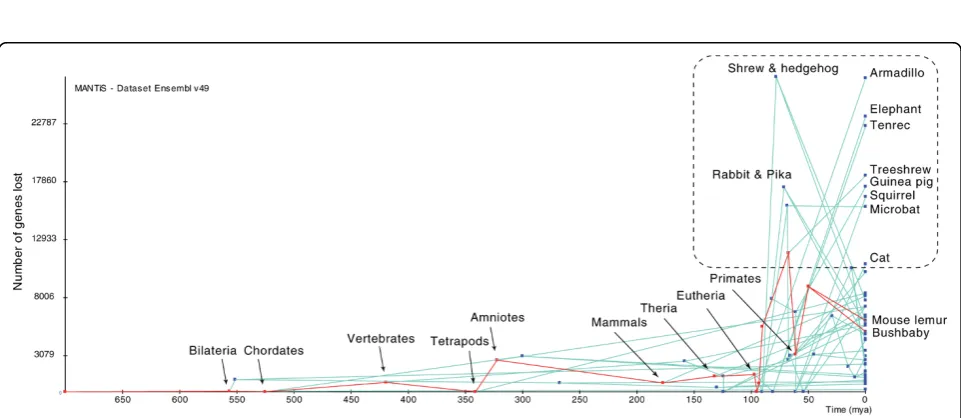
[image:4.595.58.537.88.284.2]Although the interrupted and missing genes in 2× coverage genomes are likely to generate false losses (Fig-ure 3), they have no obviousa priorireason to cause an artifactual increase in duplication events in deeper branches. Similarly, although errors in draft genomes can cause misassemblies and unmerged overlaps -hence, causing errors in the orthology assignment of genes through false positives (artificial duplications) -the phenomenon should not specifically impact -the Figure 2Increase of genome size through evolutionary time for all lineages of the tree in Figure 1. The red line indicates the lineage leading to the human genome. The left and right dashed lines indicate the branches leading to the vertebrate and the first eutherian node, respectively. Mya, million years ago.
Figure 3Mapping of losses through evolutionary time for all lineages of the tree in Figure 1. The red line indicates the lineage leading to the bushbaby and mouse lemur genomes. The 12 other low-coverage genomes are framed (dashed line). Mya, million years ago.
Milinkovitchet al.Genome Biology2010,11:R16 http://genomebiology.com/2010/11/2/R16
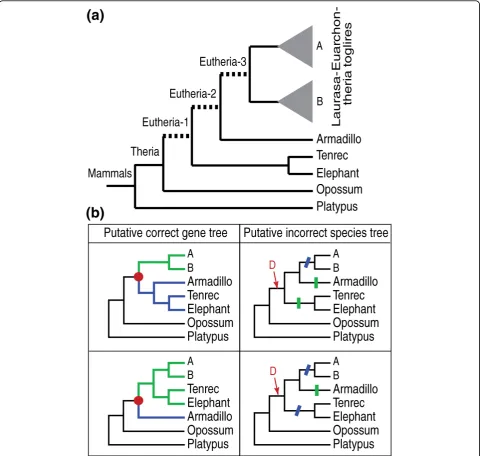
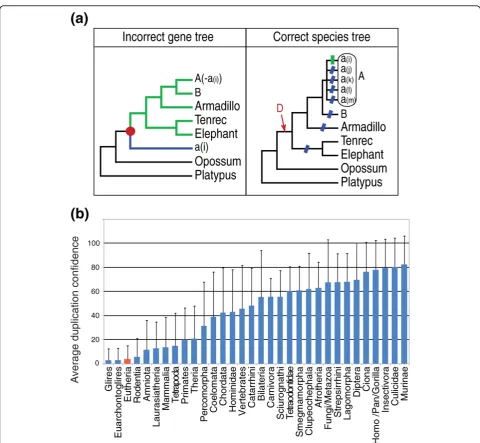
[image:4.595.56.537.326.535.2]three first eutherian branches more than shallower branches (low coverage genomes are distributed all across the eutherian tree). Note that the eutherian branch, as defined in version 39 of ENSEMBL, is cut in three parts in subsequent versions of ENSEMBL by the addition of the Afrotheria (elephant and tenrec) and the Xenarthra (armadillo) lineages (Figure 5a). A possible explanation for the artifactual peak of gains in the eutherian branches would be that the supposedly true phylogenetic position of Afrotheria and Xenarthra is incorrect: true gene tree versus wrong species tree reconciliation would then generate false duplication events in the first eutherian branch followed by losses (Figure 5b). However, mapping gains and losses in MANTiS after implementing the three possible topolo-gies among the outgroup, Afrotheria, Xenarthra, and Laurasiatheria plus Euarchontoglires did not remove the artifactual peak of gains in the eutherian branches
(Figure 6), although the use of the different species trees generated a different distribution of these changes among the three eutherian branches (Figure 6, inset). We performed again reconciliation of all ENSEMBL gene trees with the species phylogeny in which nema-todes and arthropods form a monophyletic group. This generated some differences in gains and losses mapping in the base of the tree but did not remove the artifactual peak in the eutherian branches (green curve in Figure 6).
[image:5.595.58.538.89.441.2]the species tree. As the sequence coverage, nucleotide by nucleotide, or gene per gene, is (to our knowledge) not publicly available, we counted the number of ambi-guities in each protein sequence of each species and found that 2× genomes exhibit higher mean proportions of ambiguities, ranging from 9.11% (Ochotona princeps) to 15.46% (Dasypus novemcinctus), compared to 0 to 0.24% in high coverage genomes. However, we did not observe a higher mean proportion of ambiguities (for
neither 2× nor high-coverage genomes) in genes inferred as duplicated in the three first eutherian branches than in genes inferred as duplicated elsewhere in the species tree.
[image:6.595.58.541.89.545.2]One could argue that many of the artifactual gains in the eutherian nodes might not be caused by the low coverage of 2× genomesper sebut are rather simply the product of increased taxon sampling in a very biased and small portion of the species tree: increasing the Figure 5Possible artifactual gains and losses due to reconciliation between a correct gene tree and an incorrect species tree.(a) Addition of the armadillo and afrotherian (elephant and tenrec) genomes in version 41 of ENSEMBL cut the eutherian branch in three parts;(b) If the species tree (right column) is incorrect, reconciliation with correct gene trees (two alternative topologies are given) will generate false duplication events (red dot on gene tree and‘D’on species tree) in the first eutherian branch followed by losses (vertical green bars for loss of the green duplicate, oblique blue bars for loss of the blue duplicate) in various branches.
Milinkovitchet al.Genome Biology2010,11:R16 http://genomebiology.com/2010/11/2/R16
number of mammalian species reduces the lengths of already short branches, hence increasing the risk of mis-placing at least one lineage in gene trees and generating false gains and subsequent false losses. For example, any duplication node labeled‘Eutheria’with a single ‘orphan’ species on one side of the duplication node (blue branch in Figure 7a) is suspicious as it implies one duplication event in the basal eutherian branch and multiple losses in shallower branches. The reality of the duplication event is even more questionable when the orphan spe-cies is absent from the upper side of the duplication node (green subtree in Figure 7a) as it requires recipro-cal complementary gene losses (a quite unlikely phe-nomenon indeed). We screened all 26,467 trees in the ENSEMBL database and found that 2× genomes contri-bute significantly more (0.005 < P-value < 0.016; one-tail Mann-Whitney test) than good quality genomes to such suspicious topologies (Table 1). Note also that the four species highest in the list (shrew, hedgehog, pika, and guinea pig) are far from the base of the eutherian tree and are therefore unlikely to be represented by
orphan sequences. Statistical significance is not due to the basal Afrotherian and armadillo taxa as removing these species from the list even reduces theP-values to 0.001 to 0.007. Finally, for assessing the validity of inferred duplication nodes, we used the species-overlap score of all 115,451 duplication nodes (in the 26,467 ENSEMBLE trees) defined as the fraction of shared spe-cies over the total of spespe-cies in post-duplication nodes [8] (equivalent to the ‘duplication consistency score’ in [1]). Figure 7b indicates that duplications at the euther-ian node exhibit one of the three worst confidence values (mean ± standard deviation = 3.7 ± 11.5) among all nodes in the species phylogeny.
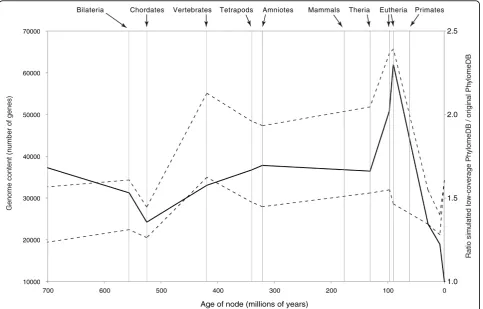
[image:7.595.59.540.90.403.2]observed in real low-coverage sequences. All sequences were then re-aligned and all 19,361 gene trees were reconstructed and analyzed in the same way as the non-perturbed PhylomeDB dataset. Figure 8 indicates that our hypothesis is verified: the introduction of ambiguities in three of the seven eutherian species generates errors in the inference of gene trees that, in turn, produce spurious duplications events. These artifacts are distributed in var-ious places in the species tree, but the most impacted nodes are clearly the basal eutherian lineages (Figure 8).
Conclusions
[image:8.595.57.538.84.527.2]We argue that the phylogenetic distribution of species for which so-called ‘full genome sequences’ are avail-able, as well as the coverage of these genomes, are key parameters that have not been given enough apprecia-tion: it will remain exceedingly difficult to differentiate artifacts from true changes in modes and tempo of genome evolution until better homogeneity in both taxon sampling and high-coverage sequencing is achieved. For example, the groups of Amphibia (frogs, Figure 7Possible artifactual gains and losses due to reconciliation between an incorrect gene tree and a correct species tree.(a)Gene trees with a single eutherian species (a(i)) on one side of a duplication node (red dot) and several species on the other side (especially ifa(i)is
absent from that side) are highly suspicious (Table 1). Such an incorrect gene tree will gen-erate one false duplication on the basal eutherian lineage followed by multiple false losses (vertical green and oblique blue bars).(b)Average duplication confidence (and standard de-viation) for all duplication nodes on all 26,467 gene trees from the ENSEMBL version 49 da-tabase. The eutherian node is highlighted in red.
Milinkovitchet al.Genome Biology2010,11:R16 http://genomebiology.com/2010/11/2/R16
toads, salamanders, newts, and caecilians) or Reptilia (turtles, lizards, crocodiles, and birds) exhibit larger diversities than mammals but have long been repre-sented in major databases such as ENSEMBL by a sin-gle species (Xenopus tropicalis, and Gallus Gallus, respectively) at the tip of a very long branch. The recent inclusion (since ENSEMBL v53) of the high-coverage genome sequences from the green anole lizard (Anolis carolinensis) and zebra finch ( Taeniopy-gia guttata) are, in this respect, very important for improved mapping reliability of genome content evolu-tion in the amniote tree. Similarly, including some of the missing major animal lineages (for example, Lophotrochozoans such as annelids, molluscs, and flat worms) is crucial if reliable analysis is to be extended to the whole group of Metazoa. However, major arti-facts in gene gains and losses (and possibly others that we did not uncover here) will remain until all
low-coverage genomes are promoted to high low-coverage. Note that very recent (generally species-specific) dupli-cations will remain very difficult to differentiate from parental alleles even in high-coverage genomes.
[image:9.595.66.539.99.465.2]Obviously, the artifactual gains and losses of dupli-cates discussed here are problematic only for a subset of comparative genomic analyses. For example, these arti-facts are of low relevance for the specific and significant purpose behind the initial production of low-coverage genomes: detecting conserved genome features [15]. Furthermore, these artifacts had little impact on analyses that uncovered historical constraints in gene expression [23], despite these analyses requiring the determination of the first appearance of genes and duplicates in the species phylogeny. However, artifacts in mapping of genome content evolution will likely mislead many users who access genomic databases, possibly resulting in a wave of unreliable analyses.
Table 1 Number of dubious duplications at the eutherian node involving various species as‘orphans’
Species Isolated sp(i) sp(i)versus >5 sp(i)versus >5 - no sp(i) sp(i)versus >10 sp(i)versus >10 - no sp(i)
2× coverage genomes
Sorex araneus 621 591 581 563 557
Erinaceus europaeus 565 531 523 498 493
Ochotona princeps 376 343 337 308 302
Cavia porcellus 344 308 302 280 274
Echinops telfairi 272 246 235 237 227
Myotis lucifugus 192 168 156 146 137
Tupaia belangeri 192 159 150 132 126
Spermophilus tridecemlineatus 182 142 140 110 108
Oryctolagus cuniculus 149 114 108 93 88
Otolemur garnettii 125 100 97 79 76
Loxodonta africana 109 77 64 70 59
Microcebus murinus 112 90 86 62 59
Felis catus 98 73 70 57 54
Dasypus novemcinctus 15 6 0 4 0
High-coverage genomes
Bos taurus 200 168 131 148 112
Canis familiaris 156 120 94 93 71
Mus musculus 129 100 94 75 70
Equus caballus 134 110 78 86 58
Rattus norvegicus 73 52 37 37 28
Pongo pygmaeus 34 25 21 17 14
Macaca mulatta 62 44 24 28 14
Pan troglodytes 24 13 7 10 5
Homo sapiens 14 7 5 4 3
One-tail Mann-Whitney test
P-value 0.016 0.016 0.005 0.014 0.005
Fortunately, the tremendous drop in sequencing costs brought about by next generation sequencing platforms (for example, [24,25]) allows the comparative genomics community to contemplate the possibility of sequencing, in the coming decade, hundreds or even thousands of complex genomes spanning a wide phylogenetic diver-sity (for example, [26]). We, however, urge the commu-nity to go for quality rather than for quantity: high-coverage should be a compulsory requirement in these large genome sequencing projects such that genome content evolution, as well as coding and non-coding sequence changes, can be reliably inferred for a vastly improved understanding of genome evolution.
Materials and methods
PhylomeDB data
As an alternative to ENSEMBL trees, we used data from the human phylome [8] available through the Phylo-meDB database [7]. The pipeline used to reconstruct the human phylome is described in more detail elsewhere [8]. In brief, a database containing all proteins encoded
[image:10.595.58.542.89.398.2]in the 39 eukaryotic genomes (all high coverage) included in the phylome is searched for putative homo-logs of human proteins by a Smith-Waterman algorithm [27]. Significant hits with an e-value lower than 10-3and that could be aligned over a continuous region longer than 50% of the query sequence were selected and sub-sequently aligned with MUSCLE 3.6 [28]. Alignments are trimmed using trimAl 1.0 [29] to remove columns with gaps in more than 10% of the sequences, unless such a procedure removes more than one-third of the positions in the alignment. In such cases the percentage of sequences with gaps allowed is automatically increased until at least two-thirds of the initial columns are conserved. Finally, phylogenetic trees are recon-structed by using maximum likelihood as implemented in PhyML v2.4.4 [30]. In all cases a discrete gamma-dis-tribution model is assumed with four rate categories and invariant sites, where the gamma shape parameter and the fraction of invariant sites are estimated from the data. To avoid model-based biases, protein evolu-tionary models (JTT, Dayhoff, MtREV, VT and Figure 8Simulations of low-coverage genomes and their impact on gene content inference through evolutionary time. The analysis is performed with the original human phylome (PhylomeDB, lower dashed line) and a simulated low-coverage PhylomeDB (upper dashed line) in which stretches of ambiguous sequences have been introduced in the protein sequences of three of the seven eutherian species. The transformation of these high-coverage genomes into simulated low-coverage genomes generates artifactual gains all across the species tree, but more acutely so at the basal eutherian nodes (the plain line, and secondary axis, indicates the ratio of genome content between the simulated low-coverage PhylomeDB and the original PhylomeDB).
Milinkovitchet al.Genome Biology2010,11:R16 http://genomebiology.com/2010/11/2/R16
BLOSUM62) are tested to then select the one best fit-ting the data according to the Akaike information criter-ion (AIC) [31].
Gene tree-species tree reconciliation
We used a strict tree-reconciliation algorithm [32] as implemented in ETE [33]. In this case, every gene tree is compared to the topology of a given species tree by comparing the specific sets of species contained by all tree splits. The strict reconciliation algorithm maps the gene tree onto the species tree and explains any incon-gruence in terms of the minimal set of duplication and gene-loss events necessary to derive the observed gene tree topology from the one proposed in the species tree. These inferred duplication events are marked on the tree, and orthology and paralogy relations are derived accordingly.
Simulation of low coverage sequence data
To evaluate the phylogenetic effects of low quality sequence data, stretches of ambiguous sequences where introduced in the protein sequences of three species (P. troglodytes,M. musculusand B. taurus) of the phylo-meDB. Continuous stretches of amino acids were substi-tuted by ‘X’s according to a normal distribution of lengths with meanμ, and standard deviation δ. These parameters were set for each of the three selected spe-cies:P. troglodytes (μ= 9%, and δ= 3% of the length of the sequence); M. musculus(12%, 3%); and B. taurus (15%, 3%); that is, according to the range of values we observed in real low-coverage genomes. After introdu-cing the simulated ambiguities, sequences were re-aligned and trees were reconstructed and analyzed in the same way as the non-perturbed PhylomeDB dataset.
Acknowledgements
This work was supported by grants from the University of Geneva (Switzerland), the Swiss National Science Foundation (FNSNF, grant 31003A_125060), the Société Académique de Genève (Switzerland), the Georges and Antoine Claraz Foundation (Switzerland), the Ernst and Lucie Schmidheiny Foundation (Switzerland), and the National Fund for Scientific Research Belgium (FNRS). AT is post-doctoral fellow at the FNRS. TG is supported by grants from the Spanish Ministries of Health (FIS06-213) and Science and Innovation (GEN2006-27784-E/PAT). We thank anonymous reviewers for their critical comments on previous versions of this manuscript.
Author details
1Laboratory of Artificial and Natural Evolution (LANE), Department of Zoology and Animal Biology, Sciences III, 30, Quai Ernest-Ansermet, 1211 Geneva 4, Switzerland.2Department of Biology, Facultés Universitaires Notre-Dame de la Paix, rue de Bruxelles 61, 5000 Namur, Belgium.3Department of Evolutionary Biology and Ecology, Université Libre de Bruxelles, Av. F.D. Roosevelt, 50, B-1050 Brussels, Belgium.4Centre de Regulació Genòmica (CRG), Dr. Aiguader, 88, 08003 Barcelona, Spain.
Authors’contributions
MCM and ACT conceived the study. MCM and RH performed genome content (gene gains and gene losses) mapping and duplication analyses. ED provided computing facilities. TG provided the PhylomeDB and perturbed
(low-coverage) PhylomeDB raw data, and performed additional tree reconciliation analyses with MCM and RH. MCM, ACT, and TG wrote the manuscript. All authors read and approved the final manuscript.
Received: 7 December 2009 Revised: 8 December 2009 Accepted: 9 February 2010 Published: 9 February 2010
References
1. Vilella AJ, Severin J, Ureta-Vidal A, Heng L, Durbin R, Birney E:
EnsemblCompara GeneTrees: Complete, duplication-aware phylogenetic trees in vertebrates.Genome Res2009,19:327-335.
2. Alexeyenko A, Tamas I, Liu G, Sonnhammer EL:Automatic clustering of orthologs and inparalogs shared by multiple proteomes.Bioinformatics
2006,22:e9-15.
3. Li L, Stoeckert CJ Jr, Roos DS:OrthoMCL: identification of ortholog groups for eukaryotic genomes.Genome Res2003,13:2178-2189.
4. Gabaldón T:Large-scale assignment of orthology: back to phylogenetics?.Genome Biol2008,9:235.
5. Hubbard TJ, Aken BL, Ayling S, Ballester B, Beal K, Bragin E, Brent S, Chen Y, Clapham P, Clarke L, Coates G, Fairley S, Fitzgerald S, Fernandez-Banet J, Gordon L, Graf S, Haider S, Hammond M, Holland R, Howe K, Jenkinson A, Johnson N, Kahari A, Keefe D, Keenan S, Kinsella R, Kokocinski F, Kulesha E, Lawson D, Longden I,et al:Ensembl 2009.Nucleic Acids Res2008,37: D690-D697.
6. Hubbard TJ, Aken BL, Beal K, Ballester B, Caccamo M, Chen Y, Clarke L, Coates G, Cunningham F, Cutts T, Down T, Dyer SC, Fitzgerald S, Fernandez-Banet J, Graf S, Haider S, Hammond M, Herrero J, Holland R, Howe K, Howe K, Johnson N, Kahari A, Keefe D, Kokocinski F, Kulesha E, Lawson D, Longden I, Melsopp C, Megy K,et al:Ensembl 2007.Nucleic Acids Res2007,35:D610-617.
7. Huerta-Cepas J, Bueno A, Dopazo J, Gabaldón T:PhylomeDB: a database for genome-wide collections of gene phylogenies.Nucleic Acids Res2008, 36:D491-496.
8. Huerta-Cepas J, Dopazo H, Dopazo J, Gabaldón T:The human phylome. Genome Biol2007,8:R109.
9. Tzika A, Helaers R, Peer Van de Y, Milinkovitch MC:MANTiS: a phylogenetic framework for multi-species genome comparisons.Bioinformatics2008, 24:151-157.
10. Lander ES, Linton LM, Birren B, Nusbaum C, Zody MC, Baldwin J, Devon K, Dewar K, Doyle M, FitzHugh W, Funke R, Gage D, Harris K, Heaford A, Howland J, Kann L, Lehoczky J, LeVine R, McEwan P, McKernan K, Meldrim J, Mesirov JP, Miranda C, Morris W, Naylor J, Raymond C, Rosetti M, Santos R, Sheridan A, Sougnez C,et al:Initial sequencing and analysis of the human genome.Nature2001,409:860-921.
11. Venter JC, Adams MD, Myers EW, Li PW, Mural RJ, Sutton GG, Smith HO, Yandell M, Evans CA, Holt RA, Gocayne JD, Amanatides P, Ballew RM, Huson DH, Wortman JR, Zhang Q, Kodira CD, Zheng XH, Chen L, Skupski M, Subramanian G, Thomas PD, Zhang J, Gabor Miklos GL, Nelson C, Broder S, Clark AG, Nadeau J, McKusick VA, Zinder N,et al:The sequence of the human genome.Science2001,291:1304-1351.
12. Milinkovitch MC, Tzika A:Escaping the mouse trap: the selection of new Evo-Devo model species.J Exp Zool B Mol Dev Evol2007,308:337-346. 13. Liolios K, Tavernarakis N, Hugenholtz P, Kyrpides NC:The Genomes On Line Database (GOLD) v.2: a monitor of genome projects worldwide. Nucleic Acids Res2006,34:D332-334.
14. Ensembl Genome Browser.http://www.ensembl.org/index.html. 15. Green P:2× genomes - does depth matter?.Genome Res2007,
17:1547-1549.
16. Multiple Mammalian Genomes for Comparative Annotation.http://www. genome.gov/25521745.
17. MANTiS: the missing link between multi-species full genome comparisons and functional analysis.http://www.mantisdb.org/. 18. The PhylomeDB.http://phylomedb.org/.
19. Bashir A, Ye C, Price AL, Bafna V:Orthologous repeats and mammalian phylogenetic inference.Genome Res2005,15:998-1006.
20. Halanych KM:The new view of animal phylogeny.Annu Rev Ecol Evol Systematics2004,35:229-256.
22. Blomme T, Vandepoele K, De Bodt S, Simillion C, Maere S, Peer Van de Y: The gain and loss of genes during 600 million years of vertebrate evolution.Genome Biol2006,7:R43.
23. Milinkovitch MC, Helaers R, Tzika AC:Historical constraints on vertebrate genome evolution.Genome Biol Evol2010,2010:13-18.
24. Shendure J, Ji H:Next-generation DNA sequencing.Nat Biotechnol2008, 26:1135-1145.
25. Eid J, Fehr A, Gray J, Luong K, Lyle J, Otto G, Peluso P, Rank D, Baybayan P, Bettman B, Bibillo A, Bjornson K, Chaudhuri B, Christians F, Cicero R, Clark S, Dalal R, Dewinter A, Dixon J, Foquet M, Gaertner A, Hardenbol P, Heiner C, Hester K, Holden D, Kearns G, Kong X, Kuse R, Lacroix Y, Lin S,et al: Real-time DNA sequencing from single polymerase molecules.Science2009, 323:133-138.
26. Genome 10K Community of Scientists.:Genome 10K: a proposal to obtain whole-genome sequence for 10,000 vertebrate species.J Hered2009, 100:659-674.
27. Smith TF, Waterman MS:Identification of common molecular subsequences.J Mol Biol1981,147:195-197.
28. Edgar RC:MUSCLE: a multiple sequence alignment method with reduced time and space complexity.BMC bioinformatics2004,5:113.
29. TrimAl, a tool for automated alignment trimming.http://trimal.cgenomics. org/.
30. Guindon S, Gascuel O:A simple, fast, and accurate algorithm to estimate large phylogenies by maximum likelihood.Syst Biol2003,52:696-704. 31. Akaike H:A new look at the statistical model identification.IEEE Trans
Automatic Control1974,19:716-723.
32. Zmasek C, Eddy S:A simple algorithm to infer gene duplication and speciation events on a gene tree.Bioinformatics2001,17:821-828. 33. Huerta-Cepas J, Dopazo J, Gabaldón T:ETE: a python Environment for
Tree Exploration.BMC bioinformatics2010,11:24.
34. Benton MJ, Donoghue PC:Paleontological evidence to date the tree of life.Mol Biol Evol2007,24:26-53.
35. Dunn CW, Hejnol A, Matus DQ, Pang K, Browne WE, Smith SA, Seaver E, Rouse GW, Obst M, Edgecombe GD, Sorensen MV, Haddock SH, Schmidt-Rhaesa A, Okusu A, Kristensen RM, Wheeler WC, Martindale MQ, Giribet G: Broad phylogenomic sampling improves resolution of the animal tree of life.Nature2008,452:745-749.
doi:10.1186/gb-2010-11-2-r16
Cite this article as:Milinkovitchet al.:2× genomes - depth does matter.
Genome Biology201011:R16.
Submit your next manuscript to BioMed Central and take full advantage of:
• Convenient online submission
• Thorough peer review
• No space constraints or color figure charges
• Immediate publication on acceptance
• Inclusion in PubMed, CAS, Scopus and Google Scholar • Research which is freely available for redistribution
Submit your manuscript at www.biomedcentral.com/submit Milinkovitchet al.Genome Biology2010,11:R16
http://genomebiology.com/2010/11/2/R16