A 6 y e a r s t u d y of m a m m o g r a p h i c
c o m p r e s si o n fo r c e : p r a c ti tio n e r
v a ri a bility wi t hi n a n d b e t w e e n
s c r e e n i n g si t e s
M e r c e r, C E, S z c z e p u r a , K, Kelly, J, Milli n g t o n , S, D e n t o n , D,
Bo r g e n , R, H il t o n , B a n d H o g g , P
h t t p :// dx. d oi.o r g / 1 0 . 1 0 1 6 /j. r a di. 2 0 1 4 . 0 7 . 0 0 4
T i t l e A 6 y e a r s t u d y of m a m m o g r a p h i c c o m p r e s si o n fo r c e : p r a c ti tio n e r v a ri a b ility wi t hi n a n d b e t w e e n s c r e e n i n g si t e s
A u t h o r s M e r c er, C E, S z c z e p u r a , K, Kelly, J, Milli n g t o n , S, D e n t o n , D, Bo r g e n , R, H il t o n , B a n d H o g g , P
Typ e Ar ticl e
U RL T hi s v e r si o n is a v ail a bl e a t :
h t t p :// u sir. s alfo r d . a c . u k /i d/ e p ri n t/ 3 6 9 8 7 /
P u b l i s h e d D a t e 2 0 1 4
U S IR is a d i gi t al c oll e c ti o n of t h e r e s e a r c h o u t p u t of t h e U n iv e r si ty of S alfo r d . W h e r e c o p y ri g h t p e r m i t s , f ull t e x t m a t e r i al h el d i n t h e r e p o si t o r y is m a d e f r e ely a v ail a bl e o nli n e a n d c a n b e r e a d , d o w nl o a d e d a n d c o pi e d fo r n o
n-c o m m e r n-ci al p r iv a t e s t u d y o r r e s e a r n-c h p u r p o s e s . Pl e a s e n-c h e n-c k t h e m a n u s n-c ri p t fo r a n y f u r t h e r c o p y ri g h t r e s t r i c ti o n s .
A 6 year study of mammographic compression force: practitioner variability
within and between screening sites.
Abstract
Background
The application of compression force in mammography is more heavily influenced
by the practitioner rather than the client. This can affect client experience, radiation
dose and image quality. This research investigates practitioner compression force
variation over a six year screening cycle in three different screening units.
Methods:
Data were collected from three consecutive screening events in three breast
screening sites. Recorded data included: practitioner code, applied compression
force (N), breast thickness (mm), BI-RADS® density category. Exclusion criteria
included: previous breast surgery, previous/ongoing assessment and breast
implants. 975 clients (2925 client visits, 11,700 mammogram images) met inclusion
criteria across three sites. Data analysis assessed practitioner and site variation of
compression force and breast thickness.
Results:
Practitioners across three breast screening sites behave differently in the application
of compression force. Two of the three sites demonstrate variability within
themselves though they demonstrated no significant difference in mean, first and
third quartile compression force and breast thickness values CC(p>0.5),
MLO(p>0.1) between themselves. However, in the third site, where mandate
dictates a minimum compression force is applied, greater consistency was
first and third quartile compression force and breast thickness values (p<0.001) was
demonstrated between this site and the other two sites.
Conclusion:
Variability within these two sites and between the three sites could result in
variations. Stabilisation of these variations may have a positive impact on image
quality, radiation dose reduction, re-attendance levels and potentially cancer
detection. The large variation in compression forces could negatively impact on
client experience between the units and within a unit.
Further research is required to establish best practice guidelines for compression
force within mammography.
Advances in knowledge:
Practitioners vary in the compression forces they apply to clients over sequential
screening attendances. Establishing better practice guidance could help to minimise
this problem.
1 Introduction
It is acknowledged that one of the most important factors in determining the success
of a screening programme is screening uptake1,2. The causes of any non-uptake are
multifactorial. A systematic review in 2013 measured the extent of non-uptake. This
review indicated clients not re-attending for screening because of breast pain from
prior mammography was a significant issue3. Whelehan and colleagues suggested
that between 47,000 and 77,000 women within England do not re-attend for breast
screening in a year due to pain directly related to a previous mammogram3.
Pain from mammography can arise from the application of compression force3. It
has also been identified that the position of the breast under the mammography
compression paddle can directly affect the amount of pressure in different portions
of the breast4 with potential for direct association with increased breast pain.
Quality assurance standards within the National Health Service Breast Screening
Programme (NHSBSP) are essential to ensure its continued effectiveness. The
20125 annual review of breast screening highlighted that ‘ultimately decisions based
around screening programmes must be evidence based’ and that it should be ‘a first
class system ensuring excellent training for all professional staff’. It seems
extraordinary that such a service has no standards or guidelines on the application
of compression force other than a statement ‘the force of the compression on the
x-ray machine should not exceed 200 Newtons (N)6 with various proposed
descriptors such as ‘taut to touch’ or ‘until the skin blanches’7-11
This research investigates practitioner compression force variation over a six year
screening cycle in three different screening units. It builds on earlier research, which
was single centre. Previous research12,13 identified practitioner variability in
compression force application during mammography imaging within a single
NHSBSP screening programme. The current research includes two additional
regional breast screening services located in the North of England (UK).
2 Materials / Method
Hospital (service evaluation) and University ethics committees approved access to a
sample of 1500 screening events at each screening unit (a screening event is
defined as one mammogram series which includes four images). In order to exclude
mammography machine variability14 as a confounding factor in terms of data quality,
data was gathered from one mammogram machine at each location (GE Seno
Essential, Lorad Mk4 and Siemens Mammomat 3000). The three analogue
mammogram machines were operated within NHSBSP and manufacturer
specifications15, 16 during the study period. The study period was for a consecutive
six year period; only analogue images were included as NHSBSP screening sites
had not been converted to digital technology for a six year period at the time of the
study. Design characteristics of compression paddles tend to be similar between
analogue and digital units, though it should be noted that recently paddles on the
latter have started to introduce changes to their design.
2.1 Client Sample
Data were gathered retrospectively at all three sites from clients who attended three
consecutive screening events. Only three screening events could be included as the
Identification of clients was through consecutive stratified sampling. For inclusion
each client had to have three consecutive screening events, with their first recorded
mammogram experience as their first event. Each would have four standard
projections acquired (left / right CC (cranial-caudal) and left / right MLO
(medio-lateral oblique). For each client the following information was recorded directly from
the mammography image - size of film, breast compression force value in
deca-Newtons (daN) or deca-Newtons (N), compressed breast thickness (mm) and the
practitioner who performed the mammogram, coded for anonymity.
Breast density was established by 5 observers in the three screening units using the
4 point BI-RADS® scale (Breast Imaging Reporting and Data System)17 – BI-RADS®
1 <25% dense, BI-RADS® 2: 25%–50% dense, BI-RADS® 3: 51%–75% dense, and
BI-RADS® 4 >75% dense. In order to establish inter and intra observer
characteristics of the 5 observers for BI-RADS scoring, fifty film-screen
mammograms were used18. These images comprised of left and right CC and MLO
and were scored by each observer independently under the same viewing
conditions; blinded to the findings of other observers. To provide data to assess
intra-observer variability, mammography image sets were re-scored after an interval
of at least two weeks, to minimise recall bias. Near complete intra-observer
agreement (Kappa >0.81) and strong or above inter-observer variability was
demonstrated (First score Fleiss kappa 0.77 second score 0.65)18.
2.2 Exclusion Criteria
Exclusion criteria were established (Figure 1). Clients with less than or more than
criteria the number of clients remaining for analysis at each unit were: site 1= 344[13],
site 2 =325, site 3 =306.
2.3 Practitioners
Practitioners at all sites consisted of staff working in the breast imaging department
at the time of the study. The staff included a mixture of Advanced Practitioners,
Mammographers and Assistant Practitioners, all are referred to as practitioners for
the purposes of this study. Clients were imaged by similar numbers of trained
practitioners at the three sites; 14 at site one, 11 at site two and 15 at site three.
2.4 Recorded data
Compression force and compressed breast thickness, together with practitioner
details of those who performed the imaging were noted for all images.
3 Results
3.1 Practitioners
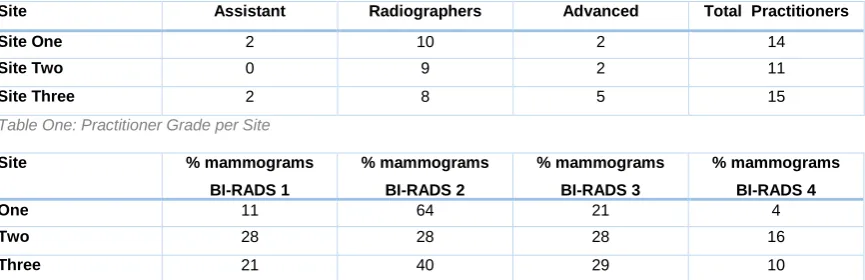
Firstly, analysis of practitioner grade between sites was compared (Table 1). The
range of the number of clients the practitioners imaged at each site was: site one
(10-146); site two (10-155); site three (12-139). The mean number of clients imaged
by all practitioners at each site was, site one: (73.7), site two: (88.6), site three
(61.2). The median number of clients imaged at each site was, site one: (73.5), site
two: (100), site three:(75).
3.2 BI-RADS Breast Density Classification
The distribution of BI-RADS density within each site was assessed for similarity
between sites by documenting the number of mammograms imaged per site in a
percentage for each BI-RADS breast density category (Table 2). For the purposes
BI-RADS® 3 and 4 (Group B) was required due to the low numbers of images in
BI-RADS® group 1 with BI-RADS® group 4, having zero figures for some practitioners.
Pearson Chi Squared test was used for the comparison of BI-RADS® Group A and
Group B amongst sites. Pearson's X2 156 (Group A) and 107 (Group B), (p
<0.0001) suggests there is a significant difference in the distribution of BI-RADS®
grades between different sites.
Whilst it is recognised that this could be considered as a study limitation, it has been
established previously12 that practitioners display the same compression behaviours
across BI-RADS density classifications and do not necessarily vary their application
of compression force according to breast density.
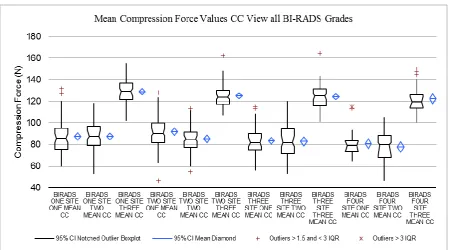
3.3 Practitioner variability
To establish practitioner variability, the mean compression values for all
practitioners, at all sites, were analysed (Figure two and three). Compression force
values varied across the three sites, with CC average at site one 86N, site two 84N,
site three 125N. For the MLO, site one 97N, site two 88N, site three 132N. Analysis
of variance (ANOVA) of mean compression force values of practitioners
demonstrated a significant difference (p<0.0001) between sites ‘one and three’, and
‘two and three’. Sites ‘one and two’ demonstrated no significant difference (CC
p>0.5, MLO p> 0.1). These levels of significance hold true within each BI-RADS
density classification.
First and third quartile results at all sites were analysed (table three). In CC and
MLO, ANOVA of first and third quartile compression force levels of practitioners
sites ‘two and three’. Sites ‘one and two’ demonstrated no significant difference (first
quartile p>0.1, third quartile p>0.5). This holds true within each BI-RADS grade.
Having removed the outliers (see Figures 2 and 3), minimum and maximum
compression force values for CC views ranged as follows: Site one 47N to 122N
(75N), site two 42N to 114N (72N), site three 103N to 158N (55N). For MLO: site
one 65N to 136N (71N), site two 48N to 139N (91N), site three 103N to 163N (60N).
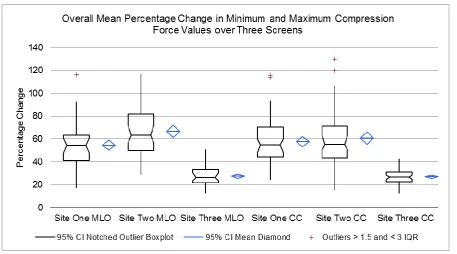
3.4 Percentage changes in breast compression force
Analysing the mean percentage change between minimum and maximum
compression force values per client, from their three screening mammograms,
establishes one aspect of variability from a client perspective.
The mean percentage change between minimum and maximum compression force
was calculated for each BI-RADS grade for both CC and MLO (Figure Four).
Average values of mean percentage change for each site for the MLO: site one
55%, site two 66%, site three 27% and the CC: site one 57%, site two 60% and site
three 26%.
ANOVA was performed on percentage changes. For MLO, sites ‘one and three’ and
‘two and three’ demonstrated a significant difference (p<0.0001) and this holds true
within each BI-RADS grade. Sites one and two demonstrated no significant
difference (p>0.2), this holds true for each BI-RADS grade. No significant difference
was demonstrated between sites ‘one and two’ (p>0.5). It can be concluded that site
3.5 Breast Thickness
Compressed breast thickness ranges at all sites were compared by mean, first and
third quartile values for CC and MLO.
Mean compressed breast thickness values at all sites were analysed (Table four).
Over the three screens, in both the CC and MLO, ANOVA of mean compressed
breast thickness values of practitioners demonstrated a significant difference
(p<0.0001) between ‘site one and three’ and site ‘two and three’. Site one and two
demonstrated no significant difference in mean CC values of thickness (p>0.5). This
holds true within each BI-RADS grade. Practitioners at site three applied higher
compression values and this would explain why the breast thicknesses at this site
are smallest.
First and third quartile compressed breast thickness values at all sites were
analysed (Table five). For both the CC and MLO , ANOVA demonstrated significant
differences (p<0.0001) in first and third quartile breast compressed thickness values
between sites ‘one and three’ and sites ‘two and three’. Site ‘one and two’
demonstrated no significant difference in values of thickness (p>0.5). This holds true
within each BI-RADS grade.
4 Discussion
4.1 Compression force variability
This research has demonstrated that the amount of breast compression force
applied by practitioners is not consistent within and between three NHSBSP
For site one, within each of the three subgroups variability is low’13,14
. At site two
practitioners apply compression force across a wide range of values and they do not
fall into subgroups. Overall, practitioners from site one and site two apply
compression forces within the same mean values, first and third quartiles and there
is no statistical difference between them. Sites one and two permitted their
practitioners to define their own compression force values, within NHSBSP
maximum tolerance levels. Whilst there is no statistical difference between sites one
and two, a client attending either or both of these sites would potentially be subject
to large variations in compression force on subsequent visits. However, on average,
for sites one and two, a client would have a lower level of compression force applied
compared with site three. However for site three a client would likely have a higher
though more consistent level of compression forced applied over time.
Site three had a protocol in place which mandates that a minimum level of 100N
compression force is used. Some sites within NHSBSP have protocols similar to
this. Therefore, the lack of a consistent approach within NHSBSP exposes clients to
variation in compression force if they moved between sites. It might be worthwhile
speculating that higher compression force values could be associated with reduced
client experience and pain and reduced re-attendance. Equally variability could also
cause this problem too – perhaps even at lower levels of compression force.
It is also worth noting that no data exists to illustrate that image quality is better
when compression forces of 100N or higher are used, as in site three; rather
anecdote dictates that higher compression forces are likely to result in better image
compression forces, however the image quality scoring mechanism may not be
sensitive enough to identify subtle changes in image quality.
A noted limitation of this study is that the three sites studied are located in the same
geographical region and therefore practitioners could have been trained similarly,
thereby reflecting a local variability problem. However, in 2013 Murphy and
colleagues20, from a UK-wide analysis of compression force behaviours, identified
that practitioners vary in their approach to the application of compression force. This
current study is therefore likely to reflect behaviour nationally.
4.2 Breast thickness variability
The inconsistency in compression force application across the three sites has a
direct association with an inconsistency of compressed breast thickness values. Site
one and two have similar means, first and third quartile compressed thickness
values with no statistical difference (p>0.5). Site three has significant differences in
compressed breast thickness levels to the other two sites (p<0.001); this has
obvious direct implications for radiation dose and may have an impact on image
quality – especially when sequential imaging comparison is considered. On this
basis site three might be considered superior for consistency and dose
minimisation.
4.3 National standards
From this and prior research13,14 there is a need for the NHSBSP to consider the
introduction of national guidance on compression force levels. Hogg and
colleagues21 in 2013 highlighted minimum and cessation compression force levels
considered based upon rate of change of compression force and thickness
reduction, rather than by compression force alone.
Taking a different perspective, a recent study by de Groot and colleagues22
questioned if standardisation by compression force was meaningful and they
suggested a focus towards pressure. They explained that clients with small breasts
would experience more pressure than clients with large breasts with the same
applied compression force. They suggested standardisation based upon pressure
and this shows promise.
4.4 Possible impact on client experience
The findings of this research have possible implications for clients. These will be
discussed in turn.
4.4.1 Radiation Risk
With respect to radiation risk there remain uncertainties about absolute cancer risk
from low dose mammography screening. A recent report states that the risk of
radiation induced cancer is approximately 1 in 20,000 per screening visit23. This
equates to 154 cancers detected for every one induced and 80 lives saved for every
life lost to radiation induced cancers23. Benefit thus exceeds risk. This research
demonstrated that site three had lower breast thickness levels than the other two
sites overall within the six year screening cycle (p<0.001). Reducing breast
thickness has potentially quantifiable reductions in radiation risks to clients within
the screening programme.
4.4.2 Image Comparison
Direct comparison between images on successive screens is vital to ensure
only essential within the same screening site but across the whole NHSBSP as
clients can attend different sites. Our research has demonstrated compression force
and breast thickness differences exist between and within sites, and the latter could
influence image quality. If differences in quality exist for the same client then this
could confound comparison of images on successive screens.
4.4.3 Re-attendance
Pain and non-re-attendance are related. Having a standardised approach to
compression force levels within a specified range might improve client experience
by offering them a consistent expectation and experience. Further research is
needed into client pain and levels of applied compression force.
5 Conclusion
Our research demonstrates that practitioners across three breast screening sites
behave differently in the application of compression force when undertaking
mammography. Two of the three sites demonstrate variability. Variability within
these two sites and between the three sites could result in variations in image
quality, radiation dose together with client experience which in turn could influence
re-attendance. When mandate dictates a minimum compression force standard this
results in greater consistency between practitioners and clients. This may have a
positive impact on image quality, radiation dose reduction and potentially cancer
detection.
Conflict of Interest Statement/Role of Funding
The authors have no conflict of interest to declare. Part funding for the study was
received by the Countess of Chester Breast Unit and Burnley General Breast Unit to
was from the North West Regional Quality Assurance Reference Centre. The
sponsors have had no role in study design, collection of data, analysis or
interpretation of data, writing of the manuscript of decision to submit the manuscript.
Site Assistant
Practitioners
Radiographers Advanced
Practitioners
Total Practitioners
Site One 2 10 2 14
Site Two 0 9 2 11
[image:15.595.75.508.156.296.2]Site Three 2 8 5 15
Table One: Practitioner Grade per Site
Site % mammograms
BI-RADS 1 % mammograms BI-RADS 2 % mammograms BI-RADS 3 % mammograms BI-RADS 4
One 11 64 21 4
Two 28 28 28 16
Three 21 40 29 10
Table Two: Percentage of Mammograms within each BI-RADS Breast Density Category
First Quartile Third Quartile
Site MLO
Compression (N)
S.D CC
Compression (N)
S.D MLO
Compression (N)
S.D CC
Compression (N)
S.D
Site One 84.85 21.63 75.5 17.07 106.1 26.07 92.7 22.87
Site Two 73.13 11.73 71.27 11.57 104.3 15.5 95.87 12.42
[image:15.595.67.518.340.646.2]Site Three 118.21 12.75 111.99 10.09 144.34 14.65 135.41 15.25
Table Three: First and Third Quartile Compression Forces all Sites
Site MLO Thickness
(mm)
S.D CC Thickness (mm) S.D
Site One 53.8 13.7 50.9 11.3
Site Two 57.9 12.2 56.8 10.9
Site Three 47.1 12.7 43.5 10.5
Table Four: Mean Breast Thickness Value (mm): Comparison all Sites
First Quartile Third Quartile
Site MLO
Thickness(m m)
S.D CC
Thickness(m m)
S.D MLO
Thickness(m m)
S.D CC
Thickness(m m)
S.D
Site One 44.55 3.43 43.56 2.86 63.6 3.80 59.73 2.54
Site Two 49.78 2.94 50.46 3.02 65.36 3.08 62.61 2.58
Site Three 38.23 3.70 36.32 2.66 56.52 2.85 50.74 2.91
Figure One: Exclusion Criteria
[image:16.595.74.525.355.605.2]Figure Three: Mean Compression Force Values MLO View
[image:17.595.72.530.380.634.2]References
1. Marmot M, Altman DG, Cameron DA, Dewer JA, Thompson SG, Wilcox M. The benefits and harms of breast cancer screening: an independent review. The Lancet 2012; 380 (9855): 1778-86
2. Weller DP, Campbell C Br J Cancer. 2009 Dec 3;101 Suppl 2:S55-9. doi: 10.1038/sj.bjc.6605391.Uptake in cancer screening programmes: a priority in cancer control.
3. Whelehan P Evans A, Wells M, Macgillivray S. The effect of mammography pain on repeat participation in breast cancer screening: A systematic review. Breast 2013 Aug:22(4) 389-94
4. Smith H, Hogg P, Maxwell A, Mercer C, Szczepura K. An analysis of the compressed breast area and image receptor/compression paddle pressure balance in different mammographic projections. UKRC 2013 Publication.
5. NHS Breast Screening Programme 2012 Annual Review Published 2012 | ISBN 978-1-84463-093-6
6. NHSBSP 33. Quality assurance guidelines for medical physics services. 2nd edn. June 2005; ISBN 1 84463 016 1
7. Long S. The handbook of mammography, 4th edn. Edmonton: Mammography Consulting Services Ltd, 2000.
8. Wentz G. Mammography for radiologic technologist. New York: Mc Graw Hill, 1992.
9. Kopans D. Breast Imaging, 3rd edn. Lippincott: Williams and Wilkins, 2007.
10. Eklund GW, Cardenosa G. The art of mammographic positioning. Breast Imaging: Current Status and Future Directions. Radiologic Clinics of North America. 1992; 30:21–53.
11. Poulos A, McLean D. The application of breast compression in mammography: a new perspective. Radiography. 2004; 10:131-137.
13. Mercer C.E, Hogg P, Szczepura K, Denton E.R.E. Practitioner compression force variation in mammography: A 6-year study. Radiography 19 (2013) 200-206
14. Hauge I, Hogg P, Szczepura K, McGill GG, Connolly P, Mercer CE. The readout thickness versus the measured thickness for a range of screen film mammography and full-field digital mammography units, Medical Physics, 39, 1, 2012
15. Report No. 89 (Revision of IPEM Report 59). The commissioning and routine testing of mammographic x-ray systems. Institute of physics and engineering in medicine (IPEM), 2005.
16. NHSBSP 63. Quality Assurance Guidelines for Mammography. April 2006; 42. ISBN 1 84463 028 5.
17. D'Orsi CJ, Bassett LW, Berg WA. Mammography, 4th Edition. Breast Imaging Reporting and Data System: ACR BI-RADS®. Reston VA: American College
of Radiology, 2003.
18. Mercer C, Hogg P, Kelly J, Borgen R, Enion D, Hilton B, Millington S & Whelehan P (2013) A mammography image set for research purpose utilizing BI-RADS density classification. Radiologic Technology in press
19. Mercer C, Hogg, P,Cassidy S, Denton ERE, 2013. Does an increase in compression force really improve visual image quality in mammography? An initial investigation, 2013. Radiography Volume 19, 2013, Pages: 363-365
20. Murphy F.J. Nightingale J.M. Mackay S.M. Robinson L. Seddon D. Hogg P. Compression behaviours- An exploration of the beliefs and values influencing the application of breast compression during screening mammography, UKRC 2013
21. Hogg P, Taylor M, Szczupera K, Mercer C and Denton E, 2013. Pressure and breast thickness in mammography—an exploratory calibration study, British Journal of Radiology, 2013
22. De Groot JE, Broeders MJM, Branderhorst W, den Heeten GJ, Grimbergen CA. A novel approach to mammographic breast compression: Improved standardization and reduced discomfort by controlling pressure instead of force. Med. Phys. 40 (8), August 2013