Distance based an Efficient Transmit Power Control
Scheme in Cognitive Radio System with Multiple
Antennas
Sandeep Kumar Jain
Department of E&CE NIT Hamirpur-177005
India
Manoranjan Rai Bharti
Department of E&CE NIT Hamirpur-177005
India
Amardip Kumar
Department of E&CE NIT Hamirpur-177005
India
ABSTRACT
In this paper, a transmit power control scheme for a cognitive radio system (CRS) in a Rayleigh fading channel based on the location information of primary user is proposed. The situation where primary user (PU) i.e. licensed user share the spectrum with secondary user (SU) i.e. cognitive radio have been considered. First a mathematical model for probability of detection as a function of distance between PU transmitter and SU transmitter is developed. The mathematical model takes into account multiple antennas at SUs and uses energy detection (ED) with selective combining (SC) scheme. The maximum allowable transmit power at SU transmitter, to guarantee decodability of PU transmitter signal at PU receiver,is calculated by using the distancebetween PU transmitter and SU transmitter. The simulation results show that the probability of detection improves with the use of multiple antennas at SU transmitter. This improved probability of detection will result into more accurate calculations of the maximum allowable transmit power at SU transmitter.
Keywords
Cognitive radio (CR), dynamic spectrum access (DSA), energy detection (ED), path loss, probability of detection, transmit power control.
1.
INTRODUCTION
Due to efficient utilization of available spectrum resources, cognitive radio (CR) has become an emerging software defined radio (SDR) technology in wireless communication networks. According to Simon Haykin, a cognitive radio can be defined as [1]. “Cognitive radio is an intelligent device that is sensitive of its neighboring environment also known as outside world, and uses the methodology of understanding by building to learn from the environment and adapt its internal states to statistical variations in the incoming RF stimuli by making corresponding changes in certain operating parameters such as transmit power, carrier frequency, and modulation strategy etc. in real-time, while keeping two primary objectives in mind. One is exceedingly trustworthy communications wherever and whenever needed and another one is efficient utilization of the radio spectrum”. Due to ever increasing requirement of maximum data rate, throughput and efficiency in most of the latest wireless applications, spectrum assets are facing massive demands. There is limited spectrum available for a particular application, regulated by government agency known as Federal Communications Commission (FCC). Within the current spectrum regulatory structure, many parts of the spectrum are entirely allocated to specific
services and no violation from cognitive users is legitimate. To overcome the conflict between spectrum scarcity and spectrum under-utilization [2], it became strong motivating factor for the researchers to take up their research work in this particular area. Cognitive radio [3] [4], including SDR dynamic spectrum access (DSA) promises to provide a way to promote the spectrum utilization by allowing the unlicensed secondary user (SU) to dynamically access a spectrum hole unoccupied by the primary user (PU) at the right location and right time.
To optimize the spectrum usage and adapt its transmission and reception parameters accordingly without disturbing the quality of service of the primary user, first we have to perform spectrum sensing [5]-[6] which is one of the most vital issues of cognitive radio technology. Based on this sensing information, SUs start transmission once the unoccupied spectrum is found. This opportunistic transmission by SUs will interfere with PUs if the SUs fail to detect the presence of the PUs signal, i.e., misdetection (MD), and starts the transmission in the same frequency band with a transmit power larger than a limit which can be decided based on the noise floor and the interference protection ability of the PUs.
Multiple techniques have been discussed in the literature to overcome the interference at PU by controlling the transmit power level of SU. Flexible spectrum shaping in orthogonal frequency division multiplexing (OFDM) is strongly considered as a suitable candidate for cognitive radio [6] to avoid interference with the licensed user. Beamforming based on the instantaneous channel state information (CSI) [7] from the SU transmitter to the PU receivers allows the SU suppresses the interference to PUs. One more scheme for transmit power level control in CRS is based on spectrum sensing side information (SSI) [8] [9], wherein we first calculate shortest distance between CR and PU receiver; then based on the minimum distance, transmit power can be controlled. In another approach, by employing adaptive power control scheme [10], we allow transmit power adaptation at the SU transmitter to maintain a constant output SNR to the secondary user receiver and limit the interference to a primary user within an interference constraint. In CRS transmit power can also be controlled under cooperative and non-cooperative spectrum sensing [11] to either maximize the average data rate or minimize the outage probability of the SU.
guaranteeing an acceptable level of aggregate interference at the PU receivers. In order to estimate allowable transmit power for SU we considered received SNR as a proxy to determine the shortest distance between SU transmitter and PU receiver. We have also derived a mathematical model for calculating shortest distance in terms of probability of detection.
This paper is organized as follows: System model for CRS is given in section 2. Proposed methodology to calculate the shortest distance between PU receiver and SU transmitter is described in Section 3. In section 4, we derived mathematical expression for maximum allowable transmit power of SU as a function of shortest distance calculated in section 3. Then in section 5, simulation results are presented and discussed. Finally, conclusions are drawn in section 6.
2.
SYSTEM MODEL
SU Rx
SU Tx PU Tx PU Rx
µ
R
p Δ
R
d
Ψ
d2
d1
U
se
r C
h
an
n
el
Sensing Channel
Interference Channel 1 T
1 R
Fig.1. System model for CRS
System model for cognitive radio system is shown in Fig.1, where the primary and secondary users coexist in the same area and using same frequency band. Here primary transmitter and receiver are represented by PU Tx and PU Rx respectively; whereas secondary transmitter and receiver are represented by SU Tx, and SU Rx respectively. In order to get better sensing information we are considering multiple numbers of antennas denoted by T and Rat SU Tx and SU Rx respectively. The circles covered with the radius Rd and Rp represents, respectively, the decodable region within which the SNR of decodability occurs in the absence of interference to the PU Rx and the protection region within which the PU Rx must be guaranteed successful reception in the presence of SU. Here we are considering received SNR as a proxy for estimating the shortest distance between PU Rx and SU Tx. So ∆ and µ (both measured in dB), respectively, represent path loss in the region corresponding to Rd and how much interference above the noise floor the primary system can tolerate i.e. protection margin. There are three types of channelsshownin the system model.The user channel is the channel between SUs, sensing channel is the channel from PU transmitter to SU transmitter and the interference channel is the channel from SU transmitter to PU receiver. Symbols d1 and d2 (both measured in meters)represent the distances between PU Tx – SU Tx and between PU Rx – SU Tx respectively.
In our proposed scheme to control the transmitted power level of SU transmitter for a known transmit SNR of PU, distance d2 is required.Due to lack of awareness about the right location of PU and exact channel information, the calculationof distance d2 is very difficult. Therefore, as shown in the system model, the path loss between PU Tx and SU Tx
is represented by (Δ + Ψ) dB. Now,if transmit power of the SU depends on the path loss (µ + Ψ) dB between PU Rx and SU Tx.; then, the transmit power control problem is essentially converted to the problem of evaluating the path loss due to d1 for a given µ and ∆. We take the path loss exponent between PU Tx – PU Rx as α1and between SU Tx – PU Rx as α2,which are usually constant in the range 2 ~ 5.
3.
PROPOSED METHODOLOGY TO
CALCULATE DISTANCE BETWEEN PU
TRANSMITTER AND SU TRANMITTER
In this section we discuss our proposed methodology to calculate the distanced1 between PU Tx and SU Txwhich will be used to control and determine maximum allowable transmit power at SU Tx while still guaranteeing decodability of PU signal at PU Rx in the protected region.3.1
Spectrum Sensing
Spectrum sensing is one of the most vital issues of cognitive radio technology as it should be firstly performed before allowing unlicensed users to access an unoccupied licensed band, to ensure the efficient utilization of the spectrum without disturbing the quality of service of the primary user. There are many techniques for spectrum sensing available in literature. Some of them are discussed in [5] [6].
• Energy Detection: The energy detection method is optimal for detecting any unknown zero-mean constellation signals.
• Matched filter: It is an optimal method for detection of signals. Matched filter maximizes the signal to noise ratio of the received signal in the presence of AWGN.
• Cyclostationary Detection: If the signal of the primary system has cyclic characteristics, that signal can be detected at very low signal to noise ratio (SNR) by using a cyclostationary detection technique.
In order to avoid the interference at the PU Rx, the SU should sense the spectrum opportunity.Due to its less complexity in implementation, we use energy detection with selective combining for sensing the available unoccupied frequency band.
If y(t) is the received signal at the SU Tx, x(t) is the transmitted signal from PU Tx, n(t) is the zero-mean additive white Gaussian noise (AWGN) with the variance σ2
and h denotes the Rayleigh fading channel coefficient. The objective of spectrum sensing is to decide between the following two hypotheses:
When the PU Tx is not active, which is referred to as hypothesis H0, the received signal at the ithantenna of SU Tx is given by:
( )
( )
y t
n t
When the PU Tx is active, which is referred to as hypothesis H1, the signal received from the PU Tx at the ith antenna of SU
Tx can be written as:
( ) ( )
( )
G h x ts n ty t
Where, Gs represent path loss of sensing channel.
1 0
1 1
0 1
1
f
d
m d
P
E prob H H
P
E prob H H
P
E prob H
H
P
Where, E represent expectation operator.
Closed form expression for the detection probability by using the energy detection (ED) with selective combining (SC) in a Rayleigh fading channel [10] is given by,
0
, 0
(1)
1
2 2 2
1 1 1
( , ) 2 ( 1) 2
2 2
0
2
2 0 2
1 2 1 1 2
exp 2 2 2 2
0
2 ! 2
2 2
0 1
0 ! 2
d SC
N
T T b p a
n
P T N T
n p a
n m N a a b b m m
p a p a
m N b m m
Where,symbolsp, a and b are defined in terms of number of samples (N0), detection threshold of ED (Eth), average sensing SNR
s and standard deviation of the receiver noise
z at SU Tx.
1
p
n
a
2
sN02
z
th
E b
In order to calculate the detection probability by using
equation (1), we require the value of decision threshold E th for a given false alarm rate, Pf. E
thcan be determined using equation (2) given below in which (. , .) and (.) denotes incomplete gamma function and gamma function respectively.
2
0 0 0
(
th,
,
z)
(
,
th/ 2
z) / (
)
(2)
f
P
E
N
N E
N
3.2
Relation Establishment between SNR
and Distance
To calculate distance d2 for controlling the transmit power of SU is very difficult because we do not know the exact location of PU as well as exact channel state information. As mentioned in our system model, discussed in section 2, the problem of finding d2, is essentially the problem of finding d1.
The distance, d1, can be estimated by measuring the local SNR of the PU Tx at SU Tx with the help of pilot signal as well as sensing SNR.In this sub-section, we have derived the relationship between sensing SNR and distance (d1). The path loss due to distance d1 between PU Tx and SU Tx is given by,
1
( )
10 log , (3)
1
d dB
In term of average sensing SNR
s and transmit SNR ofPU Tx
t above equation can be written as,
(4)10log t 10log s
From equation (3) and (4) average SNR of sensing channel can be represented in term of transmit SNR of PU Tx and distance d1as
( 1)
1 (5)
s t
d
3.3
Distance between PU Tx and SU Tx
Now substitute equation (5) in equation (1) we get detection probability as a function of distance d1.
2 1 1 1 '
( , ) 2 ( 1)
, 0 2 2
0 1 0 ( 1) 2 2
0 1 2 0
( 1)
2 0
1 1 2
exp
( )
2 2 2 1
0 1
( 1)
2 1
1 1 2
! 2
T n T b
P T N T
d SC n
p n
N
p td N
N s
d N
t b
p td N
d t b m
0 2 1 2
0 ! 2
0 2
0
( 1)
2 0 2 0 1 (6) m N b m m m N N
m p d N
t
' (7( )) 1 0 , '1 0 1 (7( ))
,
( , )
( , ) 1
d a
d SC
d b
m d SC
P T N f
P P T N f
By using the above equation (7(a)), we can calculate distance d1 between PU Tx and SU Tx for any particular value of detection probability, Pd,SC.
4.
PROPOSED
TRANSMIT
POWER
CONTROL SCHEME AS A FUNCTION
OF DISTANCE
d
1In this section, we derived mathematical expression to determine the maximum allowable transmit power at SU Tx while still guaranteeing decodability of PU signal at PU Rx in protected region.
Let Ppand Psare the transmit powersof primary and secondary transmitters, respectively,with their corresponding received
powers at PU Rx denoted byPp'andPs', on the edge of the
protected region. If noise power at PU Rx denoted by w2, then guaranteed decodability of PUTx signal at PU Rx having decodable SNR
dec
can be expressed as:' ' 2
10 log
p decs w
P
P
' 10' 2
10
dec p s w
P
P
' 2 10
(8)
10
1
s w
P
The allowable maximum transmit power for secondary user in terms of distance d2between PU Rx and SU Tx, thus, can be expressed as:
2 2 10
2
10
1
(9)s w
P
d
Now, by using received SNR as a proxy for calculating the value of distance d2, transmit power of secondary transmitter can be controlled by using equation given below [13]
1 1
10 2
2 1
1 1
10 10
2 (10)
10 log
10 log 10
1
10
log 10
10
s
w
P
The first term describes, that how far a PU Rx can travel from the PU Tx and still decode the signal. The second term represents how tolerant the protected primary receivers are to interference. The final term represents how far the secondary transmitter is from the protected receivers.
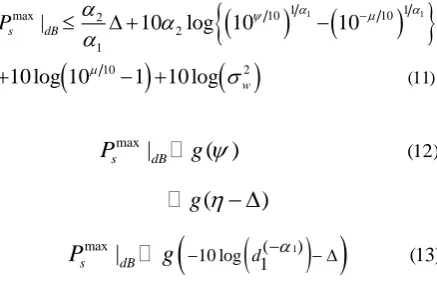
1 1
1 1
max 2 10 10
2 1
10 2
(11)
|
10
log 10
10
10 log 10
1
10 log
s dB
w
P
max
(12)
|
( )
s dB
P
g
(
)
g
1
max ( )
10 log
1
(13)
|
s dB d
P
g
Where, Pmax
s denotes the maximum value of transmit power used at SU transmitter and,as shown above in equation (13), this maximum allowable transmit power at SU Tx is controlled on the basis of calculated distance d1between PU Tx and SU Tx.
5.
SIMULATION RESULTS
In sections 3 and 4, we have developed the mathematical models to determine the maximum allowable transmit power at SU Tx while still guaranteeing decodability of PU signal at PU Rx in the protected region. In this section, we present and discuss the simulation results of the proposed transmit power control scheme.The simulations have been carried out in MATLAB. For simulation purpose, the parameters as shown in table 1 have been considered.
Table1.Simulation Parameters
S. No. Name of the parameter Value
1 Path loss in the region corresponding to Rd
∆=100 dB
2 Protection margin. µ=1dB
3 Transmit SNR of PU 100dB
t
4 False alarm rate Pf = 0.01
5 Number of Samples N0=5
[image:4.595.57.276.299.440.2]Fig.2. Detection probability using ED with SC in a Rayleigh fading channel. (Pf = 0.01 and N0 = 5)
Fig. 3 presents the probability of missing as a function of path loss due to distance for different values of path loss exponent
1
[image:4.595.324.525.388.544.2]
,
for the case of a single antenna at SU Tx.
It is seen that the probability of missing increases with increased path loss due to distance between PU Tx and SU Tx. Also, for a particular path loss, a larger path loss exponent will result into increased probability of missing. This is because of the fact that larger the path loss exponent; worse is the wireless communication environment.Fig.3. Probability of missing (Pm) versus path loss due to
distance (d1) for different value of path loss exponent
between PU Tx and SU Tx.
In fig. 4, we have plotted the probability of missing as a function of path loss due to distance, for different number of antennas at SU Tx, while keepingpath loss exponent 1
=
2.
Result shows that when cognitive radio is experiencing heavy path loss from the PU Tx, the probability of missing is increased. Also, as is evident, for a particular path loss, the probability of missing can be reduced byemploying more number of antennas at SU Tx.As shown in Fig. 5, the allowable transmit power of the SU transmitter can be increased when a heavy SNR loss occurs between the secondary transmitter and the primary receiver. This is reasonable because the interference power that the cognitive radio inflicts on the primary receiver is reduced by the large path loss.
-10 -5 0 5
0 0.1 0.2 0.3 0.4 0.5 0.6 0.7 0.8 0.9
Average SNR of sensing channel in dB
D
e
te
c
ti
o
n
P
ro
b
a
b
ili
ty
u
s
in
g
E
D
w
it
h
S
C
o
v
e
r
R
a
y
le
ig
h
f
a
d
in
g
c
h
a
n
n
e
l
T=1 T=2 T=3
20 30 40 50 60 70 80 90 100
10-4
10-3
10-2
10-1
100
Path loss due to distance between PU Tx and SU Tx in dB
P
ro
b
a
b
ili
ty
o
f
M
is
s
in
g
Fig.4. Probability of missing (Pm) versus path loss due to
distance (d1).
Fig.5. Maximum secondary transmitter power (Psmax)
versus path loss due to distance (d1).
Finally, Fig. 6 combines the results obtained in fig.4 and fig. 5. It demonstrates the relationship between maximum
allowable transmit power Psmax and probability of missing
Pm for different number of antenna at SU Tx.
Fig.6. Maximum secondary transmitter power (Psmax)
versus Probability of missing (Pm).
This figure also emphasizes the fact that higher probability of detection can be achieved by employing more number of
antennas at SU Tx. It is also obvious that better the probability of detection, more accurate will be our power control scheme.
6.
CONCLUSION
In this paper, we considered the situation where primary user (PU) shares spectrum with secondary user (SU) i.e. cognitive radio. We have proposed a distance based efficient transmit power control scheme which calculate maximum allowable transmit power at SU transmitter while guarantying decodable signal of PU transmitter at PU receiver in presence of cognitive radio. In order to calculate desired distance we have also derived a mathematical model for probability of detection in terms of distance between PU transmitter and SU transmitter which includes the location information of primary user indirectly. This scheme has shown that we can achieve better sensing performance by employing more number of antennas at SU Tx. Because of better sensing performance, we can exercise more accurate control on transmit power of SU Tx. In this work, though, we considered worst case scenario where PU Rx is at shortest distance to SU Tx; however, the proposed scheme is equally applicable to maintain a quality-of-service for the PU by limiting the interference generated by SU Tx, at any location.
7.
ACKNOLEDGEMENT
The authors would like to thank National Institute of Technology, Hamirpur for providing necessary laboratory facilities. Financial assistance from MHRD is highly acknowledged.
8.
REFERENCES
[1] S. Haykin, Cognitive radio: Brain-empowered wireless communications, IEEE Journal on Selected Area in Communications 23 (5) (February 2005) 201–220.
[2] W. Ren, Q. Zhao, and A. Swami, “Power control in cognitive radio networks: how to cross a multi-lane highway,” IEEE J. Sel. Areas Commun., vol. 27, no. 7, pp. 1283–1296, Sep. 2009.
[3] J. Mitola et al., “Cognitive radio: Making software radios more personal,” IEEE Pers. Commun., vol. 6, no. 4, pp. 13–18, Aug. 1999.
[4] J. Mitola, “Cognitive radio: An integrated agent architecture for software defined radio,” Doctor of Technology, Royal Inst. Technol. (KTH), Stockholm, Sweden, 2000.
[5] Q. Zhao and B. M. Sadler, “A survey of dynamic spectrum access: Signal processing, networking, regulatory policy,” IEEE Signal Process. Mag., vol. 24, no. 3, pp. 79–89, May 2007.
[6] T. Weiss, J. Hillenbrand, A. Krohn, and F. K. Jondral, “Mutual interference in OFDM-based spectrum pooling systems,” in Proc. IEEE VTC, May 2004, vol. 4, pp. 1873–1877.
[7] R. Zhang and Y.-C. Liang, “Exploiting multi-antennas for opportunistic spectrum sharing in cognitive radio networks,” IEEE J. Sel. Topics Signal Process., vol. 2, no. 1, pp. 88–102, Feb. 2008.
[8] Karama Hamdi, Wei Zhang, and Khaled Ben Letaief, “Power Control in Cognitive Radio Systems Based on Spectrum Sensing Side Information,” IEEE Communications Society 2007.
[9] Sandeep Kumar Jain and Manoranjan Rai Bharti, " A New Transmit Power Control Scheme in Cognitive
60 70 80 90 100 110 120
10-3
10-2
10-1
100
Path loss due to distance between PU Tx and SU Tx in dB
P
ro
b
a
b
ili
ty
o
f
M
is
s
in
g
T=1 T=2 T=3
60 70 80 90 100 110 120
40 50 60 70 80 90 100 110 120
Path loss due to distance between PU Tx and SU Tx in dB
M
a
x
im
u
m
a
llo
w
a
b
le
t
ra
n
s
m
it
p
o
w
e
r
a
t
S
U
T
x
i
n
d
B
10-3 10-2 10-1 100
40 50 60 70 80 90 100 110 120
Probability of Missing
M
a
x
im
u
m
a
llo
w
a
b
le
t
ra
n
s
m
it
p
o
w
e
r
a
t
S
U
T
x
i
n
d
B T=1
Radio System Based on Location Information of Primary User ", IEEE sponsored Student Conference on Engineering and Systems (SCES-2013), MNNIT, Allahabad, Apr 2012.
[10]Chen Sun, Yohannes D.Alemseged, Ha Nguyen Tran, and Hiroshi Harada “Transmit Power Control for Cognitive Radio Over a Rayleigh Fading Channel,” IEEE Transactions on vehicular technology, vol.59, no.4, pp. 1847-1857, May 2010.
[11]Edward C.Y.Peh, Ying Chang Liang, Yong Liang Guan, and Yonghong Zeng, “Power Control in Cognitive Radios under Cooperative and Non-Cooperative
Spectrum Sensing,” IEEE Transactions on wireless communications, vol.10, no.12, pp. 4238-4248, Dec 2011.
[12]A. Ghasemi and E. S. Sousa, “Collaborative spectrum sensing for opportunistic access in fading environments,” in Proc. 1st IEEE Symp. New Frontiers in Dynamic Spectrum Access Networks (DySPAN’05),Baltimore, USA, Nov. 8–11, 2005, pp. 131–136.