Nutrition Theses Department of Nutrition
Summer 7-29-2010
Factors Affecting Bone Mineral Density in Elite Female Runners
Factors Affecting Bone Mineral Density in Elite Female Runners
Maureen E. Cartoon
Georgia State University
Follow this and additional works at: https://scholarworks.gsu.edu/nutrition_theses
Part of the Nutrition Commons
Recommended Citation Recommended Citation
Cartoon, Maureen E., "Factors Affecting Bone Mineral Density in Elite Female Runners." Thesis, Georgia State University, 2010.
https://scholarworks.gsu.edu/nutrition_theses/23
This Thesis is brought to you for free and open access by the Department of Nutrition at ScholarWorks @ Georgia State University. It has been accepted for inclusion in Nutrition Theses by an authorized administrator of
By
MAUREEN CARTOON
A Thesis Submitted to the Graduate Faculty of Georgia State University in Partial Fulfillment
of the
Requirements for the Degree
MASTER OF SCIENCE
ATLANTA, GEORGIA
FACTORS AFFECTING BONE MINERAL DENSITY IN ELITE FEMALE RUNNERS
By
MAUREEN CARTOON
Approved:
__________________________________________________________ Dan Benardot, PhD, RD, LD, FACSM, Major Advisor
__________________________________________________________ Walter R. Thompson, PhD, FACSM, FAACVPR, Committee Member
__________________________________________________________ Barbara Hopkins, MMSc, RD, LD, Committee Member
iii
ACKNOWLEDGEMENTS
I would like to thank the following persons:
o My advisor Dr Benardot for his expert advice and guidance throughout this research project.
o My committee members Professors Barbara Hopkins and Walter Thompson for their helpful comments and suggestions.
o Yolanda Miller for her administrative assistance.
AUTHOR’S STATEMENT
In presenting this thesis as a partial fulfillment of the requirements for an advanced degree from Georgia State University, I agree that the Library of the University shall make it available for inspection and circulation in accordance with its regulations governing materials of this type. I agree that permission to quote from, to copy from, or to publish this thesis may be granted by the author or, in his/her absence, by the professor under whose direction it was written, or in his/her absence, by the Associate Dean, College of Health and Human Sciences. Such quoting, copying, or publishing must be solely for scholarly purposes and will not involve potential financial gain. It is understood that any copying from or publication of this dissertation which involves potential financial gain will not be allowed without written permission of the author.
NOTICE TO BORROWERS
All theses deposited in the Georgia State University Library must be used in accordance with the stipulations prescribed by the author in the preceding statement.
The author of this thesis is:
Maureen Cartoon 410 River Glen Trace Atlanta, GA 30328
The Chair of the committee for this thesis is:
Dan Benardot, PhD, RD, LD, FACSM Professor and Head of Division of Nutrition Urban Life Building
Georgia State University Atlanta, Georgia 30303
Users of this thesis who not regularly enrolled as students at Georgia State University are required to attest acceptance of the preceding stipulation by signing below. Libraries borrowing this thesis for the use of their patrons are required to see that each user records here the information requested.
NAME OF USER ADDRESS DATE TYPE OF USE
VITA
University of the Witwatersrand, Johannesburg: 1971 - 1973 Bachelor of Science in Chemistry and Biochemistry 1974 Bachelor of Science (Hons) in Pharmacology 1975 - 1977 Master of Science in Organic Chemistry
Thesis title: “A Study of Eximin, a Phenolic Glycoside Ester Metabolite of Protea eximia”.
My Master of Science studies were funded by a bursary from the Council for Scientific and Industrial Research, South Africa.
Queen Elizabeth College, University of London: 1978 - 1981 Doctor of Philosophy in Organic Chemistry,
Thesis title: “Lithiation Reactions of various N-substituted Pyrroles”.
Imperial College, University of London: 1982 - 1983 Diploma of Membership of Imperial College. Post-doctoral research.
Thesis title: “Approaches to Carbon-11 labelled Spiperone and Analogues”.
Albert Einstein College of Medicine, NY:
1989 - 1992 Molecular Biology research on processing of Pro-Somatostatin.
Georgia State University:
ABSTRACT
Introduction: The benefits of regular exercise on skeletal health have been well-documented in terms of stimulation of bone accrual and bone maintenance. Medium-impact sports activities such as running have been demonstrated to exert site-specific enhancement of bone mass in the lower appendicular skeleton. However, elite female runners engaged in high intensity training and sports activity may also be at risk of amenorrhea and low bone mineral density (BMD) resulting from inadequate caloric intake.
Purpose: To investigate the effect of intensive exercise and maintenance of adequate caloric intake on BMD in a group of elite female runners.
Methods: This study represents a secondary assessment of existing data that were obtained between 1994 and 2009. Using dual-energy X-ray absorptiometry, a group of elite runners (n=11) in this study was screened in the Laboratory for Elite Athlete Performance at Georgia State University. This was a longitudinal study in which three sequential measurements of BMD as well as fat and lean tissue body composition of each athlete took place. The average interval between measurements was 1.1 years and 2.6 years respectively. Regional BMD measurements for head, arms, legs, trunk, ribs, pelvis, and spine were assessed, as well as the value for total body BMD. The study participants also received dietary counseling emphasizing daily caloric balance and adequate calcium intake.
Results: The average age of the runners increased from 24.59 (±4.41) to 28.14 (±5.94) years over the study. This was accompanied by an increase in body mass (54.98±3.54 to 56.11±4.07 kg), while height remained constant. The average body mass index (BMI) of the subjects increased from 19.34 to 19.71 kg/m2, largely due to an increase in total percent body fat (13.97±2.96% to 16.01±4.28%). Average regional and total BMD values increased over the study period and increases were between 2 and 4%. At the baseline, a majority of subjects (n=7) had a BMI>19 kg/m2, while a sub-group of runners (n=4) had a BMI˂19 kg/m2. Mean trunk, pelvis and spine BMD parameters for the two BMI groups were significantly different (p˂0.05), with reduced BMD values in the lower BMI sub-group. The average T-scores associated with arm BMD were considerably lower than scores associated with leg BMD values in the runners. The average T-scores for leg BMD values were almost two standard deviations higher than leg BMD values for a reference population at peak bone mass. Two subjects were osteopenic, resulting in an 18% prevalence rate of osteopenia in the group of runners.
iv
TABLE OF CONTENTS
Page
ACKNOWLEDGMENTS...iii
LIST OF TABLES...v
LIST OF FIGURES ...vi
LIST OF ABBREVIATIONS………...vii
CHAPTER I. INTRODUCTION ... 1
Research Objective ...…..3
Hypotheses...3
II. REVIEW OF LITERATURE...4
III. METHODS …………...……….….29
Subjects...29
Assessments... 29
Statistical Analysis... 30
IV. RESULTS...31
V. DISCUSSION AND CONCLUSIONS...47
REFERENCES...53
v
LIST OF TABLES
Page
TABLE 1 Anthropometric Data of Elite Runners………... 31
TABLE 2 Sequential Bone Mineral Density Measurements of Elite Runners…... 34
TABLE 3 Average Percent Change in Bone Mineral Density in Elite Runners during Study………...
35
TABLE 4 Spearman’s Rho Coefficients for Spine, Trunk and Pelvis in
Runners... 37
TABLE 5 Average T-Scores of Elite Runners……… 38
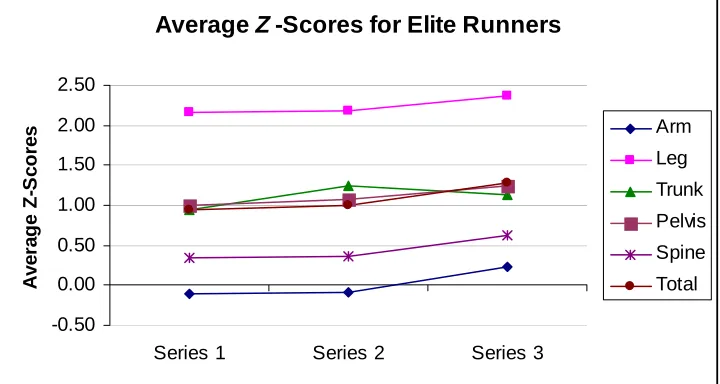
TABLE 6 Average Z-Scores of Elite Runners……… 40
TABLE 7 Body Mass Index, T-Scores and Z-Scores of Osteopenic Subject A…. 41
TABLE 8 Percent Change in Bone Mineral Density in Osteopenic Subject A….. 43
TABLE 9 Body Mass Index, T-Scores and Z-Scores of Osteopenic Subject B….. 44
vi
LIST OF FIGURES
Page
FIGURE 1 Sequential Regional and Total Body Fat Mass of Elite Runners... 32
FIGURE 2 Sequential Regional and Total Body Fat Percent of Elite Runners………... 33
FIGURE 3 Sequential Bone Mineral Content Measurements of Elite Runners………... 33 FIGURE 4 Sequential Bone Mineral Density Measurements of Elite Runners………... 35 FIGURE 5 Average Percent Change in Bone Mineral Density in Elite Runners………... 36 FIGURE 6 Average T-Scores of Elite Runners……… 39
FIGURE 7 Average Z-Scores of Elite Runners……… 40
FIGURE 8 Sequential T-Scores of Osteopenic Subject A……… 42
FIGURE 9 Sequential Z-Scores of Osteopenic Subject A……… 42
FIGURE 10 Percent Change in Bone Mineral Density in Osteopenic Subject A……… 43
FIGURE 11 Sequential T-Scores of Osteopenic Subject B……… 44
FIGURE 12 Sequential Z-Scores of Osteopenic Subject B……… 45
vii
LIST OF ABBREVIATIONS
ATP Adenosine triphosphate
ANOVA Analysis of variance
BMC Bone mineral content
BMD Bone mineral density
BMI Body mass index
Ca2+ Calcium ions
DNA Deoxyribonucleic acid
DRI Dietary reference intake DXA
dyn/cm2
Dual X-ray absorptiometry Dyne per square centimeter
EA Energy availability
EGF Epidermal growth factor
EI Dietary energy intake
FFM Fat free mass
FN Femoral neck
g grams
GH Growth hormone
IGF-I Insulin-like growth factor I
IRB Institutional review board
IU International units
kg Kilograms LBM Lean body mass
mRNA Messenger ribonucleic acid
μg/d Micrograms per day
mg/d Milligrams per day
mg/dl Milligrams per deciliter nm Nanometers
nmol/l Nanomoles per liter NTX N-Telopeptide 25[OH]D 25-Hydroxyvitamin D 1,25[OH]D2 1,25-Dihydroxyvitamin D
OPG Osteoprotegerin pg/ml Picograms per milliliter pmol Picomoles
RANK Receptor activator of nuclear factor kappa B RANKL Receptor activator of nuclear factor kappa B ligand
SD Standard deviation
SPSS Statistical package for the social sciences
TB Total body
TH Thyroid hormone
US United States
1 CHAPTER I
INTRODUCTION
Studies have shown that exercise has a positive effect on bone health (1). In addition,
it is apparent that the greatest accrual of bone mineral density (BMD) occurs during the
early adolescent years, and this may lead to a positive advantage in bone strength during
adulthood, when a reduction in bone density becomes prevalent (2). Severe depletion of
bone tissue may lead to the degenerative condition, osteoporosis, which is a major and
debilitating disease of aging (2). Osteoporosis is associated with increased fragility and
risk of fracture at skeletal sites such as the hip, spine and wrist (3). In 2002, the direct
cost of health expenditure on osteoporotic fractures was estimated at 17.5 million US
dollars and this is expected to increase as the population ages (3).
Physical activity increases the length, width, and mineral content of bones during
childhood and adolescence, as a result of complex torsional interactions between bone
and muscle tissue (2). These positive effects on bone accrual are greater in trained
athletes, where a correlation has been noted between medium and high impact
sports activity and BMD levels, provided adequate caloric and calcium intakes are
maintained (4). Athletes participating in medium and high-impact sports such as running
and gymnastics respectively, were shown to have higher BMD values at all measurement
The positive effect of sustained weight-bearing exercise on bone accrual in female
athletes may however be negated if the “Female Athlete Triad” is present (6). This
syndrome is characterized by disordered eating, amenorrhea and osteoporosis and may be
present in female athletes participating in elite level sports. Intensive exercise
accompanied by inadequate caloric intake may result in hormonal imbalance and
concurrent menstrual irregularities (6). Estrogen is a vital component of positive bone
development. Therefore, the hypoestrogenimia of amenorrhea may result in osteopenia
and if the eating disorder is prolonged, osteoporosis. Eating disorders have been
particularly noted in female athletes engaged in sports such as endurance running, where
slight stature is an advantage. In fact, various studies have estimated the prevalence of
eating disorders at between 15% and 65% in women athletes participating in sports where
thinness is a factor (6).
The importance of adequate caloric intake, as well as the recommended amount of
daily calcium and vitamin D in preserving bone health is well known. For women aged
19-30 years with regular menstrual cycles, the Dietary Reference Intake for calcium is
1,000 mg daily, while 1,500 mg calcium is recommended for women with amenorrhea
(6). Female athletes participating in intense training and sports activities may
underestimate the importance of balanced nutrition in maintaining general as well as
skeletal health (6).
The group of elite runners in this study was screened longitudinally for BMD, as well
as fat and lean tissue body composition, over a period of approximately two years. The
study participants also received dietary counseling emphasizing daily caloric balance and
whether there was a correlation between BMD, fat and lean tissue mass data, and whether
sustained medium-impact exercise and adequate caloric intake influenced these values.
PROBLEM
Elite female runners engaged in high intensity training and sports activity may be at risk of amenorrhea and low BMD as a consequence of inadequate caloric intake.
RESEARCH OBJECTIVE
The objective of this study was to investigate the effect of intensive exercise and maintenance of adequate caloric intake on BMD measurements in a group of elite female runners.
HYPOTHESES
H0: High level exercise and adequate caloric intake has a beneficial effect on the BMD
of a group of elite female runners.
H1: High level exercise and adequate caloric intake has no beneficial effect on
4 CHAPTER II
REVIEW OF LITERATURE
INTRODUCTION
There is a considerable amount of published literature supporting the influence of
exercise, diet, and hormones on the bone mineral density (BMD) of individuals, both
female and male (1). These factors interact in a complex interrelated manner in
supporting bone growth and maintenance. This literature review will describe some of
the current knowledge related to factors affecting female bone mineral density, with a
particular emphasis on premenopausal individuals.
EXERCISE AND BONE DENSITY
Normal Bone Development
The human skeleton fulfills a number of functions, including providing structural
support to the body and facilitating movement in conjunction with the attached muscles
(7). The adult human skeleton is comprised of predominantly two types of bone, which
are structurally dissimilar: dense cortical bone (80%) and honeycomb-like trabecular
bone (20%). Long bones of the appendicular skeleton, such as the humerus, radius, ulna,
femur, tibia and fibula comprise a hollow shaft or diaphysis of cortical bone which
surrounds the inner marrow space. The ends of the long bone, the metaphysis and
of the axial skeleton contain predominantly trabecular bone, a spongy network of
trabecular plates and rods.
The fundamental units of bone structure are osteons, and it is at this level that dynamic
changes occur in skeletal structure (7). The skeleton is in a constant state of flux, with a
dynamic interplay between the process of modeling during bone growth and
development, and remodeling during bone repair and aging (2). Typically, bone growth
occurs on the outer or periosteal surface of bone, leading to increasing bone width (7).
On the other hand, the inner or endosteal surface of bone is the site of remodeling activity
(7). Factors such as age, physical activity, adequate nutrition and hormonal status may
all affect the overall balance between the modeling and remodeling processes (2).
Mechanotransduction in Bone
Current research suggests that osteocytes, the most numerous bone cells, act as
biological sensors responding to mechanical stimulation of bone tissue (8). Specifically,
imposition of a load on skeletal tissue results in pressure gradients and movement of
interstitial fluid, which transmits shear stress to responsive areas of the osteocytes (8).
Osteocytes, which are located in the interior of bone tissue, communicate with osteoblasts
(modeling) and osteoclasts (remodeling) via cellular dendritic processes which permeate
bone tissue (9). Close cell-to-cell contact is established between osteocytes and
responsive cells via gap junctions which are essential for the transmission of mechanical
signals in bone (9). Connexins, such as Cx43, an integral membrane protein, are present
in gap junctions and allow the passage of metabolites and signaling molecules between
processes following mechano- stimulation include prostaglandin PGE2, adenosine
triphosphate (ATP) and nitric oxide (10).
The signaling cascade resulting from mechanical stimulation of osteocytes is complex
and only partially understood. An in vitro study using murine MLO-Y4/MC3T3 cells,
which mimics an in vivo osteocyte/osteoblast system, has shed some light on interactions
between these bone cells (10). A cellular co-culture was established with osteocytes and
osteoblasts physically separated but which allowed fluid flow through the equivalent of a
gap junction between the cells. Exposure of the osteocytes to physiological levels of fluid
shear (4.4 dyn/cm2) resulted in increased alkaline phosphatase activity and initiation of a
calcium (Ca2+) wave signal in the shielded osteoblasts. The presence of a gap
junction-like contact between osteocytes and osteoblasts was essential for the transmission of the
mechanical stimulus to osteoblasts (10).
There is also experimental evidence that mechanical loading inhibits the process of
osteoclastogenesis through regulation of the two factors, receptor activator of nuclear
factor kappa B ligand (RANKL) and osteoprotegerin (OPG) (11). The gene product OPG
acts as a “decoy” receptor binding to RANKL and blocking maturation of osteoclasts.
Mechanical loading in bone tissue has been shown to decrease the RANKL/OPG mRNA
ratio, and therefore exert a protective effect on bone tissue (11).
Biomechanical Aspects of Bone Development
In healthy individuals, there is a direct relationship between an individual’s muscle
mass, as estimated by lean body mass (LBM) and bone mass or bone mineral content
during dynamic growth periods, such as childhood and early adolescence (12). In fact,
contracting muscle imposes a larger strain on bone than gravity, and is the major stimulus
promoting accumulation of bone mass and bone strength (13).
The mechanostat theory of bone development postulates that an increase in muscle
mass precedes bone growth in puberty (12). In a longitudinal Canadian study which
included 68 adolescent girls, the mean peak accrual of LBM occurred at age 12.19 years,
which was followed six months later by accrual of mean peak BMC at 12.69 years. This
lag in peak bone development occurred both at the whole body level, as well as in the
upper and lower limbs.
Inherent in the mechanostat theory of muscle-bone interaction is the concept that
bones adapt to the strain imposed by muscle contraction (14). Within normal limits,
when strain thresholds in bone are exceeded, modeling occurs, resulting in an increase in
periosteal growth and a net accrual of BMC. Body weight also increases with age and
contributes to the load applied to bone by muscle contraction (15). As a result of a
balance between modeling and remodeling, mechanical stress on bone results in changes
in bone shape and size (16).
Maximal muscle force applied to bone is usually measured indirectly and provides an
estimate for the amount of strain applied to bone, as well as changes in bone mineral
content (15). For example, a group of 37 women (age 18-26 years) was subjected to five
months of isokinetic concentric or eccentric resistance training applied to the
non-dominant arm or leg (17). Concentric resistance training results in shortening of muscles
during contraction, while eccentric resistance training results in lengthening of muscles
muscular loads, and consequently, increased skeletal loads. As a result of the asymmetric
loads applied, an increase in LBM as well as BMD in the trained limbs was noted
(p<0.001) for both forms of resistance training.
In addition to providing strength and support, the skeleton also has the property of
lightness, allowing mobility (18). It is notable that although bones may differ greatly in
shape and size, the BMC of longer, wider or narrower cross-sections of bone may not
differ greatly in the amount of bone mineral present. For example, smaller bone cross
sections may contain more bone mineral to avoid fragility. Conversely, wider
cross-sections, may contain less bone mineral relative to size to preserve lightness. Yet, both
smaller and larger bones may have the same volumetric bone density measurement.
Bone shape, size and mass distribution is achieved by appositional growth or modeling
on the periosteal surface balanced by endosteal remodeling. In addition to the influence
of LBM on bone development, genetic factors delineating bone growth are also apparent.
Exercise and Bone Mass during Childhood and Early Adulthood
There is considerable support for the suggestion that “senile osteoporosis is a pediatric
disease” (19). This statement relates to the observation that adult peak bone density may
be enhanced by physical activity or sports participation during pre-puberty and early
adolescence (20). During the pubertal growth spurt period (11-13 years in girls and
12-14 years in boys), approximately 25% of the adult BMC is reached (19). This amount of
bone accrual approximates the proportion of bone loss during post-menopause (21). In
addition, during the four perimenarcheal years in girls, 47% of the mass of the future
period may result in later protection against osteopenia or osteoporosis. Small
increments of BMD during childhood may be significant in later years. In fact,
epidemiological studies show that a decrease in BMD by one standard deviation unit
(SD) doubles bone fracture risk in adult females.
The accumulation of bone mass during childhood and early adolescence is dependent
on simultaneous development of skeletal muscle, which exerts forces on the attached
bone, resulting in bone development (19). Weight-bearing activities such as running and
jumping exert intermittent compression of the growth plates at the ends of long bones and
stimulate bone growth (19). In the case of girls, rapid bone growth occurs predominantly
in the pre-pubertal period resulting in an increase of bone size, strength and structure
(21). Both endocortical and periosteal expansion takes place, with a minimal increase of
BMC after the onset of puberty in girls (19). The pre-pubertal years in girls therefore
offer a window of opportunity during which the introduction of regular weight-bearing
activity may stimulate bone growth over and above normal daily activity (21).
Several recent reviews have analyzed the evidence corroborating the benefits of the
early introduction of regular physical activity in children (22). In general, early pubertal
study populations (Tanner I-III) reported increases in bone parameters over a six-month
period compared to inactive controls (p˂0.05) (22). Although the short-term benefits of
physical activity are well documented, the exact duration and intensity required to
produce maximal effect is unclear in this population group (19).
In order to estimate the type and duration of physical activity required to promote
bone development, a Swedish Pediatric Osteoporosis Prevention study followed a group
(21). The intervention group participated in a daily school-based exercise program
involving 40 minutes of indoor and outdoor physical activity, including ball games,
running and jumping. The authors wished to utilize typical activities enjoyed by young
children in order to minimize dropout rates. The control group for this study was an
age-matched group at a second school, exposed to 60 minutes of physical activity per week.
The authors of this study analyzed BMC and BMD data pertaining to total body (TB),
lumbar spine (L2-L4 vertebrae), third lumbar vertebra (L3), femoral neck (FN) and leg.
The girls in the intervention group experienced an average increase of 2.8% and 3.1% in
BMD (p<0.001) in the lumbar spine and L3 vertebrae respectively, compared to the
control group (21). An additional advantage seen in the intervention group was a 2.9%
gain in bone width at L3 compared with controls. This study suggests that physical
activity in young children may contribute to BMC and BMD, which may protect against
future fracture risk.
Another longitudinal study investigated the longer-term results of the early
introduction of physical activity in a Canadian population (23). The authors accessed
bone parameters from the University of Saskatchewan’s Pediatric Bone Mineral Accrual
Study (1991-1997; n=154, 82 females and 72 males, 8 to 15 years). The bone parameters
of the study group were subsequently re-evaluated in young adulthood (2002-2006; 23-30
yr). In the case of young females, individuals who were physically active in childhood
remained more active in young adulthood. In addition, analysis of BMC of young adult
females showed an increase of 8.6% and 9.5% (p˂0.05) in BMC at the total hip (TH) and
fractures are particularly prevalent and costly in osteoporotic patients, any strengthening
effect on bone conferred in childhood and early adulthood is to be encouraged (24).
Types of Sports and Bone Density
Studies involving recreational as well as elite athletes have provided valuable
information regarding the relationship between types of sports activities and bone mineral
data, due to the repetitive and dedicated nature of lean tissue and skeletal system
stimulation in these individuals (25). Observations among athletes support the fact that
the skeleton adapts to the magnitude and frequency of the load applied to it (26). In the
first instance, increase in muscle size as a result of physical activity results in a
corresponding increase in bone mass and size, in part determined by genetic factors
including body mass (25). A study illustrating the parallel increase of lean tissue mass
and BMD (25) involved a group of female competitive tennis players (n=47; 8-17 years.
Across the group, there was a 6-13% increase in muscle and bone parameters in the
playing arm of these individuals. Interestingly, regression analysis of the data in this
study revealed that increased muscle area in the playing arm accounted for only 12-16%
of the variance in corresponding arm BMD values (25). This study suggests that the
enhanced muscle size of the playing arm is directly attributable to increased use, since
genetic, nutritional and hormonal factors apply to both arms. The additional
enhancement of BMD in the playing arm may be due to the direct effect of impact
loading, including vibrational type osteogenic stimulation, which has been demonstrated
In addition to muscle stimulus of bone tissue, the mechanical loading imposed by
specific sports activities is accompanied by site-specific enhancement of BMD (27).
Skeletal tissue appears to be particularly responsive to dynamic loading as opposed to
static loading (28). In order to elicit a significant osteogenic response, sports-related
mechanical stimuli are most effective when the threshold intensity is exceeded. In
addition, strain frequency is a factor, since the biological response of bone to mechanical
stimulation is most effective during sports involving brief but intermittent patterns of
exertion. As a result, sports involving high-impact and odd-impact motion, such as
volleyball, hurdling and squash have a more pronounced effect on BMD than
lower-impact sports such as running, swimming and diving (29).
The effectiveness among disparate sports in eliciting site-specific osteogenesis was
examined in a recent study (30). The authors enlisted collegiate female athletes (n=99;
20.2±1.3 years) and compared site-specific BMD data across a range of sport categories.
Sports participants were engaged in weight-bearing activities such as gymnastics,
softball, field hockey, soccer and cross country running, as well as non-weight-bearing
activities including swimming/diving and crew. In addition to sports category,
assessment of the participants’ menstrual status was noted, with 23 athletes being
oligomenorrheic (4-9 menstrual cycles/year) or amenorrheic (0-3 menstrual cycles/year).
Regression analysis in this study showed that body mass and type of sport were general
predictors of total-body, pelvic and average leg BMD. As anticipated, swimmers and
divers, as participants in non-weight-bearing activities, had low site-specific BMD values
compared to other categories of athletes. This was in contrast to gymnasts, who exhibited
gymnastic training regimen. The runners who participated in this study had lower
site-specific BMD values, particularly in the lumbar spine (0.988±0.118 g/cm2) and pelvic
regions (1.023±0.085 g/cm2), than the swimmers/divers examined (lumbar spine:
1.079±0.107 g/cm2; pelvis: 1.060±0.071 g/cm2). The authors note that the lower BMD
values for runners in this study may be related to disordered eating and consequent
disruption of the menstrual cycle which may be prevalent in this athlete population, in
which relatively low BMI confers a competitive advantage (30).
Runners and Bone Density
Running and the Appendicular Skeleton
The physical activity of running has been variously reported as exerting both positive
as well as negative effects on skeletal health and maintenance (31). In a positive sense,
running has been classified as a medium-impact athletic activity, which may confer some
site-specific enhancement of BMD over non-athletic controls, provided that menstrual
dysfunction is not a factor (5). A more general assessment of benefits of running among
premenopausal women (age 16-68 years) concluded that running a minimum of 3 hours
per week had a positive effect on BMD parameters, particularly at the proximal femur
(31).
In order to evaluate the positive effects exerted by running on the skeleton, it is
helpful to consider three categories of runners: sprinters, middle distance and endurance
athletes (32). Sprinters are regarded as power athletes, and as such, are subject to
maximal intensity training and competitive activity, involving loading at both upper and
radius of sprinters middle-distance runners, and long-distance runners to assess this
concept further (33). The authors found that surrogate measures of bone strength, such as
tibial BMC, cortical area and polar moment of resistance were greatest in sprinters, due to
both larger mechanical strain exerted by tibial muscles, as well as greater ground reaction
forces experienced. Surprisingly, there were no significant differences between radial
BMC parameters in sprinters and longer distance runners in this study, which may have
been a function of the amount of upper body conditioning carried out by runners in this
study.
Further studies on female runners have confirmed that female power athletes,
including sprinters have greater BMD values at the lower limb, lumbar spine and upper
limb sites, compared with female endurance athletes, where only foot and tibia/fibula
BMD values were enhanced (32). These results support the prediction that ground
reaction forces are greatest on the foot and leg in endurance athletes, and this is observed
as enhanced BMD values in these athletes, relative to BMD values for the upper limbs
(32). This observation was supported in a detailed study of BMD parameters at multiple
skeletal sites in female endurance runners (30.8±5.6 years), training an average distance
of 32.3±17 km per week) (34). The authors noted that the greatest site-specific
enhancement of BMD in these runners was in the legs, whereas BMD was lowest in the
arms, ribs and thoracic spine, which are further removed from the site of active skeletal
Distance Runners and Decreased Bone Density
In contrast to positive site-specific effects of running on the appendicular skeleton,
there are studies describing low BMD values associated with elite and sub-elite runners
(35, 36). Decreased BMD values are of particular concern in adolescent runners, in
whom compromised BMD at trabecular sites such as the lumbar spine might lead to an
increased risk of osteopenia (36). The etiology of decreased BMD values in competitive
runners is generally related to inadequate caloric intake relative to energy expenditure
(37). This in turn results in central suppression of reproductive function,
hypoestrogenism and decreased osteogenesis.
In one study, slenderness or low BMI as well as volume of exercise were factors
negatively affecting lumbar spine BMD values in endurance runners (35). It was
suggested that high weekly running distances likely created a caloric deficit which
negatively affected bone formation in this athlete population. The authors reported that
in addition to increased caloric intake, introduction of weekly resistance training was
beneficial in increasing lumbar BMD in endurance runners.
NUTRITION STATUS AND BONE DENSITY IN FEMALE ATHLETES
Adequate Caloric Consumption
Female athletes engaged in sport activities favoring slight body build, low body
weight or slender appearance may be at risk of chronic energy deficit which compromises
reproductive and skeletal health (38). Calorie deficit is of particular concern during
puberty (age 12 to 16 years in girls) when 40% of bone mineral is accumulated (38).
Compromised bone development is a risk factor for stress fractures and
A joint position statement issued by the American Dietetic Association and the
American College of Sports Medicine has addressed under-consumption of calories by
athletes (40). This evidence-based statement includes guidelines for adequate
carbohydrate, protein and fat consumption during training, performance and recovery
periods in order to “maintain body weight, replenish glycogen stores and repair body
tissue”. Restriction of caloric intake by athletes may also compromise micro-nutrient
intake, particularly calcium and vitamin D, which are required for skeletal health.
Estimation of adequate energy intake relative to expenditure
In order to understand the relationship between energy intake, exercise expenditure
and essential physiological energy needs, a relatively recent concept, energy availability
(EA) has been introduced (4). Energy availability has been defined as “dietary energy
intake (EI) minus exercise energy expenditure”, and represents the amount of energy
remaining post-exercise for basic body metabolism (4). Included in the EA calculation is
the value for fat free mass (FFM), since this is the tissue expending the greatest
proportion of energy consumption (41).
It has been estimated that the resting metabolic rate in normal healthy young females
represents an energy availability of about 30 kcal/kg FFM/day while inclusion of average
daily activities raises energy availability requirements to approximately 45 kcal/kg
FFM/day (4). In contrast, studies have shown that reduction of energy availability below
30 kcal/kg FFM/day in female athletes leads to suppression of menstrual function and
For the purpose of investigating the relationship between energy restriction and
aerobic exercise expenditure, a study involving a group of eumenorrheic women (age
21.4±0.6 years) found an inverse relationship between markers of bone resorption and
bone formation after five days of severe energy restriction (42). In fact, at an energy
availability of 10 kcal/kg FFM/day, bone resorption and bone formation became
uncoupled and procollagen urinary N-telopeptide, an index of bone resorption, increased
significantly (p˂0.01). In contrast, levels of plasma osteocalcin, a marker of bone
formation, were suppressed at energy availability levels below 30 kcal/kg FFM/day
(p˂0.05) in this study group. The uncoupling effect on bone resorption and bone
formation in the presence of chronic under-nutrition may have a deleterious effect on
achievement of peak bone density in younger athletes (42).
Weight maintenance and athletic performance
Female athletes engaged in aesthetic-type sports activities and sports that emphasize
slight stature are particularly prone to engage in unhealthy eating behaviors in an attempt
to reduce weight or change body composition (38). This behavioral pattern is related to
the perception that body weight and particularly percent body fat, is closely related to
athletic performance (38). Young athletes may not realize that with an increased level of
training, enhanced lean mass, which is denser, may replace fat mass and consequently,
body mass may remain unchanged or even increase.
In order to discourage unhealthy eating practices and caloric restriction, which may
also affect athletic performance, nutrition education is recommended, particularly with
gymnasts and runners suggested that within-day energy balance deficits (>300 kcals)
might paradoxically result in increased body fat percentages in both gymnasts (r=0.508;
p=0.001) as well as runners (r=0.461; p=0.041) (43). This observation may be due to an
adaptive response of the human body to perceived famine and a corresponding reduction
in resting metabolic rate and increase in fat storage (44).
Female Athlete Triad in Runners
Inadequate caloric intake and menstrual disorders
The Female Athlete Triad, encountered in some female athletes, is an inter-related
spectrum of disorders involving decreased energy availability, altered menstrual function
and compromised bone density (45). Low energy availability in these athletes may be the
result of conscious altered eating patterns or inadvertent caloric deficit related to
increased exercise expenditure (41). Unlike the situation of food deprivation, which
induces hunger, increased exercise energy expenditure may not cause a related hunger
response, resulting in an inadvertent energy deficit in affected athletes.
Chronic calorie deficit with energy availability levels below 30 kcal/kg FFM/day has
been associated with disruption of the female reproductive cycle (46). This is a
physiological adaptive response: by reducing energy expended on reproductive processes,
the brain is spared from a glucose deficit (47). In fact, detailed studies have
demonstrated that low energy availability results in disruption of the
hypothalamic-pituitary-ovarian axis, resulting in drastic reduction of estrogen release (46).
A closely-monitored investigation of energy availability, intense exercise activity and
there was disruption of gonadotropin-releasing hormone in the hypothalamus which
resulted in consequent disruption of luteinizing-hormone pulsatility and frequency of
release from the pituitary gland (47). The altered luteinizing-hormone release patterns in
turn disrupted ovarian functioning and estrogen as well as progesterone release. These
authors also demonstrated that low energy availability rather than the stress of exercise
was associated with altered luteinizing hormone pulsatility, since control subjects
receiving adequate calories (45 kcal/kg FFM/day) did not experience hormonal
disruption. Studies have therefore shown that exercise per se does not have a negative
effect on reproductive health, beyond the effect of physical activity on energy availability
(47, 48).
Menstrual disorders and decreased bone density
There is a spectrum of menstrual disorders described in athletes diagnosed with the
Female Athlete Triad, ranging from primary or secondary amenorrhea (absence of
menses for 3 months or more) through oligomenorrhea, which is characterized by longer
menstrual cycles (48). In the general population, prevalence of secondary amenorrhea or
oligomenorrhea is estimated at 2% to 5% (46). However, in athletes engaged in sports
where slight stature is significant, menstrual disorders range from 21% in runners to 61%
in rhythmic gymnasts (48).
Menstrual disorders associated with chronic low energy availability in female athletes
may result in increased bone turnover associated with both low body mass index (BMI)
and decreased estrogen levels (49). In fact, a study of women distance runners (age
levels in a group of amenorrheic runners (49). This early study suggested a link between
chronic energy deficit, altered hypothalamic function and increased bone turnover in this
group of amenorrheic female runners.
The presence of menstrual disorders and decreased BMD predisposes competitive
female athletes to stress fractures, particularly of the tibia, foot and femur, in the case of
runners (50). Stress fractures may be minimized in this athlete group by promoting
adequate nutrition, both in terms of caloric consumption as well as calcium and
micronutrient intake (40).
Restoration of menstruation increases bone density
Functional hypothalamic amenorrhea associated with the Female Athlete Triad results
in lower BMD values in affected athletes (51). Treatment of the amenorrhea component
of the triad with hormones, both estrogen replacement therapy as well as oral
contraceptives, has proved relatively ineffective, inferring that the etiology of the
menstrual disturbance is complex and involves hormones in addition to estrogen.
However, an overall anabolic effect on bone was noted following weight gain in addition
to restoration of menstruation in some amenorrheic individuals (52). Increases in the
BMD values for both spine (4.38±7.48 %; p˂0.05) and hip (3.77±8.80 %; p˂0.05) were
noted. A significant result in this study was the observation that weight gain in this group
was accompanied by an increase in serum osteocalcin values, while a marker of bone
resorption, N-telopeptide (NTX) only decreased following resumption of menses. The
menstrual regularity in these formerly amenorrheic individuals resembled coupled bone
metabolism in eumenorrheic individuals (41).
Calcium Intake and Bone Health
In bone tissue, calcium combines with phosphorus to form the inorganic mineral
compound hydroxyapatite (Ca10(PO4)6(OH)2) which constitutes 70% of skeletal mass
(53). The organic structural component of bone is predominantly the protein, type 1
collagen (22%). Thus both an adequate calcium and protein intake are essential for bone
development and health. The physiological blood serum level of calcium is tightly
regulated (8-12mg/dl) and parathyroid hormone is recruited to maintain this calcium
concentration by increasing dietary calcium absorption, increasing bone resorption and
decreasing calcium excretion by the kidneys. Vitamin D is directly involved in
maintaining serum calcium levels and low vitamin D status may compromise skeletal
health.
Optimal calcium intake and early adolescence
There is considerable research supporting the importance of an adequate calcium
intake during the pubertal growth spurt in adolescent females (54). During a 3- to 4-year
period, beginning at an average age of 12.5 years in females, 40% of adult bone mass is
accumulated (54). The dietary reference intake (DRI) for calcium in adolescent females,
age 9 to 13 years is 1300 mg/d (55). Decreased calcium intake during this period has led
to increased incidence of childhood bone fractures, particularly affecting individuals who
Levels of daily calcium intake for active premenstrual females
Research studies have shown a positive linear correlation between dietary calcium
intake and spinal trabecular BMD values in amenorrheic compared with eumenorrheic
elite athletes, such as runners and ballet dancers (56). In addition, an association has been
noted between the level of calcium intake and prevalence of stress fractures in female
athletes.
Although the recommended calcium intake for the female population age group, 19 to
30 years, is 1,000 mg/d, a higher calcium intake (1,500 mg/d) has been suggested for
female athletes who are oligomenorrheic or amenorrheic (56).
Vitamin D and Bone Maintenance
Role of vitamin D in calcium homeostasis
Vitamin D may be formed endogenously from 7-dehydrocholesterol in the skin,
following exposure to ultraviolet B radiation (wavelength 290-315 nm) (57). The
vitamin may also be ingested as cholecalciferol (vitamin D3) or ergocalciferol (vitamin
D2) in the diet (57). Vitamin D is hydroxylated at the position in the liver to form
25-hydroxyvitamin D (25[OH]D), the major circulating form, which is in turn converted to
the active form 1,25-dihydroxyvitamin D (1,25[OH]2D), in the kidney. The
1,25-dihydroxy derivative of cholecalciferol plays an essential role in the intestinal absorption
of calcium, by increasing the expression of the calcium-binding protein calbindin, which
assists in the transport of calcium ions from the luminal to the basolateral surface of the
Vitamin D levels in the general population and athletes
Current assessment of dietary vitamin D intake, as well as serum 25[OH]D levels in
the general population suggests that some individuals are not attaining recommended
vitamin D status (58). There is no consensus on vitamin D concentrations at present, and
desirable serum 25[OH]D levels in adult females range from 50 nmol/l to 75- 80 nmol/l
(59). These relatively high levels of serum 25[OH]D appear to minimize secondary
hyperparathyroidism (parathyroid levels >65pg/ml) and consequent bone resorption (60).
There is concern that the current DRI for vitamin D (5μg/d) for women, ages 9-50 years,
is inadequate to support desirable serum 25[OH]D concentrations (58).
Since vitamin D plays an essential role in calcium homeostasis and consequently
skeletal health, athletes should be screened for possible vitamin D deficiency (40).
Athletes in northern latitudes or indoor sports participants may be particularly at risk for
inadequate vitamin D status and related skeletal issues (59).
In order to increase vitamin D levels, either limited sun exposure “twice a week
between the hours of 10 a.m. and 3 p.m. on the arms and legs for 5-30 min, depending on
season, latitude, and skin pigmentation” or dietary supplementation with 1,000-2,000 IU
(20-40μg) vitamin D3 per day has been recommended by one author (59).
ROLE OF HORMONES IN BONE DEVELOPMENT AND MAINTENANCE
Pivotal role of sex steroids in bone health
The estrogen sex steroid hormones play an essential role in both the attainment as well
as the maintenance of peak bone mass in premenopausal females (61). The chief
predominantly by the ovaries and to a lesser extent by adipose tissue (62). Estradiol
interacts with either α- or β-estrogen receptors present on osteoblasts or osteoclasts,
acting overall to conserve bone mass (63). In the context of bone metabolism, the
estrogen receptors together with their substrate estradiol, complex with particular
deoxyribonucleic acid (DNA) response elements in the bone cell nucleus, controlling the
transcription of relevant genes associated with bone functioning (62).
Estrogen receptor expression in bone tissue is complex, and estrogen-activated
signaling sequences have been identified in osteoblasts, osteoclasts and osteocytes, as
well as in the immune system (64). In addition, estrogen receptor function may be
modulated in the presence of hormones such as growth hormone (GH) and thyroid
hormone (TH), as well as polypeptide growth factors such as epidermal growth factor
(EGF) and insulin-like growth factor-I (IGF-I) (64).
Bone size in puberty and direct control of sex steroids
Estrogen is involved in the growth spurt observed during puberty in adolescent
females, resulting in an increase in skeletal size (65). The longitudinal growth of bones
during puberty involves the complex interaction of endocrine signals including estrogen,
GH, TH, IGF-I and vitamin D. These hormones and growth factors influence
development, maturation and closure of the growth plate, influencing final stature.
Anti-resorptive role of estrogen: Balance between modeling and remodeling
The process of bone remodeling is tightly controlled in premenopausal women and
effects of osteoclasts (66). One of the critical regulatory factors involved in bone
remodeling is the glycoprotein osteoprotegerin (OPG) secreted by osteoblasts as well as
by certain immune cells (67). The protein factor OPG acts as a decoy receptor competing
with the secretory protein, receptor activator of nuclear factor kappa B ligand (RANKL)
for the receptor activator of nuclear factor kappa (RANK), located on immature
osteoclasts (66). The activation and maturation of osteoclasts follows the interaction of
the factor RANKL with the receptor RANK (67). The interaction between RANKL,
RANK and OPG are currently regarded as key control areas in bone metabolism (64).
Significantly, the ratio of OPG versus RANKL in osteoblasts is regulated by hormones
such as estrogen, as well as by cytokines secreted by immune system T cells (66).
Estrogen thus plays an essential role in maintaining bone mass by regulating osteoclast
activity and rate of bone resorption (64).
In addition to the regulatory effect of estrogen on OPG expression in bone tissue,
physical activity has also been noted to increase OPG levels in premenopausal women.
A recent study involving premenopausal exercising women (age 24.2±1 years) reported
that OPG levels were higher (p=0.005) in a group of exercising normally menstruating
women (5.2 ±0.2pmol/l) versus exercising amenorrheic women (4.6±2pmol) (68). The
authors suggest that depressed OPG expression in the amenorrheic subjects was a
consequence of chronic estrogen deficiency related to hypothalamic amenorrhea in this
group of women. The amenorrheic exercising group of women also had lower BMD
values at the total body level as well as lumbar spine (p=0.015), compared with
Age-related bone loss
The gradual cessation of estrogen secretion by the ovaries during menopause is
accompanied by a more rapid decline in bone mass, particularly affecting trabecular bone
(61). During the post-menopausal years, loss of the moderating effect of estrogen on
bone resorption results in increased osteoclast activity on the endosteal surface of bone
and consequent net bone loss. Inadequate calcium and vitamin D intake at this time may
initiate secondary hyperparathyroidism, further contributing to bone resorption.
Uncontrolled bone loss in post-menopausal women is associated with the risk of
osteopenia, osteoporosis and bone fractures (69). However, increased weight-bearing
and resistance activities in post-menopausal women have been noted to attenuate the loss
of BMD.
Other significant hormones required for bone maintenance
In addition to the essential role played by estrogen in bone metabolism, a complex
network of endocrine hormones and immune-system factors interact to sustain skeletal
health (70). Some of the more important hormones involved in the development and
maintenance of bone include leptin, insulin, GH, TH, and IGF-I (71).
The role of leptin in bone health
Studies on in vitro bone cell cultures have shown that the hormone leptin, secreted by
adipose tissue, plays a significant role in the differentiation of osteoblasts and the
tissue such as bone cells, as well as in the central nervous system, where leptin may
interact with hypothalamic and pituitary endocrine axes (71).
Studies have shown that amenorrheic athletes are prone to hypoleptinemia, which has
been ameliorated by treatment with recombinant human leptin (73). In addition to
increased levels of estradiol, TH and IGF-I, leptin treatment of a group of amenorrheic
athletes resulted in higher levels of the markers osteocalcin and bone alkaline
phosphatase (p˂0.001) associated with bone formation (73). Bone loss in amenorrheic
athletes has not typically been fully compensated by weight gain and restoration of
menstruation (74). The loss of fat mass, and hence leptin-synthesizing capacity in
amenorrheic athletes may be a significant factor resulting in bone loss in these
individuals, suggesting possible leptin treatment (70).
CURRENT EVIDENCE REGARDING EXERCISE AND BONE HEALTH
Weight-bearing exercise in premenopausal women
Skeletal development is influenced by genetic disposition, physical activity, nutrition
and endocrine factors (1). It is now well recognized that physical activity, particularly
regular weight-bearing exercise, is a major positive contributor to bone development and
maintenance (75). Although the exact nature of the biochemical signaling pathway
leading to bone mineralization is not fully understood, there is considerable experimental
support for bone accrual resulting from increased strain magnitude, frequency and rate of
Exercise recommendations throughout the lifecycle
Regular physical activity is particularly beneficial in contributing to enhanced bone
mass during the pubertal growth spurt in adolescent girls, when 40-50% of adult bone
mass is accumulated (36). By maximizing bone mass during this developmental period,
the prevalence of osteopenia and osteoporosis in later years may be lessened (76). The
inclusion of weight-bearing exercise and resistance training in post-adolescent women
has also contributed to osteogenesis and maintenance of bone health (1). While there is
currently no gold standard prescription for exercise and bone health, there is experimental
support for maximum osteogenesis following physical activities including multiple short
loading-cycles, rather than sustained endurance training, in which there is saturation of
the osteogenic response (1).
Finally, regular exercise, particularly resistance training, in post-menopausal women
(age 60±5 years), has been shown to increase total and hip BMD, which is advantageous
in this population group (69). Regular physical activity is therefore beneficial throughout
CHAPTER III
METHODS
SUBJECTS
The athletes in this study were eleven elite female middle- and long-distance runners,
who were assessed in the Laboratory for Elite Athlete Performance at Georgia State
University. This study represents a secondary assessment of existing data that were
obtained between 1994 and 2009. Original data were obtained followed procedures
approved by the Institutional Review Board (IRB) of Georgia State University. The
current study was granted IRB approval on June 19, 2009 (Appendix A).
ASSESSMENTS
The anthropometric parameters body mass (kg) and height (cm) were obtained on a
standard physician balance beam scale. Body composition was obtained using
dual-energy X-ray absorptiometry (DXA) and a LUNAR (Lunar Corporation, Madison, WI)
model DPXL machine and software version 1.34 (43). Quality assurance tests were
performed prior to assessment of each subject.
Bone mineral content (kg), areal BMD (g/cm2), fat mass (kg) and lean mass (kg) were
assessed from full-body DXA scans of the subjects. Each subject was assessed for bone
parameters and soft tissue composition at baseline (series 1 data), as well as two
subsequent measurements at an average interval of 1.1 years (series 2 data) and 2.6 years
(series 3 data). One subject was not available for collection of series 3 data and an
received nutrition-related counseling regarding daily and within-day caloric balance, as
well as recommendations for daily calcium intake (43).
STATISTICAL ANALYSIS
All data were analyzed using SPSS version 17.0. Differences between the three series
of BMD and soft tissue measurements were compared using repeated-measures Model II
ANOVA with Bonferroni post hoc test. Model II ANOVA was selected on account of
the unequal sample size in series 3 (n=10). Correlations between BMD at specific sites
were obtained using Spearman’s rho coefficients for non-parametric data. Independent
t-tests were used to determine differences in BMD between subject groups.
31 CHAPTER IV
RESULTS
ANTHROPOMETRIC PARAMETERS
The subjects described in this longitudinal study were a group (n=11) of elite female
runners who were assessed for bone density, as well as lean mass and fat mass
parameters. The runners were assessed at baseline (series 1 measurement) and
subsequently re-evaluated at approximately one year intervals (series 2 and series 3
measurements). The mean values (±SD) for age, total body mass, height, BMI, percent
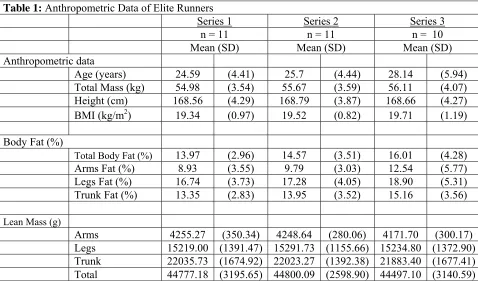
[image:43.612.110.588.422.703.2]body fat and lean tissue mass are shown in Table 1.
Table 1: Anthropometric Data of Elite Runners
Series 1 Series 2 Series 3
n = 11 n = 11 n = 10
Mean (SD) Mean (SD) Mean (SD)
Anthropometric data
Age (years) 24.59 (4.41) 25.7 (4.44) 28.14 (5.94)
Total Mass (kg) 54.98 (3.54) 55.67 (3.59) 56.11 (4.07)
Height (cm) 168.56 (4.29) 168.79 (3.87) 168.66 (4.27)
BMI (kg/m2) 19.34 (0.97) 19.52 (0.82) 19.71 (1.19)
Body Fat (%)
Total Body Fat (%) 13.97 (2.96) 14.57 (3.51) 16.01 (4.28)
Arms Fat (%) 8.93 (3.55) 9.79 (3.03) 12.54 (5.77)
Legs Fat (%) 16.74 (3.73) 17.28 (4.05) 18.90 (5.31)
Trunk Fat (%) 13.35 (2.83) 13.95 (3.52) 15.16 (3.56)
Lean Mass (g)
Arms 4255.27 (350.34) 4248.64 (280.06) 4171.70 (300.17)
Legs 15219.00 (1391.47) 15291.73 (1155.66) 15234.80 (1372.90)
Trunk 22035.73 (1674.92) 22023.27 (1392.38) 21883.40 (1677.41)
The average age of the runners increased from 24.59 (±4.41) to 28.14 (±5.94) years
over the duration of the study. The increase in age of the runners was accompanied by a
corresponding increase in body mass (54.98±3.54 to 56.11±4.07 kg), while height
parameters remained constant. The average BMI of the subjects increased from
19.34±0.97 to 19.71±1.19 kg/m2 (p>0.05), and this change was largely due to the
increase in total percent body fat (13.97±2.96% to 16.01±4.28%; p>0.05) since lean
tissue mass remained almost constant, as shown in Table 1. In support of the percent
body fat and BMI trend, the Spearman’s rho coefficient for the relationship between BMI
and percent body fat showed a strong positive correlation between these two parameters
(r=0.573, p=0.07 for series 2; r=0.711, p=0.02 for series 3). The increase in regional and
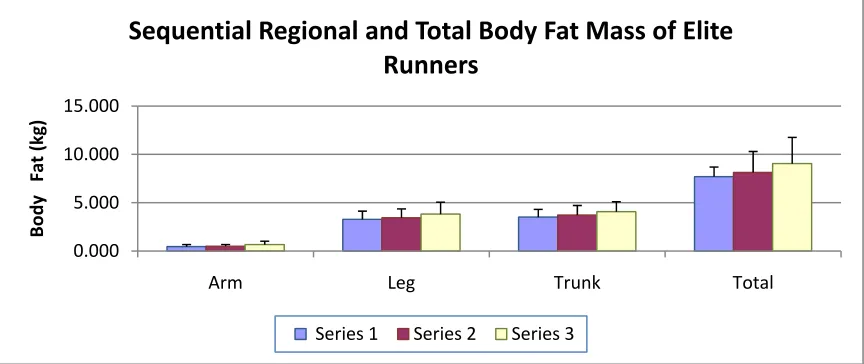
total fat mass as well as the increase in regional and total body fat per cent in the runners
[image:44.612.110.542.432.614.2]is depicted in Figures 1 and 2.
Figure 1
0.000 5.000 10.000 15.000
Arm Leg Trunk Total
Body
Fat
(kg)
Sequential
Regional
and
Total
Body
Fat
Mass
of
Elite
Runners
Figure 2
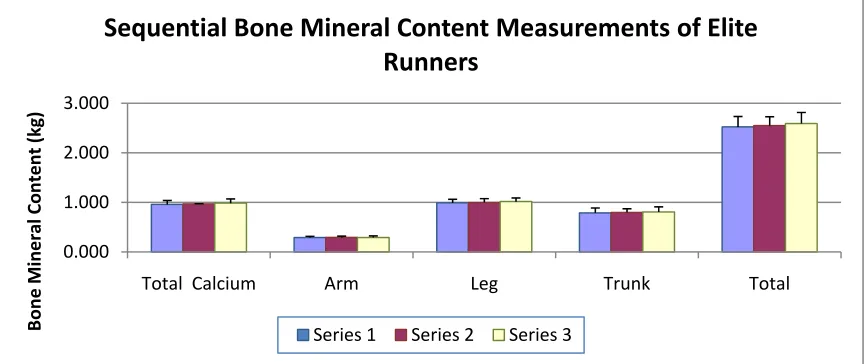
BONE MINERAL DENSITY MEASUREMENTS OF RUNNERS
Measurement of BMC as well as regional and total BMD values was performed for
the group of elite runners evaluated in this study. The maintenance of constant or slightly
increased BMC values is shown in Figure 3 below.
Figure 3 0.0 2.5 5.0 7.5 10.0 12.5 15.0 17.5 20.0 22.5 25.0
Arm Leg Trunk Total
Body
Fat
(%
)
Sequential Regional and Total Body Fat Percent of Elite Runners
Series1 Series2 Series3
0.000 1.000 2.000 3.000
Total Calcium Arm Leg Trunk Total
Bone Mineral Content (kg)
Sequential
Bone
Mineral
Content
Measurements
of
Elite
Runners
[image:45.612.110.544.481.663.2]Total mineral calcium, leg, trunk and total BMC values showed a positive trend across
series 1, 2 and 3, as shown in Figure 3.
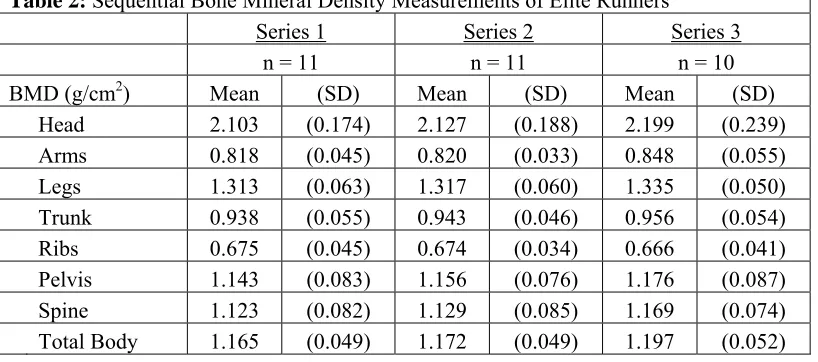
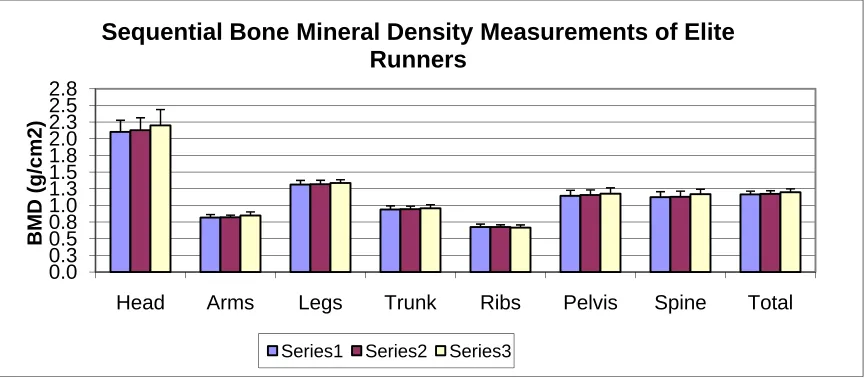
The mean sequential areal BMD values of the elite runners are shown in Table 2. The
regional measurements for head, arms, legs, trunk, ribs, pelvis and spine were assessed,
as well as the value for total body BMD. Both regional and total BMD values increased
over the study period. The average positive trend in regional and total BMD values is
[image:46.612.109.518.302.483.2]shown in Figure 4.
Table 2: Sequential Bone Mineral Density Measurements of Elite Runners
Series 1 Series 2 Series 3
n = 11 n = 11 n = 10
BMD (g/cm2) Mean (SD) Mean (SD) Mean (SD)
Head 2.103 (0.174) 2.127 (0.188) 2.199 (0.239)
Arms 0.818 (0.045) 0.820 (0.033) 0.848 (0.055)
Legs 1.313 (0.063) 1.317 (0.060) 1.335 (0.050)
Trunk 0.938 (0.055) 0.943 (0.046) 0.956 (0.054)
Ribs 0.675 (0.045) 0.674 (0.034) 0.666 (0.041)
Pelvis 1.143 (0.083) 1.156 (0.076) 1.176 (0.087)
Spine 1.123 (0.082) 1.129 (0.085) 1.169 (0.074)
Total Body 1.165 (0.049) 1.172 (0.049) 1.197 (0.052)
The BMD values both within groups, as well as between groups (series 1, 2 and 3)
were analyzed for variance (ANOVA) and showed no statistical significance between
groups. The positive trend in BMD values over time, both regional, as well as total body
BMD, is however biologically relevant, given the mean age of the elite athlete group
Figure 4
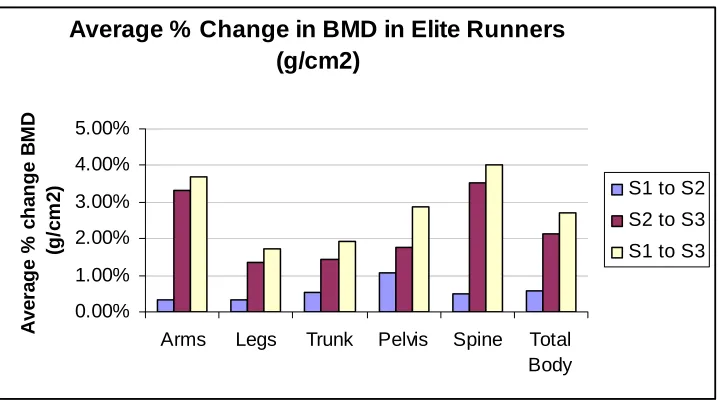
In order to illustrate the change in BMD parameters in the athlete group over the time
course of the study, per cent change in regional and total BMD was calculated and is
shown in Table 3 and Figure 5. Particularly notable were the small increases in trunk,
pelvis and spine BMD values (p>0.05), which have previously been reported as
problematic in runners (77). Although these changes in BMD were not statistically
significant, the positive trend is biologically relevant.
Table 3: Average % Change in BMD in Elite Runners during study (g/cm2)
S1 to S2 S2 to S3 S1 to S3
Arms 0.34% 3.32% 3.68%
Legs 0.33% 1.37% 1.70%
Trunk 0.51% 1.42% 1.94%
Pelvis 1.08% 1.78% 2.88%
Spine 0.49% 3.52% 4.02%
Total Body 0.57% 2.11% 2.70%
0.0 0.3 0.5 0.8 1.0 1.3 1.5 1.8 2.0 2.3 2.5 2.8
Head Arms Legs Trunk Ribs Pelvis Spine Total
BMD (g/
c
m2)
Sequential Bone Mineral Density Measurements of Elite Runners
[image:47.612.107.443.520.682.2]
Figure 5
The percent changes in BMD values shown in Table 3 were computed from original
BMD data corresponding to series 1, 2 and 3. The values described in Table 3 are
averages. Since the study population was small (n=11), these changes represent a
positive trend in BMD values, which is biologically relevant although not statistically
significant.
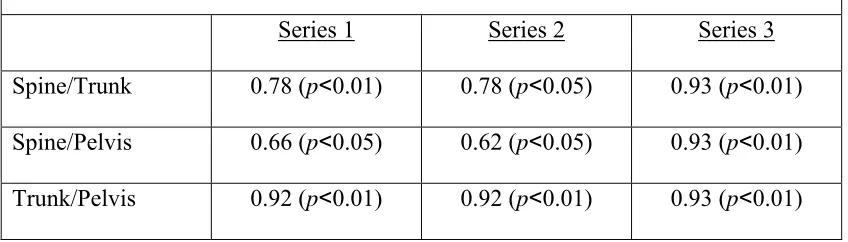
Statistical analyses applied to the BMD data for the runners did, however, show some
notable correlations for BMD values within the groups (series 1, 2 and 3). The BMD
values for the lower body regions, notably spine, trunk and pelvis were significantly
correlated within groups (r=0.66, p˂0.05 to r=0.93, p<0.01), as shown in Table 4. These
regions of the axial skeleton comprise predominantly trabecular bone and positive trends
in BMD values in these anatomical areas are particularly relevant in a group of runners
(77).
Average % Change in BMD in Elite Runners (g/cm2) 0.00% 1.00% 2.00% 3.00% 4.00% 5.00%
Arms Legs Trunk Pelvis Spine Total
Body A v er ag e % ch a n g e B M D (g /c m 2
) S1 to S2
S2 to S3
Table 4: Spearman’s Rho coefficients for Spine, Trunk and Pelvis in Runners
Series 1 Series 2 Series 3
Spine/Trunk 0.78 (p˂0.01) 0.78 (p˂0.05) 0.93 (p˂0.01)
Spine/Pelvis 0.66 (p˂0.05) 0.62 (p˂0.05) 0.93 (p˂0.01)
Trunk/Pelvis 0.92 (p˂0.01) 0.92 (p˂0.01) 0.93 (p˂0.01)
Further analysis of the Spearman’s rho coefficients for the BMD data of the runners
showed a significant correlation between the BMD values for total BMD and leg BMD in
series 1, 2 and 3 measurements (r=0.70, p˂0.05; r=0.83, p˂0.01, and 0.78, p˂0.01
respectively). The correlation coefficient for lean tissue mass or fat mass values and
BMD values was not statistically significant in either series 1, 2 or 3.
BONE MINERAL DENSITY VALUES AND BMI IN RUNNERS
Analysis of the baseline BMD data (series 1) associated with the runners was carried
out based on the assumption of a healthy body weight corresponding to a BMI greater
than 19.0 kg/m2 (78). When subjected to this division, a majority of runners (n=7) had a
BMI value greater than 19.0 kg/m2, while the remainder of the group (n=4) had BMI
values below 19.0 kg/m2. Computation of an independent samples t-test for the equality
of means between the two groups, 19.0˂BMI>19.0 kg/m2 showed significant differences
in the BMD values at the trunk, pelvis and spine measurement sites of the runners
(p˂0.05). These regions of the axial skeleton have previously been described as subject