Georgia State University Georgia State University
ScholarWorks @ Georgia State University
ScholarWorks @ Georgia State University
Public Health Theses School of Public Health
Summer 8-7-2012
Assessing the Impact of the Department of Health (DHS) Division
Assessing the Impact of the Department of Health (DHS) Division
of Aging Services’ At-risk Adult Crime Tactics (ACT) Certification
of Aging Services’ At-risk Adult Crime Tactics (ACT) Certification
on Professionals
on Professionals
Tanya L. Parker Georgia State University
Follow this and additional works at: https://scholarworks.gsu.edu/iph_theses
Recommended Citation Recommended Citation
Parker, Tanya L., "Assessing the Impact of the Department of Health (DHS) Division of Aging Services’ At-risk Adult Crime Tactics (ACT) Certification on Professionals." Thesis, Georgia State University, 2012. https://scholarworks.gsu.edu/iph_theses/224
ASSESSING THE IMPACT OF THE DEPARTMENT OF HEALTH (DHS) DIVISION OF AGING SERVICES’ AT-RISK ADULT CRIME TACTICS (ACT) CERTIFICATON ON
PROFESSIONALS
By
TANYA L. PARKER
B.A., BAYLOR UNIVERSITY
M.Ed., GEORGIA STATE UNIVERSITY
A Thesis Submitted to the Graduate Faculty of Georgia State University in Partial Fulfillment of the Requirements for the Degree
MASTER OF PUBLIC HEALTH
ii
ASSESSING THE IMPACT OF THE DEPARTMENT OF HEALTH (DHS) DIVISION OF AGING SERVICES’ AT-RISK ADULT CRIME TACTICS (ACT) CERTIFICATON ON
PROFESSIONALS
By
TANYA L. PARKER
Approved:
Committee Chair
Committee Member
Committee Member
iii
Acknowledgements
To:
My family, whose support is omnipresent,
More specifically,
My husband, Richmond Parker, the love of my life,
My mother, my rock, Alma Bolden, who gave me the gifts of curiosity and empathy,
My sister, Dr. Tammy White, my best friend all my life,
My babies, Aiden and Emily Alma, my sunshine and laughter,
And
Dr. Sheryl Strasser, PhD, for her guidance and calming, reassuring presence,
And
Megan Smith, MPH, for her generous willingness to serve on my committee,
And
iv
Author’s Statement
In presenting this thesis as a partial fulfillment of the requirements for an advanced degree from Georgia State University, I agree that the Library of the University shall make it available for inspection and circulation in accordance with its regulations governing materials of this type. I agree that permission to quote from, to copy from, or to publish this thesis may be granted by the author or, in her absence, by the professor under whose direction it was written, or in his
absence, by the Associate Dean, College of Health and Human Sciences. Such quoting, copying, or publishing must be solely for scholarly purposes and will not involve any potential financial gain. It is understood that any copying from or publication of this dissertation which involves potential financial gain will not be allowed without written permission of the author.
v
Notice to Borrowers: All these deposited in the Georgia State University Library must be used in accordance with the stipulations described by the author in the preceding statement.
The author of this thesis is:
Tanya L. Parker
2721 Idlewood Drive
Marietta, GA 30062
The Chair of the committee for this thesis is: Sheryl Strasser, PhD
Users of this thesis who not regularly enrolled as student as Georgia State University are
required to attest acceptance of the preceding stipulation by signing below. Libraries borrowing this thesis for the use of their patrons are required to see that each user records here the
information requested.
NAME OF USER
ADDRESS DATE TYPE OF USE
vi
Curriculum Vitae
EDUCATION ______
Georgia State University, Atlanta, GA
Candidate for Master of Public Health, August 2012 Current GPA: 3.9 / 4.0
Georgia State University, Atlanta, GA Master of Education, 2002
GPA: 4.0 / 4.0
Baylor University, Waco, TX
Bachelor of Arts in Environmental Science & Political Science, 1996 GPA: 3.6 / 4.0
PROFESSIONAL EXPERIENCE ______
Teacher of the Deaf, Cobb County School District, Marietta, GA 2002 – Present
Teacher of the Deaf, Atlanta Area School for the Deaf, Atlanta, GA 2001 – 2002
Graduate Assistant, Dr. Susan Easterbrooks, Georgia State University, Atlanta, GA 2000 – 2001
Special Education Teacher, Cobb County School District, Marietta, GA 1998 – 2000
Special Education Teacher, Fayetteville Independent School District, Fayetteville, TX 1997 - 1998
RESEARCH AND WRITING _____________
Currently interning and conducting research in the area of multicultural competencies and health disparities for The Department of Multicultural Affairs at Grady Memorial Hospital
Chapter co-author, “Communication Development:” Hooper, S.R., & Umansky, W. (Eds.). (2009). Young Children with Special Needs (5th ed.). Columbus, Ohio: Pearson
Served as the statistical consultant for Dr. Tammy J. White’s 2010 doctoral dissertation using SPSS to apply statistical techniques
Conducted phone interviews to assist Dr. Sheryl Strasser, Assistant Professor at Georgia State University, with research on elder abuse
Analyzed research articles for use in literature reviews for Dr. Susan Easterbrooks, Professor at Georgia State University
Helped to conduct a study of 42 sub-watersheds in the Bosque River Watershed Basin
Helped to conduct a study of the Sibun Watershed Basin in Belize, Central America
vii
Table of Contents
ACKNOWLEDGEMENTS ... iii
LIST OF TABLES ... ix
LIST OF FIGURES ...x
INTRODUCTION ...1
Background ...1
Purpose of Study ...2
Research Questions ...3
REVIEW OF THE LITERATURE ...5
Violence ...5
Violence as a Public Health Issue ...5
Types of Violence ...5
Elder Maltreatment ...8
Overview ...8
Types of Elder Maltreatment ...9
Scope of the Problem ...11
Risk Factors ...12
Violence Prevention Theory ...13
At‐Risk Adult Crime Tactics (ACT) Certification Training ...15
METHODOLOGY ...17
Survey ...17
Overview ...17
viii
Analysis ...19
Research Question 1 ...19
Research Question 2 ...20
Research Question 3 ...20
Research Question 4 ...20
Research Question 5 ...20
Research Question 6 ...21
RESULTS ...22
Restatement of Purpose...22
Study Demographics ...22
Pre and Post ACT Training Level of Knowledge ...24
Pre and Post ACT Training Frequency of Contact ...27
Extent of Change in Handling Cases against At-Risk Adults ...30
Extent of Change and Demographics Correlations ...31
Helpfulness of Workshops ...32
ACT Topic Level of Helpfulness and Service Area Correlations ...34
DISCUSSION ...36
Summary of the Study ...36
Study Limitations ...40
Recommendations ...41
Conclusion ...42
ix
List of Tables
Table
1. Mean Scores on Average Level of Knowledge ...26
2. Paired Average Level of Knowledge Difference of Means ...26
3. Mean Scores on Frequency of Contact ...29
4. Paired FOC Differences of Means ...29
5. Mean Extent of Change ...30
6. One-Sample t-Test on Extent of Change ...30
7. Correlation Between Extent of Change and Demographic Indicators ...31
8. Means for ACT Training Topics’ Levels of Helpfulness ...33
9. One-Sample t-Test on Levels of Helpfulness ...34
x
List of Figures
Figure
1. Gender Demographic ...23
2. Ages By Gender Demographic ...23
3. Race Demographic ...23
1
CHAPTER I
Introduction
Background
Since 1965, violence has been a growing concern for public health professionals in the
United States. Though violence is widespread and ever-present, it does appear to affect certain
subpopulations disproportionately. Rates of violence inflicted on populaces seem to be directly
related to that group’s perceived vulnerability (e.g. age [children and elderly], disability, gender,
etc.). Furthermore, combinations of these susceptibilities, or risk factors, compound the
possibility of exposure to violence (e.g. children who are disabled) (Alriksson-Schmidt, Armour
& Thibadeau, 2010).
Elderly Americans, over age 60, represent one such at-risk subgroup. These individuals
suffer elder mistreatment (EM) in the forms of physical abuse, sexual abuse, emotional or
psychological abuse, financial or material exploitation, abandonment, and/ or neglect (Tatara et
al., 1998). Several risk factors discussed in the literature that appear to increase the likelihood of
suffering the above mentioned forms of EM include age and income level (Tatara et al., 1998),
gender (Amstadter & Cisler et al., 2011; Tatara, 1998), race/ethnicity (Amstadter & Zajac et al.,
2011; Beach, Schulz, Castle, & Rosen, 2010), and impairment type and health (Amstadter &
2
studies have established that roughly one in ten Americans report having been a victim of at least
one form of EM (Laumann, Leitsch & Waite, 2008; Acierno, et al., 2010; Amstadter & Cisler et
al., 2011). It is important to note, however, that several researchers consider these reported cases
to be only the tip of the iceberg (Rovi, Chen, Vega, Johnson, & Mouton, 2009), or in other
words, the vast majority of elder mistreatment cases go unidentified and unreported.
These EM statistics are staggering in current numbers, much less when one considers the
projected growth for this segment of the American population. The older sector of the American
population has been steadily increasing over the past century, but, with the aging of the
baby-boom generation (those individuals born in the years 1946 through 1964), America’s elderly
population, using 2010 as a baseline, is expected to double by 2030 (National Center for Health
Statistics, 2010); therefore, by 2030, Americans older than 65 will represent 20 percent of the
total U.S. population. Furthermore, after 2030, those 85 and older (a group exceptionally
vulnerable to EM) will grow swiftly.
Purpose of Study
The purpose of this study was to assess the impact of the At-Risk Adult Crime Tactics
(ACT) specialist training on the professionals who participated in the training. The Public Health
Approach to Violence Prevention Theory identifies four necessary, sequential steps for
addressing public health problems such as elder mistreatment: (1) monitor the problem; (2)
identify risk and protective factors; (3) develop and test prevention strategies; and (4) assure
widespread adoption (Centers for Disease Control and Prevention (CDC), 2008). The At-Risk
Adult Crime Tactics (ACT) specialist training was an attempt to develop an EM prevention
3
Research Questions
1) Did knowledge level regarding at-risk adult abuse increase in respondents after ACT training?
Null Hypothesis: Knowledge level regarding at-risk adult abuse did not increase in respondents
after ACT training.
Alternate Hypothesis: Knowledge level regarding at-risk adult abuse did increase in respondents
after ACT training.
2) Did respondents increase their interagency collaboration after ACT training?
Null Hypothesis: Respondents did not increase their interagency collaboration after ACT
training.
Alternate Hypothesis: Respondents did increase their interagency collaboration after ACT
training.
3) According to the respondents, did the ACT training change the way they handled cases against
at-risk adults?
Null Hypothesis: The ACT training did not change the way that respondents handled cases
against at-risk adults.
Alternate Hypothesis: The ACT training did change the way that respondents handled cases
against at-risk adults.
4) If the ACT training did change the way that respondents handled cases, were any of the
demographic characteristics of respondents correlated with the change?
Null Hypothesis: None of the demographic characteristics of respondents were correlated with
the change in the way that respondents handled cases against at-risk adults.
Alternate Hypothesis: All, some, or one of the demographic characteristics of respondents were
4
5)Were the workshop topics helpful to respondents?
Null Hypothesis: None of the workshop topics were helpful to respondents.
Alternative Hypothesis: All, some or one of the workshop topics were helpful to respondents.
6) If a particular workshop topic was helpful to respondents, was the service area of respondents
correlated with the level of helpfulness of the topic?
Null Hypothesis: The service area of respondents was not correlated with the level of
helpfulness for any workshop topic.
Alternative Hypothesis: The service area of respondents was correlated with the level of
5
CHAPTER II
Review of the Literature
Violence
Violence as a Public Health Issue
Violence in the United States has not always been considered a public health problem. In
fact, until relatively recently, the attention of the public health infrastructure had been focused
mainly on the control and prevention of infectious diseases such as tuberculosis and pneumonia.
With the advent of widely-distributed antibiotics in the 1940s, immunization campaigns, and
widespread implementation of public health sanitary measures (e.g. clean drinking water and
sewage control), mortality rates from infectious diseases decreased dramatically. Consequently,
since 1965, death from violence has consistently been one of the top leading causes of mortality
in the United States (Dahlberg & Mercy, 2009). Dahlberg and Mercy (2009) go on to conclude
that the rise of homicide during the 1980s and 1990s to epidemic levels (e.g. a homicide rate
increase of 154% for 15 to 19 year old males between the years of 1985 and 1991) and the
growing recognition of behavior modification as a deterrent to public health problems also
helped lead the way to the modern American perception of violence as a public health concern.
Types of Violence
6
were victims of homicide (The CDC, 2012b). These losses are staggering, but when added to the
other ramifications of violence (e.g. physical and emotional impairment of survivors and erosion
of communities), the picture of violence as a public health epidemic becomes much clearer.
Though any person, regardless of gender, race, age, religion, or income level is susceptible to
violence, there are certain subgroups of the population that appear to be more vulnerable. This
paper will address several specific types of violence and some of the subgroups that are most
affected by it.
Intimate Partner Violence (IPV). Intimate Partner Violence is “a term…[that]
describes physical, sexual, or psychological harm by a current or former partner or spouse. This
type of violence can occur among heterosexual or same-sex couples and does not require sexual
intimacy.” (CDC, Intimate Partner Violence, 2012). Furthermore, Saltzman, Fanslow, McMahon
& Shelley (2002) identified four prevalent types of IPV:
Physical violence
Sexual violence
Threats of physical or sexual violence
Psychological / emotional violence
Women, however, seem to suffer from IPV disproportionately from men. While one in
ten men in the United States has experienced IPV, three in ten women have experienced it
(Understanding Intimate Partner Violence: Fact Sheet, 2012). Furthermore, in 2007, IPV
accounted for 2,340 deaths—70% of which were woman. Delving further, vulnerable female
subgroups suffer IPV even more unduly. Chang, Berg, Saltzman and Herndon (2005) concluded
that from 1991 to 1999, homicide was the second leading cause of pregnancy-associated injury
7
20 being at the highest risk for pregnancy-associated homicide. Moreover, the study’s authors
found that pregnancy-related homicide rates were significantly higher (2 to 5 times) amongst
women who did not receive prenatal care compared with women who did receive such care
(Chang et al., 2005). This may suggest that low socio-economic status further contributes to the
vulnerability of a pregnant woman, thus increasing her risk for IPV. Research demonstrating the
effect of SES on women shows that women receiving federal aid were two to three times more
likely to be victims of IPV in the past year when compared to the general population (Lown,
Schmidt & Wiley, 2006).
Sexual Violence. Basile and Saltzman (2002) define sexual violence as a sexual act that
is nonconsensual or perpetrated against at least one participant’s will. They define the four types
of sexual violence as:
a completed sex act
an attempted (but not completed) sex act
abusive sexual contact
non-contact sexual abuse
As with IPV, women as well as other vulnerable subgroups are more commonly victims of
sexual violence. In one national survey, 10.6% of women compared with 2.1% of men admitted
to experiencing rape in their lifetimes, and 2.5% of women had experienced some type of
unwanted sexual activity in the previous year as compared with .9% of men (U.S. Department of
Health and Human Services [DHHS], 2008). Moreover, a victim’s age adds to sexual violence
susceptibility, as children are much more likely to be victimized by sexual perpetrators. The
majority sexual violence victims (60.4% of females and 69.2% of males) were victimized before
8
Adding to this, children with disabilities are at even higher risk for sexual violence.
Alriksson-Schmidt et al. (2010) found that adolescent girls with a disability were twice as likely to have
reported being raped as their non-disabled counterparts (19.6% and 9.4%, respectively).
Child Maltreatment. As mentioned previously, children are extremely vulnerable to
violence. Leeb, Paulozzi, Melanson, Simon and Arias (2008) defined child maltreatment as “any
act or series of acts of commission [physical abuse, sexual abuse, or psychological abuse] or
omission [failure to provide (physical neglect, emotional neglect, medical/dental neglect, or
educational neglect) or failure to supervise (inadequate supervision or exposure to violent
environments)] by a parent or other caregiver that result in harm, potential for harm, or threat of
harm to a child” (p. 11). Child Maltreatment 2008 (2010) reported that nation-wide,
approximately 3.3 million referrals were received by Child Protective Services (CPS). Of these,
around 772,000 were determined to be victims of child abuse or neglect. Additionally, roughly
1,740 children died from child maltreatment. Remarkably, the younger, and thus, more
vulnerable the child, the more susceptible they were to death from maltreatment (e.g. 80% of the
2008 deaths from child maltreatment were children younger than four).
Elder Maltreatment
Overview
Adults over 60 years of age in the United States are increasing in total percentage of the
population and will continue to do so as each wave of the post-war, baby-boom generation enters
older adulthood. These individuals are not only reaching older age in record numbers, but they
are also living well past 60 in greater numbers than ever before. Though this increased life span
is a glowing accomplishment for public health, unfortunately, it also opens the door for this
9
elder mistreatment (EM) has undoubtedly been a public health problem for years, only recently
has it been recognized as such. In fact, providing palpable proof as to the fresh appearance of
elder mistreatment into the public health consciousness, the CDC has a disclaimer on its website
regarding its definition of elder maltreatment: “The definitions presented on this page are
preliminary and for descriptive purposes only. CDC and our partners are working to develop a
document containing standardized definitions and recommended data elements for use in elder
maltreatment surveillance.” (CDC, 2010) The CDC then proceeds to define elder maltreatment
as abuse of any individual over 60 years of age by any perpetrator in which the victim had an
expectation of trust.
Types of Elder Maltreatment
In 1998, The National Elder Abuse Incidence Study delineated seven types of elder
maltreatment:
Physical Abuse
The National Elder Abuse Incidence Study defined physical abuse as “the use of physical
force that may result in bodily injury, physical pain, or impairment. Physical
punishments of any kind [are] examples of physical abuse” (Tatara et al., 1998, p. 11).
Examples include burning, hitting, slapping, scratching, and biting. The National Elder
Mistreatment Study established that past-year prevalence of physical abuse was 1.6% in
older adults (Acierno et al., 2010).
Sexual Abuse
The National Elder Abuse Incidence Study defined sexual abuse as “non-consensual
10
National Elder Mistreatment Study found that of those elders sampled, .6% had suffered
sexual maltreatment in the past year (Amstadter & Cisler et al., 2011).
Emotional or Psychological Abuse
The National Elder Abuse Incidence Study defined this type of abuse “as the infliction of
anguish, pain, or distress” (Tatara et al., 1998, p. 11). The National Elder Mistreatment
Study found that 4.6% of elder adults had been the victims of emotional abuse within the
past 12 months (Acierno et al., 2010). Beach et al. (2010) found a much higher rate of
psychological mistreatment in a random telephone sample of 903 adults over the age of
60, illuminating a staggering prevalence rate (since turning 60) of 14.3%.
Financial or Material Exploitation
The National Elder Abuse Incidence Study defined this abuse “as the refusal or failure to
fulfill any part of a person’s obligations or duties to an elder” (Tatara et al., 1998, p. 12).
The National Elder Mistreatment Study revealed a financial victimization rate of 5.2% in
older adults by family members alone (Acierno et al., 2010). Beach et al. (2010) found
even higher rates of financial exploitation, revealing a prevalence rate (since turning 60)
of 9.7%.
Abandonment
The National Elder Abuse Incidence Study defined abandonment “as the desertion of an
elderly person by an individual who had physical custody or otherwise had assumed
responsibility for providing care for an elder or by a person with physical custody of an
elder” (Tatara et al., 1998, p.12).
11
The National Elder Abuse Incidence Study defined neglect “as the refusal or failure to
fulfill any part of a person’s obligations or duties to an elder” (Tatara et al., 1998 p. 12).
In 1997, the Texas Department of Protective and Regulatory Services—Adult Protective
Services Division (TDPRS-APS) received over 62,000 reports of elder mistreatment. Of
these cases, 80% involved neglect of an elder (Pavlik, Hyman, Festa & Bitondo, 2001).
Self-Neglect
The National Elder Abuse Incidence Study defined self-neglect “as the behaviors of an
elderly person that threaten his/her own health or safety” (Tatara et al., 1998, p. 12).
Scope of the Problem
One of the first studies to demonstrate the scale of elder mistreatment in the United
States, The National Elder Abuse Incidence Study found that in 1996, a total of 551,011 elderly
Americans were victims of EM in domestic settings (Tatara et al., 1998). In another national
study attesting to the breadth of EM, researchers conducted interviews on a random sample of
elderly adults to determine prevalence estimates of EM. The authors found that of the 5,777
older adults, 11.4% had experienced at least one form of elder maltreatment during the past year
alone (Acierno, et al., 2010). Consistent with these findings, Amstadter and Zajac et al. (2011)
conducted a telephone interview study of 902 adults over 60 years of age residing in South
Carolina and found that approximately 1 in 10 of these adults reported mistreatment within the
past 12 months. Expounding further, Laumann, Leitsch and Waite (2008) found that 12.7% of
their 3,005 participant study (ranging in age from 57 to 85) had experienced physical, verbal, or
12 Risk Factors
Risk factors regarding elder maltreatment in the literature seem to focus on the
perpetrator rather than the victim; however there is some evidence in the research pointing to
possible risk factors for victims of elder abuse.
Age. In The National Elder Abuse Incidence Study (1998), age played a major role in
determining rates of elder maltreatment. Regarding neglect, only 2.3% of victims were between
the ages of 60 and 64; whereas, more than half of the victims of neglect were 80 or older. The
same holds true for physical abuse, emotional abuse, and financial exploitation, where the largest
groups in all categories were 80 or older (43.7%, 41.3% and 48% respectively) (Tatara et al.,
1998).
Income Level. Income level of the elder victim also took a large part in rates of elder
maltreatment (Tatara et al., 1998). The largest portion of each maltreatment type (neglect,
emotional/psychological abuse, physical abuse, financial exploitation and abandonment) earned
incomes between $5,000 and $9,999 per year (66.8%, 37.8%, 49.5%, 46% and 96.1%
respectively). There was no clear distinction in the higher income groups as the top bracket
encompassed all income over $15,000 per year.
Gender. The National Elder Abuse Incidence Study (1998) showed a clear dissimilarity
in rates of neglect and emotional/psychological abuse between women and men (60% vs. 40%
and 76.3% vs. 23.7% respectively) (Tatara et al., 1998). Additionally, the National Elder
Mistreatment Study found that women suffer greater rates of sexual abuse than men (Amstadter
& Cisler et al., 2011).
Race/Ethnicity. Though there has been limited research regarding the role race plays in
13
contributing meaningfully to EM. Beach et al. (2010) found that prevalence rates of financial
exploitation and psychological mistreatment were significantly higher for African Americans
when compared to non-African American equivalents (23% vs. 8.4% and 24.4% vs. 13.2%
respectively). In the South Carolina study by Amstadter and Zajac et al. (2011), minority
participants had a significantly higher risk of suffering from elder maltreatment in the form of
neglect than white interviewees.
Impairment Type and Health. The inability to care for one’s self was a strong
predictor of elder maltreatment (Tatara et al., 1998). Of all abuse cases reported in the study,
47.9% of the victims were unable to care for themselves and 28.7% were only somewhat able to
care for themselves. Furthermore, Heath et al. (2005), in a retrospective cohort study of 211
Adult Protective Service (APS) clients, found that dementia was not only the most prevalent
diagnosis but was also positively correlated with neglect and financial exploitation. In this same
study, researchers also found that the urinary incontinence was strongly linked with neglect by a
caregiver. In the South Carolina study mentioned previously, poor health status amongst older
adults was correlated with several types of elder maltreatment (Amstadter & Zajac et al., 2011).
Violence Prevention Theory
Violence, in the form of elder maltreatment is a public health problem, and as such, it
should be handled accordingly. The Public Health Approach to Violence Prevention Theory is a
scientific, four-step progression that is employed to address widespread health problems that
affect specific populations, such as elder maltreatment (CDC, 2008). The steps are detailed
below.
The first step is to define and monitor the problem. Before prevention of a public health
14
recently been defined, and a concrete, static definition of what constitutes this maltreatment is
still forthcoming (e.g. the above-mentioned, CDC disclaimer regarding the definition of elder
maltreatment). Many researchers, however, developed reliable definitions for common types of
elder maltreatment. Through their various studies (surveys, police reports, Adult Services
reports, examination of vital records, etc.), they endeavored to define the scope of this type of
violence by “analyzing data such as the number of violence-related behaviors, injuries, and
deaths [to] demonstrate how frequently violence occurs, where it is occurs, trends, and who the
victims and perpetrators are” (CDC, 2008). Examples of such studies in the literature are well
represented above under the sections: types of elder mistreatment and scope of the problem.
The second step is to identify risk and protective factors. Before steps can be taken to
prevent a public health problem, a clear picture should be drawn to pinpoint where prevention
efforts should be concentrated. The most effective way to make this determination is by studying
the factors that provide protection or create risk for the victims. Examples of such studies in the
literature are well represented above under the section: risk factors.
The third step is to develop and test prevention strategies. In order to design a successful,
evidence-based, prevention program, data must be collected from various community sources
(e.g. focus groups or community surveys). After development, of course, the prevention program
must be evaluated thoroughly for efficacy. There are several references in the literature regarding
prevention programs in the form of screenings for elder abuse in locations frequented by older
adults. Fulmer et al., (2012) screened older adults for elder mistreatment in dental and medical
clinics. They found that the adults were willing to donate their time and answer very personal
questions regarding EM in their lives. Another article assessed most of the current EM screening
15
Connolly, 2004). The authors found no form of consensus on what constitutes an appropriate
screening or assessment instrument, creating a lack of efficacy in this strategy for identifying and
preventing Elder Maltreatment.
The fourth step is to assure widespread adoption. Once a prevention strategy
demonstrates well-researched and documented success, it is ready for widespread distribution
and adoption. Effective means of distribution include training, networking, technical assistance,
and evaluation.
At‐Risk Adult Crime Tactics (ACT) Certification Training
The inability of healthcare providers and other front line professionals to recognize and
report elder maltreatment is recognized in the literature. Rovi et al. (2009) stated that training of
healthcare professionals to better recognize EM is needed to improve our nation’s response to the
problem. Furthermore, the authors reiterated a well-known analogy comparing reported EM
cases to the tip of an iceberg. Adding to this, Halphen, Varas and Sadowsky (2009)
acknowledged that most cases of elder abuse are not identified or reported by clinicians mainly
due to their lack of education and comfort on the topic.
The At-Risk Adult Crime Tactics (ACT) Certification Training is an at-risk, adult
(elderly or disabled adults) prevention program designed to increase professional awareness of
this population and equip primary and secondary responders (all mandated reporters) with the
knowledge and skills to address the needs of Georgia’s at-risk adult crime victims. Through the
ACT certification series, workers in public safety, criminal justice, social services, healthcare
and related fields will learn to more easily recognize and report signs of abuse against at-risk
adults, understand roles and responsibilities of involved agencies, collaborate effectively with
16
professionals and potential victims, increase the number of prosecutions of offenders, and
strengthen prevention techniques. Once certified, these professionals will form a new statewide
ACT Specialist team to promote community awareness, share crime trends to alert communities,
and stay informed of additional training.
This ACT Certification Training is being rolled out by the DHS Division of Aging
Services in collaboration with the Administrative Office of the Courts of Georgia, the Georgia
Association of Chiefs of Police, the Georgia Bureau of Investigation, the Georgia Peace Officer
Standards and Training Council, the Georgia Public Safety Training Center, the Georgia
Sheriff’s Association, and the Prosecuting Attorneys Council of Georgia. It is hoped that this
partnership will facilitate interagency communication and cooperation more efficiently and
17
CHAPTER III
Methodology
Survey
Overview
The purpose of this research was to assess the impact of the DHS Division of Aging
Services’ At-Risk Adult Crime Tactics (ACT) Certification Training on the professionals who
participated in the training. An invitation was emailed to 482 individuals who had previously
completed the ACT Certification Training, inviting them to complete an (approximately) 20
minute, 41-question, online survey. The request was resent two times for a total of three
invitations. The survey’s introduction, which had a Flesch-Kincaid reading level of 10.7,
explained that participation was both anonymous and voluntary. The reading level for the
remainder of the survey was 8.7. Documented consent for the survey was not necessary as
passive consent was given when the participant clicked that they wished to proceed with the
survey. None of the survey questions contained identifiable information, and only the primary
investigator had access to the editable survey forms. Furthermore, data from this survey were
stored on Georgia State University’s firewall protected, multi-tiered, password-accessible
18
The survey sought to collect data regarding the effectiveness of ACT training in relation
to increased knowledge, increased interagency collaboration, change in case management of
at-risk adults, and usefulness of workshop topics. The survey also collected information on seven
demographic indicators.
Measures
The survey consisted of 41 questions; the first of which asked if the participant was
willing to volunteer for research purposes. The following sections detail the remaining survey
questions.
Level of Knowledge. The first section sought to determine the participant’s change in
average level of knowledge on nine topics related to at-risk adult abuse. For each topic, the
participant was asked to select both a pre and post ACT training average level of knowledge. The
knowledge level was assessed on a four-level, Likert scale (1 = almost no knowledge, 2 = a little
knowledge, 3 = some knowledge, 4 = a lot of knowledge).
Frequency of Contact. The next section (questions 11 through 20) focused on defining
the participant’s change in interagency collaboration behavior. For each of ten agencies, the
participant was asked to select both a pre and post ACT training frequency of contact level. The
frequency of contact was assessed on a four-level, Likert scale (1 = never, 2 = seldom, 3 =
weekly, 4 = daily).
Change in Handling Cases. The next two questions (21 and 22) dealt with possible
changes in the manner in which the participant had handled cases dealing with at-risk adults
since completing the ACT training. Question 21 was assessed on a four-level, Likert scale (1 =
19
way I work a lot, 4 = has completely changed the way I work). Question 22 was an open-ended
question asking for a description of this change.
Workshop Topic Helpfulness. The next portion of the survey (questions 23 through 33)
collected data regarding the helpfulness of eleven, ACT training, workshop topics in the
participant’s professional life. The topics were assessed on a four-level, Likert scale (1 = not
helpful, 2 = a little helpful, 3 = very helpful, 4 = extremely helpful). Question 34 was the second
open-ended one of this survey. It asked the participant to discuss any past cases to which the
information learned in the ACT training could have been applied.
Demographics. The last section of the survey collected demographic information on the
participants. Gender, race, age, and educational level were collected. Also included in this
section were the participant’s service area (urban, suburban or rural), employment agency, and
how many years they had been working with their current agency.
Analysis
The Predictive Analytics Software Statistics 18 (PASW Statistics 18) was used for
analyzing the survey data.
Research Question 1
In order to answer the first research question (Did knowledge level regarding at-risk adult
abuse increase in respondents after ACT training?), a dependent samples t-test was run on the pre
and post, level of knowledge means for each of the nine categories to determine if the scores
were significantly different. If the p-values for one or more of the paired samples are less than
20 Research Question 2
In order to answer the second research question (Did respondents increase their
interagency collaboration after ACT training?), a dependent samples t-test was run on the pre
and post, frequency of contact means of each of the ten agencies to determine if the scores were
significantly different. If the p-values for one or more of the paired samples are less than .05, the
null hypothesis is rejected for those paired samples.
Research Question 3
In order to answer the third research question (According to the respondents, did the ACT
training change the way they handled cases against at-risk adults?), a one-sample t-test was run
on the respondents’ reported extent of change in the way they handled cases against at-risk adults
after ACT training. If the p-value is less than .05, the null hypothesis is rejected.
Research Question 4
In order to answer the fourth research question (If the ACT training did change the way
that respondents handled cases, were any of the demographic characteristics of respondents
correlated with the change?), a correlation was conducted on the relationship between
respondents’ reported extent of change and the seven demographic indicators. If the p-value is
less than .05 for any of these correlations, the null hypothesis is rejected for that correlation.
Research Question 5
In order to answer the fifth research question (Were the workshop topics helpful to
respondents?),a one-sample t-test was run on the respondents’ reported levels of helpfulness for
each of the eleven, ACT training workshop topics. If the p-value is less than .05 for any topic,
21 Research Question 6
In order to answer the sixth research question (If the workshop topics were helpful to
respondents, was the service area of respondents correlated with the level of helpfulness of the
topic?), a correlation was conducted on the relationship between the respondents’ reported levels
of helpfulness on each ACT training workshop topic and the demographic indicator, service area.
If the p-value is less than .05 for this indicator and any of the workshop topics, the null
hypothesis is rejected for that correlation.
22
CHAPTER IV
Results
This chapter details the results of the statistical analyses conducted to answer the research
questions.
Restatement of Purpose
The purpose of this study was to assess the impact of the DHS Division of Aging
Services’ At-Risk Adult Crime Tactics (ACT) Certification Training on the professionals who
participated in the training.
Study Demographics
The survey was sent to 482 ACT certified professionals. Of these 482 invitations, there
were 223 survey responses. Of these 223, however, due to blank survey results on 47 survey
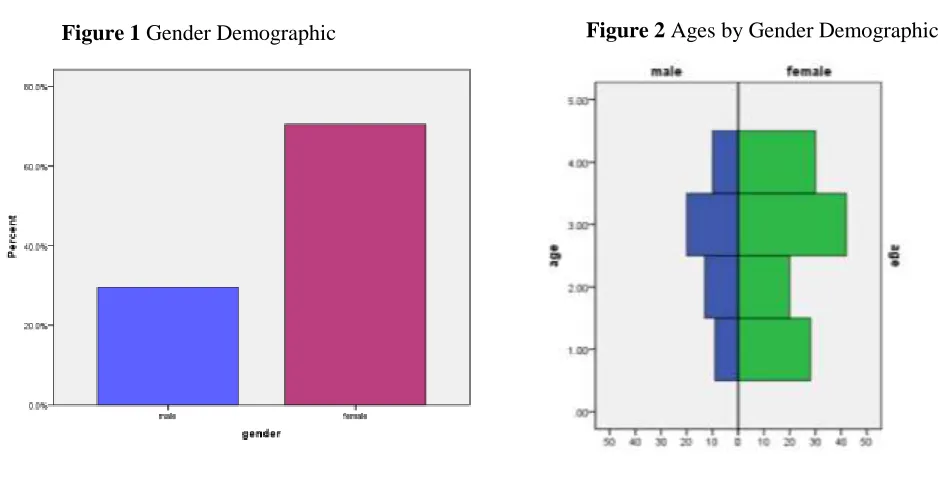
submissions, 176 surveys were used for the purposes of this research. As shown in Figure 1, the
gender demographic of survey respondents consisted heavily of women, with 52 males and 124
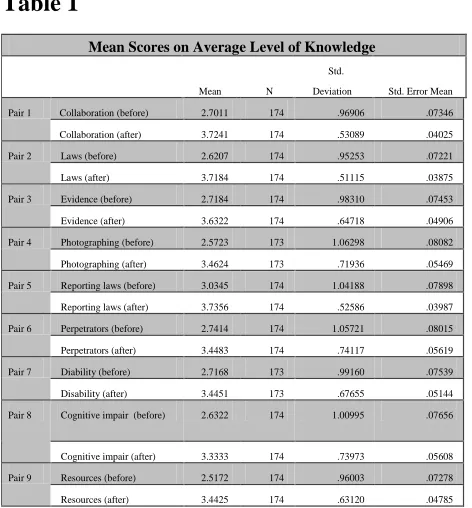
females (29.5% and 70.5%, respectively). Furthermore, Figure 2 shows the age percentage
breakdown of respondents by gender. Totals for age were 37 under 22 years of age, 33 between
the ages of 23 and 29, 62 between the ages of 30 and 39, and 40 over 40 years of age (21.5%,
23
Race percentages were determined to be 24.7% African American, 71.8% Caucasian, .6% Asian,
and 2.9% other (Figure 3 below). The percentages regarding identified service areas of the
respondents were fairly well distributed with 38.4% serving urban areas, 33.7% serving suburban
[image:34.612.58.527.65.307.2]areas, and 27.9% servicing rural areas (Figure 4 below).
[image:34.612.72.312.455.676.2]Figure 2 Ages by Gender Demographic Figure 1 Gender Demographic
[image:34.612.321.583.457.675.2]24
The respondents were a well-educated group with 76.2%, of those that included education level,
indicating that they had at least a four-year college degree (7.4% high school graduation or
equivalent, 9.1% some college, 5.1% 2-year college degree, 41.5% 4-year college degree, 34.7%
graduate or professional degree, and 2.3% no response). Regarding professions of respondents,
over 51% were working in law enforcement or with Adult Protective Services (28.3% law
enforcement, 23.1% APS, 8.1% HFR, 6.9% LTCO, 5.2% prosecution, .6% criminal justice, 6.4%
DBHDD, 1.2% EMS/fire, 4% AAA/ADRC, and 16.2% other). Lastly, there was a fairly even
split between those respondents who had been in their current positions long term (47.4% with
more than 10 years) and short term (52.6% with 10 or less years).
Pre and Post ACT Training Level of Knowledge
This study’s alternative hypothesis regarding research question one stated that knowledge
level regarding at-risk adult abuse did increase in respondents after ACT training. A dependent
t-test was conducted on the respondents’ self-identified level of knowledge on nine ACT training
categories before they received ACT training and their self-identified level of knowledge on the
same nine ACT training categories after they received ACT training to determine whether
difference of means of the two scores for each ACT training category were significantly
different, with alpha set at .05. There was a significant difference on the before ACT training,
collaboration category level of knowledge scores (M = 2.70, SD = 0.97) and the after ACT
training, collaboration category level of knowledge scores (M = 3.72, SD = 0.53), t (173) =
-13.307, p < .001. There was a significant difference on the before ACT training, GA laws
category level of knowledge scores (M = 2.62, SD = 0.95) and the after ACT training, GA laws
category level of knowledge scores (M = 3.72, SD = 0.51), t (173) = -15.481, p < .001. There
25
scores (M = 2.72, SD = 0.98) and the after ACT training, evidence category level of knowledge
scores (M = 3.63, SD = 0.65), t (173) = -12.545, p < .001. There was a significant difference on
the before ACT training, photographing category level of knowledge scores (M = 2.57, SD =
1.06) and the after ACT training, photographing category level of knowledge scores (M = 3.46,
SD = 0.72), t (172) = -11.172, p < .001. There was a significant difference on the before ACT
training, reporting laws category level of knowledge scores (M = 3.03, SD = 1.04) and the after
ACT training, reporting laws category level of knowledge scores (M = 3.74, SD = 0.53), t (173)
= -9.917, p < .001. There was a significant difference on the before ACT training, perpetrators
category level of knowledge scores (M = 2.74, SD = 1.06) and the after ACT training,
perpetrators category level of knowledge scores (M = 3.45, SD = 0.74), t (173) = -9.461, p <
.001. There was a significant difference on the before ACT training, disability category level of
knowledge scores (M = 2.72, SD = 0.99) and the after ACT training, disability category level of
knowledge scores (M = 3.45, SD = 0.68), t (172) = -11.182, p < .001. There was a significant
difference on the before ACT training, cognitive impairment category level of knowledge scores
(M = 2.63, SD = 1.01) and the after ACT training, cognitive impairment category level of
knowledge scores (M = 3.33, SD = 0.74), t (173) = -10.993, p < .001. There was a significant
difference on the before ACT training, resources category level of knowledge scores (M = 2.52,
SD = 0.96) and the after ACT training, resources category level of knowledge scores (M = 3.44,
SD = 0.63), t (173) = -12.935, p < .001.
Results indicate that the after ACT training level of knowledge scores in all nine
categories were significantly higher than the before ACT training level of knowledge scores;
26
the paired differences for the level of knowledge categories are detailed below in Tables 1 and 2,
[image:37.612.64.576.102.762.2]respectively.
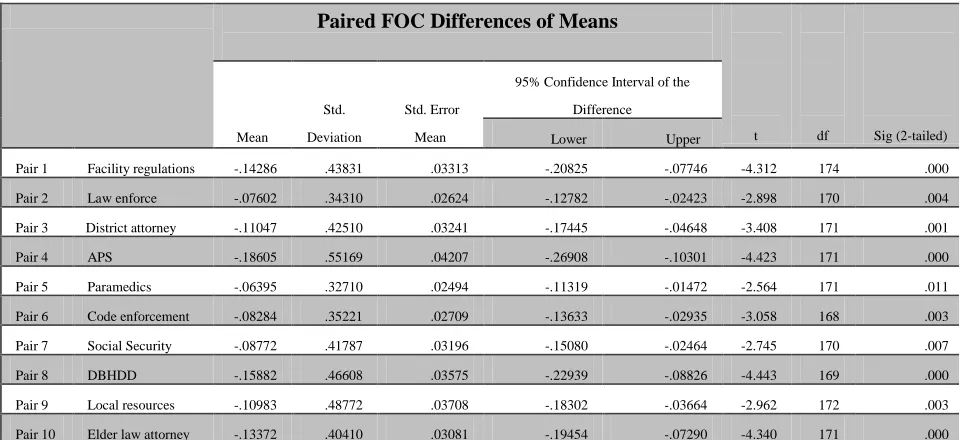
Table 1
Mean Scores on Average Level of Knowledge Mean N Std. Deviation Std. Error Mean Pair 1 Collaboration (before) 2.7011 174 .96906 .07346 Collaboration (after) 3.7241 174 .53089 .04025 Pair 2 Laws (before) 2.6207 174 .95253 .07221 Laws (after) 3.7184 174 .51115 .03875 Pair 3 Evidence (before) 2.7184 174 .98310 .07453 Evidence (after) 3.6322 174 .64718 .04906 Pair 4 Photographing (before) 2.5723 173 1.06298 .08082 Photographing (after) 3.4624 173 .71936 .05469 Pair 5 Reporting laws (before) 3.0345 174 1.04188 .07898 Reporting laws (after) 3.7356 174 .52586 .03987 Pair 6 Perpetrators (before) 2.7414 174 1.05721 .08015 Perpetrators (after) 3.4483 174 .74117 .05619 Pair 7 Diability (before) 2.7168 173 .99160 .07539 Disability (after) 3.4451 173 .67655 .05144 Pair 8 Cognitive impair (before) 2.6322 174 1.00995 .07656
Cognitive impair (after) 3.3333 174 .73973 .05608 Pair 9 Resources (before) 2.5172 174 .96003 .07278 Resources (after) 3.4425 174 .63120 .04785
Table 2
Paired Average Level of Knowledge Differences of Means
Mean Std. Deviation Std Error Mean
95% Confidence Interval
t df Sig (2-tailed) Lower Upper
Pair 1 Collaboration -1.02299 1.01409 .07688 -1.17473 -.87125 -13.307 173 .000
Pair 2 Laws -1.09770 .93530 .07091 -1.23765 -.95775 -15.481 173 .000
Pair 3 Evidence -.91379 .96081 .07284 -1.05756 -.77003 -12.545 173 .000
Pair 4 Photographin
g
-.89017 1.04801 .07968 -1.04745 -.73290 -11.172 172 .000
Pair 5 Reporting
laws
-.70115 .93258 .07070 -.84069 -.56161 -9.917 173 .000
Pair 6 Perpetrators -.70690 .98559 .07472 -.85437 -.55942 -9.461 173 .000
Pair 7 Disability -.72832 .85668 .06513 -.85689 -.59976 -11.182 172 .000
Pair 8 Cognitive
imp
-.70115 .84134 .06378 -.82704 -.57526 -10.993 173 .000
[image:37.612.71.307.133.387.2]27 Pre and Post ACT Training Frequency of Contact
This study’s alternative hypothesis regarding research question two stated that
respondents did increase their interagency collaboration after ACT training. A dependent t-test
was conducted on the respondents’ self-identified frequency of contact with ten agencies before
they received ACT training and their self-identified frequency of contact with the same ten
agencies after they received ACT training to determine whether difference of means of the two
scores for each agency were significantly different, with alpha set at .05. There was a significant
difference on the before ACT training, frequency of contact with the healthcare facility
regulation agency scores (M = 1.95, SD = 0.90) and the after ACT training, frequency of contact
with the healthcare facility regulation agency scores (M = 2.09, SD = 0.85), t (174) = -4.312, p <
.001. There was a significant difference on the before ACT training, frequency of contact with
the law enforcement agency scores (M = 2.43, SD = 1.02) and the after ACT training, frequency
of contact with the law enforcement agency scores (M = 2.50, SD = 1.00), t (170) = -2.898, p =
.004. There was a significant difference on the before ACT training, frequency of contact with
the district attorney agency scores (M = 1.84, SD = 0.95) and the after ACT training, frequency
of contact with the district attorney agency scores (M = 1.95, SD = 0.99), t (171) = -3.408, p =
.001. There was a significant difference on the before ACT training, frequency of contact with
the Adult Protective Services agency scores (M = 2.32, SD = 1.09) and the after ACT training,
frequency of contact with the Adult Protective Services agency scores (M = 2.51, SD = 1.01), t
(171) = -4.423, p < .001. There was a significant difference on the before ACT training,
frequency of contact with the paramedic agency scores (M = 1.67, SD = 0.73) and the after ACT
training, frequency of contact with the paramedic agency scores (M = 1.74, SD = 0.78), t (171) =
28
contact with the code enforcement agency scores (M = 1.53, SD = 0.66) and the after ACT
training, frequency of contact with the code enforcement agency scores (M = 1.61, SD = 0.69), t
(168) = -3.058, p = .003. There was a significant difference on the before ACT training,
frequency of contact with the Social Security agency scores (M = 1.68, SD = 0.68) and the after
ACT training, frequency of contact with the Social Security agency scores (M = 1.77, SD =
0.72), t (170) = -2.745, p = .007. There was a significant difference on the before ACT training,
frequency of contact with the DBHDD agency scores (M = 1.85, SD = 0.91) and the after ACT
training, frequency of contact with the DBHDD agency scores (M = 2.01, SD = 0.91), t (169) =
-4.443, p < .001. There was a significant difference on the before ACT training, frequency of
contact with the local resources agency scores (M = 2.06, SD = 0.89) and the after ACT training,
frequency of contact with the local resources agency scores (M = 2.17, SD = 0.85), t (172) =
-2.962, p = .003. There was a significant difference on the before ACT training, frequency of
contact with the elderly law attorney agency scores (M = 1.39, SD = 0.61) and the after ACT
training, frequency of contact with the elderly law attorney agency scores (M = 1.52, SD = 0.69),
t (171) = -4.340, p < .001.
Results indicate that the after ACT training frequency of contact scores for all ten
agencies were significantly higher than the before ACT training frequency of contact scores;
therefore, the alternative hypothesis for research question two was supported. The mean scores
and the paired differences for the frequency of contact with each agency are detailed below in
29 Table 3
Mean Scores on Frequency of Contact
Mean N Std. Deviation Std. Err. Mean
Pair 1 Facility regs (before) 1.9486 175 .89871 .06794
Facility regs (after) 2.0914 175 .85277 .06446
Pair 2 Law enforce (before) 2.4269 171 1.01702 .07777
Law enforce (after) 2.5029 171 1.00220 .07664
Pair 3 Dist attorney (before) 1.8372 172 .95342 .07270
Dist attorney (after) 1.9477 172 .98684 .07525
Pair 4 APS (before) 2.3198 172 1.08529 .08275
APS (after) 2.5058 172 1.01161 .07713
Pair 5 Paramedics (before) 1.6744 172 .73257 .05586
Paramedics (after) 1.7384 172 .78445 .05981
Pair 6 Code enforce (before) 1.5266 169 .65525 .05040
Code enforce (after) 1.6095 169 .69103 .05316
Pair 7 Social secure (before) 1.6784 171 .68303 .05223
Social secure (after) 1.7661 171 .72210 .05522
Pair 8 DBHDD (before) 1.8471 170 .91024 .06981
DBHDD (after) 2.0059 170 .91339 .07005
Pair 9 Local resource(before) 2.0636 173 .89019 .06768
Local resource (after) 2.1734 173 .85180 .06476
Pair
10
Eld law attorn (before) 1.3895 172 .60650 .04625
Eld law attorn (after) 1.5233 172 .68785 .05245
Paired FOC Differences of Means
t df Sig (2-tailed) Mean Std. Deviation Std. Error Mean
95% Confidence Interval of the
Difference
Lower Upper
Pair 1 Facility regulations -.14286 .43831 .03313 -.20825 -.07746 -4.312 174 .000
Pair 2 Law enforce -.07602 .34310 .02624 -.12782 -.02423 -2.898 170 .004
Pair 3 District attorney -.11047 .42510 .03241 -.17445 -.04648 -3.408 171 .001
Pair 4 APS -.18605 .55169 .04207 -.26908 -.10301 -4.423 171 .000
Pair 5 Paramedics -.06395 .32710 .02494 -.11319 -.01472 -2.564 171 .011
Pair 6 Code enforcement -.08284 .35221 .02709 -.13633 -.02935 -3.058 168 .003
Pair 7 Social Security -.08772 .41787 .03196 -.15080 -.02464 -2.745 170 .007
Pair 8 DBHDD -.15882 .46608 .03575 -.22939 -.08826 -4.443 169 .000
Pair 9 Local resources -.10983 .48772 .03708 -.18302 -.03664 -2.962 172 .003
[image:40.612.57.537.487.707.2]Pair 10 Elder law attorney -.13372 .40410 .03081 -.19454 -.07290 -4.340 171 .000
30
Extent of Change in Handling Cases against At-Risk Adults
This study’s alternative hypothesis for research question three stated that the ACT
training did change the way that respondents handled cases against at-risk adults. A one sample
t-test was conducted on the mean score of respondents’ self-reported extent of change in the way
they handle cases dealing with at-risk adults since participating in ACT training. This average
extent of change was measured on a 4-level, Likert scale with ‘1’ meaning ‘no change’ and ‘4’
meaning ‘complete change.’ This mean score of their extent of change was measured against the
population mean of 1 (no change).
The average extent of respondents’ change after ACT training (M = 2.49, SD = 0.823)
was significantly different than the population mean (µ = 1), t (174) = 23.895, p < .001,
two-tailed, thus lending support to research question three’s alternative hypothesis. The mean for
average extent of change and the sample t-test results are detailed below in Tables 5 and 6,
respectively.
Mean Extent of Change
N Mean Std. Deviation Std. Error Mean
Extent of Change 175 2.4857 .82251 .06218
Table 5
One-Sample t-Test on Extent of Change
Test Value = 1 (has not changed the way I work)
t df Sig. (2-tailed)
Mean
Difference
95% Confidence Interval of the
Difference
Lower Upper
Extent of Change 23.895 174 .000 1.48571 1.3630 1.6084
31 Extent of Change and Demographics Correlations
This study’s alternative hypothesis for research question four stated that all, some, or one
of the demographic characteristics of respondents were correlated with the change in the way
that respondents handled cases against at-risk adults. Since the mean score of respondents’
self-reported extent of change was significantly different than the population mean, a correlation
analysis was conducted to examine the relationship between this average extent of change and
the seven demographic indicators. With alpha set at .05, there was a significant negative
relationship between the average extent of respondents’ change and education level, r (173) =
-0.173, p = .022. Furthermore, with alpha set at .05, there was also a significant negative
relationship between the average extent of respondents’ change and age, r (169) = -0.160, p =
.037. This result demonstrates support for the alternative hypothesis of research question four.
The remaining five demographic indicators (service area, position, gender, race, and years in
current position) did not demonstrate a significant relationship with extent of change (see Table 7
below).
Helpfulness of Workshops
This study’s alternative hypothesis for research question five was that all, some or one of
the workshop topics were helpful to respondents. A one sample t-test was conducted on the
mean score, regarding the respondents’ reported level of helpfulness, for each ACT workshop Table 7
Correlation Between Extent of Change and Demographic Indicators
service
area position gender race education
years in
position age
Extent of
Change
Pearson
Correlation
.000 -.114 -.042 .000 -.173 -.003 -.160
Sig. (2-tailed) .995 .136 .583 .999 .022 .973 .037
32
topic. This average level of helpfulness was measured on a 4-level, Likert scale with ‘1’
meaning ‘not helpful’ and ‘4’ meaning ‘extremely helpful.’ This mean score of the topics’ level
of helpfulness was measured against the population mean of 1 (not helpful).
The average level of helpfulness for the Georgia law topic (M = 3.23, SD = 0.667) was
significantly different than the population mean (µ = 1), t (174) = 44.318, p < .001, two-tailed.
The average level of helpfulness for the financial exploitation topic (M = 3.33, SD = 0.713) was
significantly different than the population mean (µ = 1), t (174) = 43.156, p < .001, two-tailed.
The average level of helpfulness for the suspicious deaths topic (M = 3.05, SD = 0.843) was
significantly different than the population mean (µ = 1), t (174) = 32.105, p < .001, two-tailed.
The average level of helpfulness for the crimes in facilities topic (M = 2.99 SD = 0.851) was
significantly different than the population mean (µ = 1), t (174) = 30.916, p < .001, two-tailed.
The average level of helpfulness for the indicators of abuse, neglect and exploitation topic (M =
3.29, SD = 0.774) was significantly different than the population mean (µ = 1), t (174) = 39.183,
p < .001, two-tailed. The average level of helpfulness for the collaborating agencies topic (M =
3.18, SD = 0.788) was significantly different than the population mean (µ = 1), t (174) = 36.628,
p < .001, two-tailed. The average level of helpfulness for the community resources topic (M =
3.07, SD = 0.781) was significantly different than the population mean (µ = 1), t (174) = 35.151,
p < .001, two-tailed. The average level of helpfulness for the investigative practices topic (M =
3.13, SD = 0.823) was significantly different than the population mean (µ = 1), t (174) = 34.243,
p < .001, two-tailed. The average level of helpfulness for the normal aging topic (M = 2.84, SD
= 0.870) was significantly different than the population mean (µ = 1), t (173) = 27.985, p < .001,
two-tailed. The average level of helpfulness for the communicating with individuals with
33
= 1), t (174) = 29.767, p < .001, two-tailed. The average level of helpfulness for the prosecuting
cases topic (M = 2.86, SD = 0.1.01) was significantly different than the population mean (µ = 1),
t (174) = 24.316, p < .001, two-tailed.
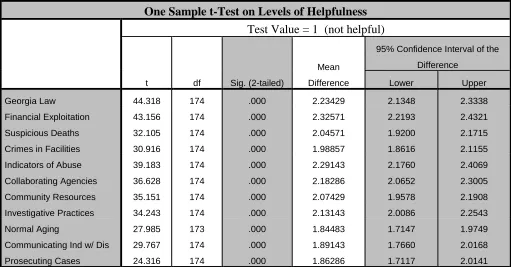
Results indicate that the average level of helpfulness for each of the eleven ACT
workshop topics was significantly higher than the expected population mean of ‘1’ (not helpful).
These results support the alternative hypothesis for research question five. Each topic’s mean
level of helpfulness and the sample t-test results are detailed below in Tables 8 and 9,
respectively.
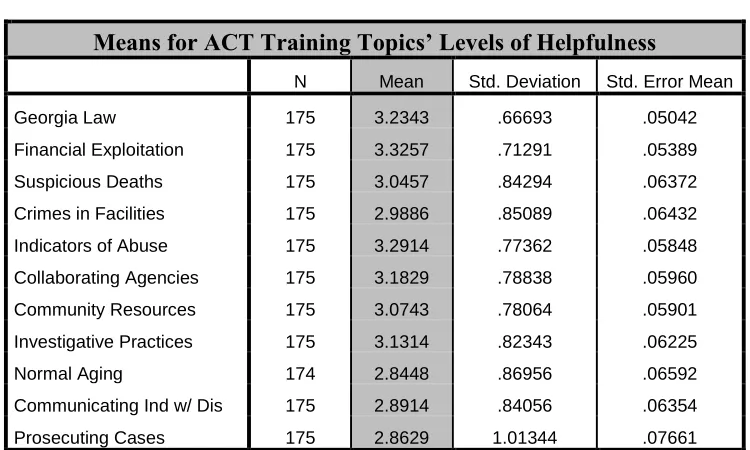
[image:44.612.68.443.341.566.2]T Table 8
Means for ACT Training Topics’ Levels of Helpfulness
N Mean Std. Deviation Std. Error Mean
Georgia Law 175 3.2343 .66693 .05042
Financial Exploitation 175 3.3257 .71291 .05389
Suspicious Deaths 175 3.0457 .84294 .06372
Crimes in Facilities 175 2.9886 .85089 .06432
Indicators of Abuse 175 3.2914 .77362 .05848
Collaborating Agencies 175 3.1829 .78838 .05960
Community Resources 175 3.0743 .78064 .05901
Investigative Practices 175 3.1314 .82343 .06225
Normal Aging 174 2.8448 .86956 .06592
Communicating Ind w/ Dis 175 2.8914 .84056 .06354
34
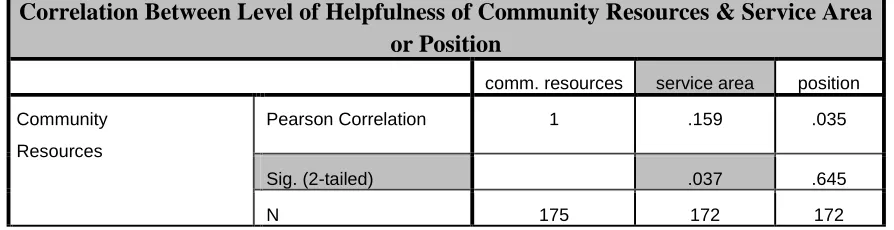
ACT Topic Level of Helpfulness and Service Area Correlations
This study’s alternative hypothesis for research question six is that the service area of
respondents was correlated with the level of helpfulness for one, some, or all of the workshop
topics. Since the mean score, regarding the respondents’ reported level of helpfulness, for each
ACT workshop topic was significantly different from the population mean, a correlation analysis
was conducted to examine the relationship between these levels of helpfulness for each topic and
the demographic indicator, service area. With alpha set at .05, there was a significant positive
relationship between the reported level of helpfulness on the community resources topic and
service area, r (170) = .159, p = .037, lending support to the alternative hypothesis for research
[image:45.612.68.579.85.352.2]question six. Table 9
One Sample t-Test on Levels of Helpfulness
Test Value = 1 (not helpful)
t df Sig. (2-tailed)
Mean
Difference
95% Confidence Interval of the
Difference
Lower Upper
Georgia Law 44.318 174 .000 2.23429 2.1348 2.3338
Financial Exploitation 43.156 174 .000 2.32571 2.2193 2.4321
Suspicious Deaths 32.105 174 .000 2.04571 1.9200 2.1715
Crimes in Facilities 30.916 174 .000 1.98857 1.8616 2.1155
Indicators of Abuse 39.183 174 .000 2.29143 2.1760 2.4069
Collaborating Agencies 36.628 174 .000 2.18286 2.0652 2.3005
Community Resources 35.151 174 .000 2.07429 1.9578 2.1908
Investigative Practices 34.243 174 .000 2.13143 2.0086 2.2543
Normal Aging 27.985 173 .000 1.84483 1.7147 1.9749
Communicating Ind w/ Dis 29.767 174 .000 1.89143 1.7660 2.0168
35
Correlation Between Level of Helpfulness of Community Resources & Service Area or Position
comm. resources service area position
Community
Resources
Pearson Correlation 1 .159 .035
Sig. (2-tailed) .037 .645
[image:46.612.71.518.92.207.2]N 175 172 172
36
CHAPTER V
Discussion
This study, in accordance with the third step of the Public Health Approach to Violence
Prevention Theory, strived to determine the impacts of the At-Risk Adult Crime Tactics (ACT)
Certification Training on various professionals who participated in the training. The survey
yielded interesting findings.
Summary of the Study
The first research question sought to determine if knowledge level regarding at-risk adult
abuse increased in respondents after ACT training. The data revealed that the knowledge level
of respondents did indeed increase for all nine ACT training categories regarding at-risk adult
abuse (communicating with collaborative agencies in abuse situations, Georgia laws and legal
options related to abuse, gathering evidence in abuse cases, photographing locations and
individuals, information about mandatory reporting laws, interviewing possible perpetrators,
working with individuals with intellectual disability, interviewing individuals with cognitive
impairment, and availability of local resources). In fact, though for this study’s criteria, alpha
was set at .05, the differences in pre and post ACT training, level of knowledge means for all
37
extremely strong improvement in knowledge levels. In other words, respondents felt that ACT
training had substantially improved their working knowledge of at-risk adult abuse.
Similarly, the second research question wanted to pursue if ACT training had affected
respondents, however, this time the query regarded job performance after ACT training. This
question sought to determine if respondents increased their interagency collaboration after ACT
training. This increase was determined by how often respondents recounted contacting various
agencies both before and after ACT training. The data revealed that respondents did indeed
increase their interagency collaboration with all ten agencies (healthcare facility regulation, law
enforcement, district attorneys, APS (Adult Protective Services), paramedics, code enforcement,
Social Security, DBHDD (Department of Behavioral Health and Developmental Disabilities),
local resources, and elder law attorneys). Similarly to results for the first research question,
though alpha was set at .05 for this study’s purposes, the differences in pre and post ACT,
frequency of contact means for nine out of ten agencies (paramedics was p = .011) were
significant with alpha set at less than .01, signifying a particularly robust increase in interagency
collaboration amongst respondents. In other words, respondents felt that ACT training had
greatly improved their interagency collaboration practices.
Correspondingly to question two, research question three also sought to differentiate
between respondents’ job performance before and after ACT training. This question asked if
ACT training had changed the way in which respondents handled cases against at-risk adults.
This change was determined by the respondents’ self-reported extent of change since completing
ACT training. The data suggested that after ACT training, respondents had significantly changed
the way in which they handled cases against at-risk adults. As with results from the previous two