i
Superprotonic Solid Acids
Thermochemistry, Structure, and Conductivity
Thesis by
Ayako Ikeda
In Partial Fulfillment of the Requirements
For the Degree of
Doctor of Philosophy
California Institute of Technology
Pasadena, California
2013
ii ©2013
Ayako Ikeda
iii
Acknowledgements
I got great help from many people to complete my research. I would like to state my appreciation in this section.
First, I thank my advisor, Dr. Sossina Haile for a lot of things. She gave me an opportunity to have very valuable experience in the U.S. She accepted me even though I had a language issue. I got strong support from her. The advice which she gave me was very valuable, not only for my research as a great scientist but also for my everyday life as a mother of young kids. I was very happy to join her group.
I thank Dr. Tetsuya Uda, who instructed me when I started my research as a volunteer. I could not get the idea that I can construct any measurement equipment by myself until he suggested I make humidified TG. I learned how to survive in the lab at that time as my first step.
I thank a machinist, Mike Vondrus for his great help and friendship. I could not build my measurement systems without his powerful help by his magical hands and deep knowledge. I thank his wife, Masako Vondrus for her kindness and friendship. I was very happy to meet them and spend time with them.
I thank Dr. Mary Louie, who was my labmate, for her kindness, help, advice and discussion. It was fun to spend time with her during trips for conferences. I thank Dr. Calum Chisholm and Dr. Dane Boysen for giving me advice, Dr. William Chow, Dr. Yoshihiro Yamazaki, and TaeSik Oh for giving me great suggestions and discussions.
I thank Chih-Kai Yang for helping my XRD duty a lot. Also, he encouraged me when we were taking ESL class together. I am so happy that both of us passed the SPEAK test just before my graduation.
I thank Jack Geasland for his big effort to teach me writing and speaking English. I deeply thank Carolyn Richmonds for great help in checking up my English in the thesis. She kindly accepted the tough work with friendly smile. I could not have finished writing without her.
I would like to thank all my labmates and friends for their help and friendship.
iv
Abstract
In this work, in order to investigate the thermochemistry and property of the
superprotonic solid acid compounds, the measurement methods were established for
in-situ observation, because superprotonic phases are neither stable at room temperature nor
freezable to room temperature. A humidity-controlled TG, DSC and AC impedance
measurement system, and high temperature stage for XRD were built for thermal analysis
and characterization of the solid acid compounds.
The thermodynamic and kinetics of the dehydration and hydration of CsH2PO4 is
investigated by TG, DSC, and XRD analysis. By making use of the enhanced kinetics
afforded by SiO2, the phase boundary between CsH2PO4, CsPO3, and dehydrated liquid
was precisely determined. The stability of CsH2PO4 and the liquid dehydrate, CsH
2(1-x)PO4-x(l), were confirmed by the complete reversal of dehydration to recover these
phases in the appropriate temperature and water partial pressure ranges. Rehydration and
conversion of CsPO3(s) to CsH2PO4(s) occurs over a period of several hours, depending
on temperature, water partial pressure, and morphology of the metaphosphate. High and
small particles favor rapid dehydration, whereas the temperature dependence of the
rehydration kinetics is nonmonotonic, reaching its fastest rate in the vicinity of the
superprotonic transition.
Doping Rb and K into CDP was examined and the stable region of Cs1-xRbxH2PO4
and Cs1-xKxH2PO4 are determined by in situ XRD and DSC measurement. Then the effects of doping to the structure and conductivity are discussed. It was found that Rb has
v
with Rb content. K has 27% solubility for cubic CDP, Ts and Td decrease with K content. The eutectic temperature is 208 ± 2°C. The lattice size of Rb- or K- doped CDP depends
on the averaged cation size. Conductivity linearly decreases by dopant concentration. The
impact of K doping is deeper than that of Rb for the equivalent averaged cation size.
In situ XRD measurement was carried out using single-crystal CsH2PO4 in order to study the phase transformation mechanism of this compound. A plate-like single
crystal with (100) orientation was prepared, and the phase transition was observed by
heating and cooling with ramp rate 0.2 K/min. From the obtained XRD profile — the
after-first-phase transition (monocliniccubic) — the distribution of the domain
orientation was estimated. It was found that (100) is the preferential orientation after
phase transition, however, the amount of the domains with other orientation is not
ignorable. Therefore, it is considered that the phase transformation in CsH2PO4 is not
simple martensitic, but that some other event, such as recrystallization, happens during
vi
Table of contents
Chapter 1 Introduction ... 1
1.1 Overview ...1
1.2 High-proton-conductive solid acid compounds and phase transition ...3
1.3 Chemical stability ...6
1.4 Fuel cell application of solid acid compounds ...8
Bibliography ...10
Chapter 2 Experimental methods ... 12
2.1 Synthesis ...12
2.2 Thermogravimetry ...13
2.3 Differential scanning calorimetry ...15
2.4 AC impedance spectroscopy ...18
2.5 Energy-dispersive spectroscopy...19
2.6 Lattice parameter refinement ...20
2.6.1 Nelson-Riley extrapolation method5 ... 21
2.6.2 Internal standard ... 23
2.6.3 Rietveld refinement ... 23
Bibliography ...25
Chapter 3 Dehydration-hydration of CsH2PO41 ... 26
3.1. Introduction ...26
3.2. Experimental details ...28
3.3. Results and discussion ...30
3.3.1. Interaction of CsH2PO4 with SiO2 ... 30
3.3.2. General dehydration characteristics and data analysis methodology ... 32
3.3.3. Thermodynamics of dehydration ... 38
3.3.4. Kinetics of rehydration ... 49
4. Conclusions ...56
Bibliography ...58
Chapter 4 Phase behavior of cation doped cubic CsH2PO4 ... 60
4.1. Introduction ...60
vii
4.2.1. Sample preparation ... 61
4.2.2. In situ XRD measurements ... 63
4.2.3. DSC measurements ... 66
4.2.4. AC impedance measurements ... 67
4.3. Results and discussion ...67
4.3.1 Overall phase characteristics ... 67
4.3.2 Determination of Phase Behavior in the Cs1-xRbxH2PO4 system: 0 x 1 .... 70
4.3.3 Phase Behavior in the Cs1-xKxH2PO4 system: 0 x 0.3 ... 74
4.3.4 Structural and Transport Properties ... 78
4.4. Conclusion ...83
Bibliography ...85
Chapter 5 Phase transformation of CsH2PO4 ... 87
5.1 Introduction ...87
5.2 Mechanisms of Structural-phase transformation ...88
5.2.1 Martensitic transformation3,4 ... 88
5.2.2 Nucleation and growth-typed transformation ... 92
5.2.3 Recrystallization ... 93
5.3 Experimental method ...94
5.4 Result and discussion ...95
5.5 Conclusion ...99
Bibliography ...101
Appendix A Phase behavior of anion doped cubic CsH2PO4 ... 102
A.1. CsH2PO4–CsHSO4 system ...102
A.2. CsH2PO4–CsI system ...103
A.3 Conclusion ...106
viii
List of figures
Figure 1.1. Conductivity change of CDP ...2
Figure 1.2. The conductivities of superprotonic phases of solid acid compounds. ...4
Figure 1.3. Dehydration process of CDP ...7
Figure 1.4. The fuel cell performance of the commercial stack (SAFCell) ...8
Figure 2.1. Balance/furnace configurations of TG ...14
Figure 2.2. Schematic view and actual setup of the system ...14
Figure 2.3. The principle of DSC measurement ...16
Figure 2.4. The schematic representation of the DSC setups ...17
Figure 2.5. The actual setup of DSC system ...17
Figure 2.6. The equivalent circuit (parallel of R and C) of solid electrolyte ...18
Figure 2.7. The impedance profiles of low conductivity and superprotonic phases ...19
Figure 2.8. The back scattered electron image of the annealed composites. ...20
Figure 2.9. The actual setup of the high temperature sealed stage for XRD. ...21
Figure 2.10. The relation of the sample displacement and the error in the angle ...22
Figure 2.11. Extrapolation of lattice parameters using the Nelson-Riley method ...23
Figure 3.1. The schematic diagram of the in-house constructed DSC. ...30
Figure 3.2. XRD profiles of the dehydration product of composite.. ...31
Figure 3.3. SEM images of the dehydration product of composite ...32
Figure 3.4. Typical dehydration behavior of CDPbelow the triple point. ...34
Figure 3.5. Typical dehydration behavior of CDP above the triple point. ...35
Figure 3.6. Weight change behavior of CDP (in composite form with SiO2). ...39
Figure 3.7. Thermal behavior of CDP (in composite form with SiO2). ...40
Figure 3.8. Isothermal weight change behavior of CsPO3, CDP ...41
Figure 3.9. TheT–pH2Ophase diagram of CDP. ...43
Figure 3.10. Comparison of de-, rehydration behavior of CDP and CsPO3 ...45
Figure 3.11. Isothermal hydration behavior of CsPO3in various forms. ...50
Figure 3.12. Isothermal hydration behavior of CsPO3 at several temperatures. ...52
Figure 3.13. Isothermal hydration behavior of CsPO3 under several pH2O . ...55
Figure 4.1. The schematic view of the high temperature sealed stage ...63
Figure 4.2. XRD profile of CDP with Si at several temperatures ...65
ix
Figure 4.4 Phase diagram of (a) CDP-RDP and (b) CDP-KDP systems ...69
Figure 4.5(a). XRD profiles of Cs0.5Rb0.5H2PO4 with Si at several temperatures ...71
Figure 4.5(b). XRD profiles of RbH2PO4 with Si at several temperatures ...72
Figure 4.5(c). XRD profiles of Cs1-xRbxH2PO4 with Si (x = 0~1) ...72
Figure 4.6(a). DSC profiles of Cs1-xRbxH2PO4 (x = 0.19) ...74
Figure 4.6(b). DSC profiles of Cs1-xRbxH2PO4 (x = 0~1) ...74
Figure 4.7(a). XRD profile of Cs1-xKxH2PO4...75
Figure 4.7(b, c). XRD profile of Cs1-xKxH2PO4 (x = 0.15, 0.3, 0.5) ...75
Figure 4.8. The lattice parameter change by K doping ...77
Figure 4.9. DSC profiles of the 10%K composition ...78
Figure 4.10. Lattice parameters of Rb- and K-doped CDP at several temperatures ....79
Figure 4.11. Ionic radius and lattice parameters of Rb- and K-doped CDP ...80
Figure 4.12. AC impedance spectrum of 19% Rb- and 10% K-doped CDP ...81
Figure 4.13. Conductivity of doped CDP (cubic) at several temperatures ...81
Figure 4.14. Pre-exponential factor and activation energy against the cation radius ....82
Figure 5.1. Schematic diagram of the transformation of a spherical particle ...89
Figure 5.2. Austenite/martensite interface with a simple transition layer ...90
Figure 5.3. Plot of the factor in the formula for the hysteresis H vs. λ2 ...91
Figure 5.4. The Gibbs free energy on the crystal size ...92
Figure 5.5. Recrystallization of a metallic material and crystal grains growth ...93
Figure 5.6 Temperature history of in situ XRD measurement ...94
Figure 5.7. XRD profiles of single-crystal CDP with elevating temperature ...95
Figure 5.8. XRD profiles of single-crystal CDP with cooling ...96
Figure 5.9. The normalized peak areas for (200) and (400) with thermal cycle ...96
Figure 5.10. XRD profiles of monoclinic phase and cubic phase ...97
Figure 5.11. The distribution of domain orientation after transformation ...99
Figure A.1. The suggested phase diagram of CDP–CHS system ...103
Figure A.2. The phase diagram of the CDP–CsI system ...104
Figure A.3. The lattice constant of iodine-doped CDP ...104
x
List of Tables
Table 2.1. The synthesis methods ...13
Table 2.2. The parameters which are refined using Rietveld method ...24
Table 3.1. Lattice constants of CDP after thermal cycling with SiO2 ...32
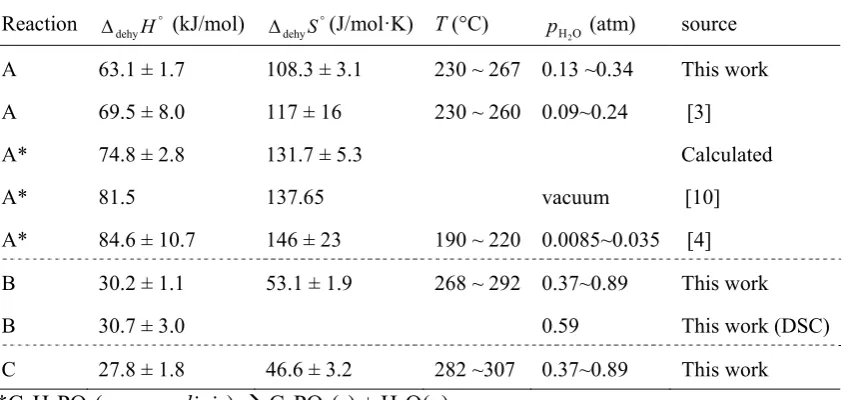
Table 3.2. Summary of thermodynamic parameters for the dehydration of CDP ...48
Table 4.1. The dopant concentrations which were obtained by EDS measurements ....62
Table 4.2. The fitting parameters of Rietveld refinements for CDP ...65
Table 4.3. The thermal expansion coefficients of doped CDP ...79
Table 5.1. The quantity of the domains with specific orientation ...98
Table A.1. The crystal structure, Ts and Tm of Cs(H2PO4)1-x(HSO4)x ...102
xi
List of Acronyms
ACIS alternating current impedance spectroscopy
CDP cesium dihydrogen phosphate, CsH2PO4
CHP cesium hydrogen phosphite, CsHPO3H
CHS cesium hydrogen sulfate, CsHSO4
DSC Differential scanning calorimetry
DTA Differential thermal analysis
EDS energy dispersive spectroscopy
KDP potassium dihydrogen phosphate, KH2PO4
RDP rubidium dihydrogen phosphate, RbH2PO4
SEM scanning electron microscopy
TG Thermogravimetry
1
Chapter 1
Introduction
1.1 Overview
Solid acid compounds, which are composed of half normal salt and half acid, are
solid-state materials with protons in the structure. An example is CsHSO4, which is
formed by the reaction of a cesium salt and sulfuric acid,
½Cs2SO4 + ½H2SO4 = CsHSO4 (1)
Solid acids have similar properties to salts in that they are brittle ionic crystals which are
insulating at room temperature. Some of them are highly water soluble. One of the
biggest differences between salts and solid acids is that most solid acid compounds are
not truly stable at dry atmosphere. The reason that solid acid compounds can keep their
form for a very long time in the laboratory is that the saturated water vapor pressure is
too low at room temperature to cause rapid decomposition. It is known that some solid
acid compounds have high proton conductivity phases, with proton conductivity higher
than 1×10⁻³ Ω-1cm-1, at elevated temperature. Such phases are called superprotonic, and the phase transformation from low to high conductivity phase; as called superprotonic
transition. These compounds are attractive materials for fuel cell electrolytes because
they are solid and are ideal for work in the moderate temperature range (100 < T <
300 °C). In this temperature range, it is expected that fuel cells can have both portability
and high efficiency. In order to explore new fuel cell electrolyte materials and to reveal
2
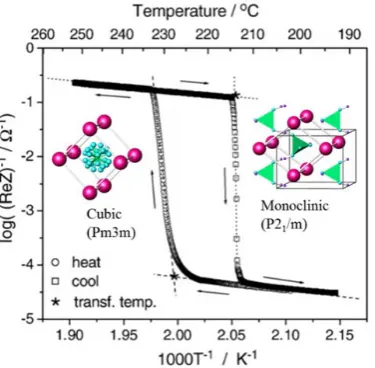
Figure 1.1. Conductivity change of CsH2PO4 with phase transition between cubic and monoclinic
structure.1
Through these investigations, it was made clear that the rotation of the oxyanion
has a major role in the proton migration of solid acid compounds. This oxyanion rotation
rate strongly depends on the crystal structure. In cases where the compounds have high
symmetry structures, the oxyanion can easily rotate because the lattice has many
equivalent O atom sites. Protons in such high symmetry structured compounds can move
with O atoms when the oxyanion rotates, which contributes to the high proton conduction
in such compounds. However, in the case that the compounds have low symmetry
structures, the rotation or movement of the oxyanion is restricted. Therefore, the proton
jump rate from one site to another site is slow, and these compounds have low
conductivity.
The explorations of the high conductivity compounds have been carried out
primarily by AC impedance measurements within the form of a pellet or a single crystal.
However, since solid acid compounds are not stable in a dry atmosphere and their
3
pure superprotonic phases by more conclusive methods, like XRD or DSC analysis on
their powder forms. Due to these difficulties, there is a lack of consistency in the
literature on solid acids and their superprotonic phases. In these reports, the absence of
knowledge of the thermochemistry of these compounds is apparent. In order to
understand a variety of solid acid material properties, it is necessary for the compounds to
be in equilibrium condition.
In this work, I present my efforts to obtain reliable data under equilibrium
conditions. I built several measurement systems with humidification and developed
methods to obtain reliable property data on solid acid compounds (mainly phosphates) in
order to ascertain what conditions are necessary for high conductivity compounds with
broader stable temperature region.
1.2 High-proton-conductive solid acid compounds and phase transition
The compounds which are reported as superprotonic, grouped by structure are:
Cubic (Pm3m); CsH2PO4, RbH2PO4, CsH2AsO42 and CsHPO3H3
Tetragonal (I41/amd); CsHSO44 and CsH2PO45
Hexagonal (P3m); Cs5H3(SO4)4·nH2O, Cs5H3(SeO4)4·nH2O3, K5H3(SO4)4·nH2O3, Rb5H3(SO4)4
There are several mechanisms for proton migration. The first one is the combination of
the rotation of oxyanion and the proton jump as typified by CsHSO44 and CsH2PO45. It is
known that cubic phase CsH2PO4, RbH2PO4, CsH2AsO42, and CsHPO3H3, and tetragonal
4
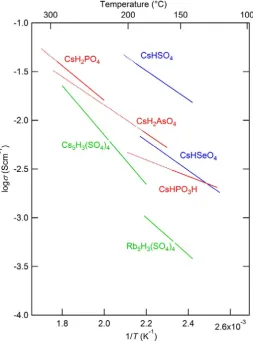
Figure 1.2. The conductivities of superprotonic phases of solid acid compounds (CsH2PO46,
RbH2PO4, CsH2AsO42, CsHPO3H7, CsHSO44, CsHSeO44, Cs5H3(SO4)4·nH2O8, Rb5H3(SO4)49; Red lines are cubic, blue lines are tetragonal and Green lines are hexagonal structured compounds. The broken lines are the extrapolation to melting temperatures.
The second one is the diffusion of the proton from crystal water as typified by
Cs5H3(SO4)4·nH2O3. It is known that Cs5H3(SO4)4·nH2O, Cs5H3(SeO4)4·nH2O3 and K5H3(SO4)4·nH2O3 belong to this group of compounds10. The crystal water concentration depends on water vapor pressure as well as conductivity in this case. Recently,
Rb5H3(SO4)4 was found to have the same crystal structure as this compound9. It is
5
corresponding temperature range. In this group of solid acid compounds, CsHSO4 has the
highest conductivity and Rb5H3(SO4)4 has the lowest conductivity. The others have very
similar conductivities at corresponding temperatures.
Since the superprotonic phases exist at high temperature (100~300°C), the phase
transition events are observed during heating up or cooling down the sample. The
enthalpy of the phase transitions agrees well with values calculated from the differences
in the entropy, which is caused by the change of the proton configurations from ordered
to random state.11 Under the following rules, the configuration of the protons is expressed
by Equation (2). 11
(1) Each oxygen atom has two and only two protons.
(2) Each hydrogen bond has one and only one proton.
(3) The hydrogen bonds are directed towards the neighboring oxygen atoms.
(4) Interaction between nonneighboring H2O molecules does not influence the
distribution of hydrogen bond configurations.
The enthalpy change by phase transition is then described by Equation (3).
(2)
) ln(
Hs Ts Ss TsR (3)
6
1.3 Chemical stability
In order to operate a fuel cell with solid acid electrolyte, it is required that the
electrolytes are stable under a hydrogen, oxygen, and humidified atmosphere.
Unfortunately, all sulfates and serenates are not stable under a hydrogen atmosphere
because they form H2S or H2Se. For example, cesium hydrogen sulfate and hydrogen gas
react to form hydrogen sulfate13 by the reaction,
½ CsHSO4(s) + H2(g) ¼ Cs2SO4(s) + H2O(g) + ¼ H2S(s) (4)
Even worse, H2S and H2Se act to poison the platinum catalyst, leading to decreased
activity of the fuel cell. Therefore these compounds are not suitable as electrolytes.
Phosphates, phosphites and arsenates react with neither hydrogen nor oxygen below their
melting temperature.
Since whole solid acid compounds have hydrogen and oxygen atoms in the
structure, they dehydrate at certain temperatures. The dehydration temperatures of solid
acid compounds depend on the water vapor pressure. For example, CsH2PO4 dehydrates
at 290°C when pH2O is 0.8 atm and at 240°C when pH2O is 0.2 atm14. Some compounds pass liquid forms when these dehydrate with elevating the temperature as figure 1.3. This
makes the rate of the dehydration reaction very slow. Many previous studies in the
literature have inaccurately reported the dehydration of the solid acid as a phase change
(melting) through their failure to note the weight change. In this study, I have defined the
melting of solid acid compounds as the solid to liquid reaction occurring without weight
7
the atmosphere in the cell is very important. In Chapter 3, the details of the dehydration
behavior of CsH2PO4 are reported.
Figure 1.3. Dehydration process of CsH2PO4 during elevating temperature under the constant
water vapor pressure
Because solid acid compounds have acids in the structure, they react with many
metals and ceramics, as acids do at high temperatures. It is known that Pt, SiO2, TiO2,
and some polymers are stable with solid acid compounds at high temperature. However,
the number of compatible materials for use in the components of fuel cells, such as
catalysts and electrodes, is very limited.
Most solid acid compounds are water soluble and some of these are deliquescent
materials. The typical deliquescent compounds are CsHPO3H or KHPO3H. These
materials absorb water from the atmosphere very quickly and their solid forms are not
stable under ambient atmosphere at room temperature. It is reported that these
compounds can be stabilized by putting high surface area SiO2 powder in the
compounds7 or nano-sized SiO215. On the other hand, the water insoluble compounds,
8
1.4 Fuel cell application of solid acid compounds
CsH2PO4 is the most promising compound for fuel cell applications because it is
stable under humidified hydrogen and oxygen gas atmosphere. The stack performance
which was commercially developed by SAFCell was demonstrated as 250W (Figure 1.4).
Figure 1.4. The fuel cell performance17 of the commercial stack17 (SAFCell)
In order to obtain higher efficiency operation of the fuel cell, catalysis of the cathode
reaction is most important. Many approaches have been tried to improve the cathode
performance by forming nanostructured CsH2PO4 to introduce a large area of contact area
between the solid acid and the catalyst.18,19 In such a fine structure, the kinetics of
dehydration, recrystallization, and grain growth of CsH2PO4 are fast and obvious. In
addition, the large surface area makes CsH2PO4 deliquescent. We can control dehydration
and hydration if we have accurate thermodynamic information about the reaction. On the
other hand, in order to prevent the destruction of the nanostructure by recrystallization,
grain growth, or water absorption, support materials must be added. High-surface-area
9
absorbs water and it is used as a solid desiccant. Also, SiO2 has good wettability with
CsH2PO414.
Due to the narrow window of operation temperatures for CsH2PO4 (230~280 °C
at pH2O = 0.6 atm) new compounds for the fuel cell electrolytes in different temperature ranges have been explored. Doping is a common method for modifying the stable
temperature region. For CsH2PO4, Rb and K doping were tried.20,21 When CsH2PO4 is
doped with Rb, the phase transition temperature increases and the dehydration
temperature decreases. When CsH2PO4 is doped with K, both the phase transition
temperature and dehydration temperature decrease. The lowest transition temperature
achieved is just below 210 °C. However, it was found that the conductivity largely
decreases with K doping.
Cubic CsHPO3H, which is stable in the temperature range 120~200 °C7, is
another promising compound. It was found that by adding 20 at.% high-surface-area
silica powder, the deliquescency of this compound at room temperature can be overcome.
This composite has relatively high conductivity (~ 10-3 Scm-1) in humidified atmosphere,
and improvement of the conductivity is expected by decreasing the ratio of support
materials. The advantages of this compound are that no dehydration happens, even under
dry conditions, and no phase transition, which causes mechanical destruction by lattice
mismatch between matrix and transformed domains of the fuel cell, happens unless it is
10
Bibliography
1 Louie, M. W., Kislitsyn, M., Bhattacharya, K. & Haile, S. M. "Phase transformation and hysteresis behavior in Cs1−xRbxH2PO4". Solid State Ionics181, 173-179, (2010).
2 Baranov, A. I., Khiznichenko, V. P. & Shuvalov, L. A. "High-Temperature Phase-Transitions and Proton Conductivity in Some KDP-Family Crystals". Ferroelectrics100,
135-141, (1989).
3 Chisholm, C. R. I., Merle, R. B., Boysen, D. A. & Haile, S. M. "Superprotonic phase transition in CsH(PO3H)". Chemistry of Materials14, 3889-3893, (2002).
4 Baranov, A. I., Shuvalov, L. A. & Shchagina, N. M. "Superion Conductivity and Phase-Transitions in CsHSO4 and CsHSeO4 Crystals". Jetp Letters36, 459-462, (1982).
5 Baranov, A. I., Khiznichenko, V. P., Sandler, V. A. & Shuvalov, L. A. "Frequency Dielectric-Dispersion in the Ferroelectric and Superionic Phases of CsH2PO4".
Ferroelectrics81, 1147-1150, (1988).
6 Ikeda, A., Kitchaev, D. & Haile, S. M. "Phase behavior of doped (Rb, K) cubic CsH2PO4". Chemistry of the materials, (2012).
7 Nagao, M., Ikeda, A. & Haile, S. M. "Proton conduction in CsH(PO3H) under dry or
humid conditions". ECS proceedings, (2012).
8 Lavrova, G. V., Ponomareva, V. G. & Burgina, E. B. "Proton conductivity and structural dynamics in Cs5H3(SO4)4/SiO2 composites". Solid State Ionics176, 767-771, (2005).
9 Panithipongwut, C. & Haile, S. M. "High-temperature phase behavior in the Rb3H(SO4)2
-RbHSO4 pseudo-binary system and the new compound Rb5H3(SO4)4". Solid State Ionics
213, 53-57, (2012).
10 Baranov, A. I., Sinitsyn, V. V., Vinnichenko, V. Y., Jones, D. J. & Bonnet, B. "Stabilisation of disordered superprotonic phases in crystals of the M5H3(AO4)4 •xH2O
11
11 Chisholm, C. R. I. & Haile, S. M. "Entropy evaluation of the superprotonic phase of CsHSO4: Pauling's ice rules adjusted for systems containing disordered hydrogen-bonded
tetrahedra". Chemistry of Materials19, 270-279, (2007).
12 Haile, S. M., Chisholm, C. R. I., Sasaki, K., Boysen, D. A. & Uda, T. "Solid acid proton conductors: from laboratory curiosities to fuel cell electrolytes". Faraday Discussions 134, 17-39, (2007).
13 Uda, T., Boysen, D. A. & Haile, S. M. "Thermodynamic, thermomechanical, and electrochemical evaluation of CsHSO4". Solid State Ionics176, 127-133, (2005).
14 Ikeda, A. & Haile, S. M. "The thermodynamics and kinetics of the dehydration of CsH2PO4 studied in the presence of SiO2". Solid State Ionics213, 63-71, (2012).
15 Bondarenko, A. S., Zhou, W. & Bouwmeester, H. J. M. "Superprotonic KH(PO3H)–SiO2
composite electrolyte for intermediate temperature fuel cells". Journal of Power Sources 194, 843-846, (2009).
16 Chisholm, C. R. I., Toberer, E. S., Louie, M. W. & Haile, S. M. "Engineering the Next Generation of Solid State Proton Conductors: Synthesis and Properties of Ba
3-xKxHx(PO4)2". Chemistry of Materials22, 1186-1194, (2010).
17 Safcell_Inc, http://www.safcell.com/_img/DieselPerformance.png
18 Varga, A., Brunelli, N. A., Louie, M. W., Giapis, K. P. & Haile, S. M. "Composite nanostructured solid-acid fuel-cell electrodes via electrospray deposition". Journal of Materials Chemistry20, 6309-6315, (2010).
19 Papandrew, A. B., Chisholm, C. R. I., Elgammal, R. A., Ozer, M. M. & Zecevic, S. K. "Advanced Electrodes for Solid Acid Fuel Cells by Platinum Deposition on CsH2PO4".
Chemistry of Materials23, 1659-1667, (2011).
20 Louie, M. W., Kislitsyn, M., Bhattacharya, K. & Haile, S. M. "Phase transformation and hysteresis behavior in Cs1-xRbxH2PO4". Solid State Ionics181, 173-179, (2010).
21 Ikeda, A. & Haile, S. M. "Examination of the superprotonic transition and dehydration behavior of Cs0.75Rb0.25H2PO4 by thermogravimetric and differential thermal analyses".
12
Chapter 2
Experimental methods
2.1 Synthesis
For many water-soluble solid acid compounds, the most common method used to
obtain the target compounds is precipitation. Generally, acids and carbonates are used as
starting materials. An aqueous solution with stoichiometric ratio of the carbonate and
acid is prepared and then the product is precipitated by evaporating the water or by
adding organic solvents. In cases where the precipitation reaction occurs very quickly,
small grains with uniform composition are obtained; however, sometimes secondary
phases are formed as well. On the other hand, by the slow precipitation method it is
possible to obtain very large crystals, as large as several centimeters. These large crystals
are high purity and single phase.
For compounds that are insoluble in water, such like BaHPO4, pH-controlled
basic solutions are used for precipitation. Acetates are used for making the aqua-solution
with alkali earth metal ions. In order to obtain large crystals of these compounds, it is
necessary to control the precipitation rate. The gel method has been reported for this
purpose. In this method, high viscosity liquid solution glass is filled to a tube, then the
other solution is poured. Since ionic species in the high viscosity solution are provided
very slowly, the precipitation rate can be controlled.
The melting method is favorable for solid solutions, such as Cs1-xRbxH2PO4, or
compounds with multiple anion species, for example, Cs3(H2PO4)(HSO4)2. In this method,
13
200 °C) in a sealed or humidified atmosphere to prevent decomposition. The product is
then cooled down slowly. Here is the list of the synthesis methods for several solid acid
compounds in Table 2.1.
Table 2.1. The synthesis methods (M = Cs, Rb, K, Na, Li, X = S, Se, A = Ba, Sr, Ca)
Method Description Compounds
Precipitation and grain
growth in aqua-solution Large single crystal available High purity MHM5H2PO3(XO4, MHXO4)4, MHPO4, M3H(XO4)2, 3H, A(H2PO4)2
Rapid precipitation Uniform composition Secondary phase formation Small grain size
Water insoluble compounds OK
Aqua-solution with organic solvent:
MH2PO4, MHPO3H, MHXO4
Two basic solutions: AHPO4, Ba3-xKxHxPO4
Complete evaporation
of aqua-solution Easy to put additive (e.g. silica) Quick synthesis CsH2PO4, CsHPO3H
Melting method Good for solid solutions Cs2(H2PO4)(HSO4), Cs1-xRbxH2PO4
2.2 Thermogravimetry
Thermogravimetry (TG) is used to observe weight changes of a sample
accompanying a change in temperature. This method can detect any reactions causing a
mass change in the sample, such as decomposition, oxidation, or hydration. A TG system
consists of a scale, thermocouple for the sample, and heaters which control the sample
temperature. There are three configurations of components (Figure 2.1).
In this study, the hook type was adopted to introduce the controlled humidifier
used in the investigation of the dehydration behavior of CsH2PO4. A schematic overview
of the high-humidity TG system constructed in this work is shown in Figure 2.2 (a), and a
14
entire apparatus is placed inside an oven. The sample environment is humidified by
flowing nitrogen gas at ~ 15 sccm through a heated water bath. The water partial pressure
is measured at the outlet from the water bath using a humidity sensor (rotronic
HygroLab), and the gas is then flowed into a heated quartz tube where the sample is
located.
Figure 2.1. Balance/furnace configurations of TG.1 (a) hook, (b)upright, and (c) parallel type
15
The humidity stability is ± 0.01 atm in water vapor pressure. The sample is placed
in a Pt holder hung from a scale (Mettler Toledo AL54) with resolution ± 0.2 mg using a
thermocouple (Type E). The sample weight used is 150 mg, implying a resolution in the
weight measurement of 0.1%. The thermocouple junction is directly contacted to the
bottom of the quartz glass sample holder to maximize accuracy in both the weight and
temperature measurements. In order to obtain the reasonable result, measurement
programs need to be considered carefully with appropriate ramp rate, dwell time or gas
flow. Especially, in the case that the reaction of the sample is very slow, it is important to
make sure the sample is in the equilibrium condition. TG analysis is a powerful method
to obtain the equilibrium mass or reaction rate at certain temperatures.
2.3 Differential
scanning
calorimetry
Differential scanning calorimetry (DSC) is used to measure the heat production
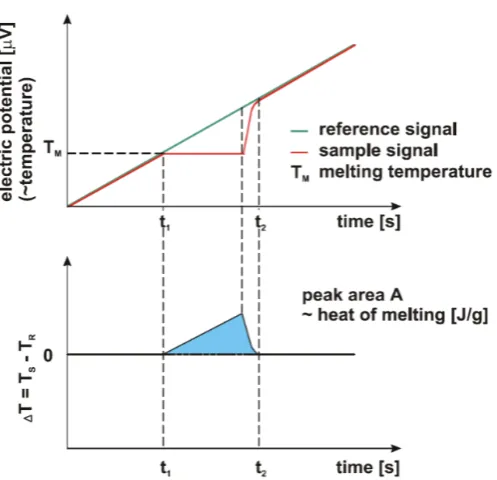
generated by the reaction of the sample. When heating or cooling a compound in the
temperature range where a reaction occurs, the sample temperature may change as figure
2.3 (top). First, the sample temperature linearly changes. When the temperature reaches
the reaction temperature, it remains constant while the reaction proceeds. Finally, after
the reaction is finished, the temperature changes the same way as before the reaction
occurred. By taking the differential between the sample and reference temperatures, the
heat productionor absorption in the reaction is obtained as the area of the peak in figure
2.3 (bottom). The melting of pure metals (In, Sn, Pb, etc..) are used for calibration of heat
16
Figure 2.3. The principle of DSC measurement. (top) Temperature change of the sample and
reference by heating. (bottom) The differential temperature between sample and reference. 2
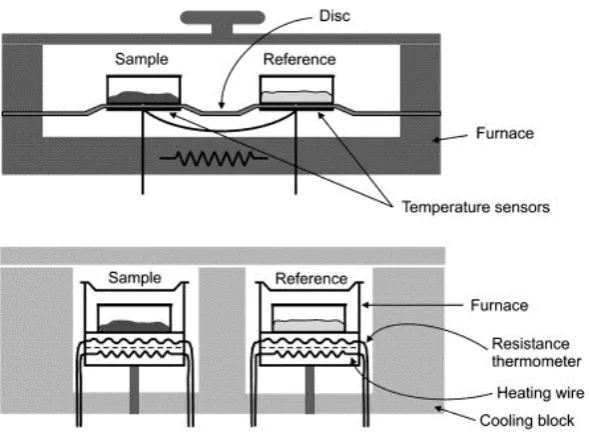
There are two principal types of DSC: power compensated and heat-flux. Figure
2.4 shows the schematic representation of these setups. A power compensated DSC
maintains the temperature difference of zero between the sample and reference in the
independent furnaces. The difference of the power consumptions between two furnaces is
then monitored as the heat emission or absorption. In this method, the heat flow is
obtained directly. A heat-flux DSC heats both the reference and the sample at same time
with a single heater. The heat flow from the sample to the reference pan is monitored by a
differential thermocouple which has two junctions on a heat flux disc at the sample and
reference sides. The differential heat flow is proportional to the temperature difference
between the two points. Resistance temperature detectors (RTDs) can be used here
17
Figure 2.4. The schematic representation of the setup in heat flux DSC (top) and power
compensation DSC (bottom) 3
Figure 2.5. The actual setup of DSC system (center), ver.1 cell (left) and ver.2 cell (right)
In this work, a heat-flux DSC with the humidifier was built for investigation of
solid acid compounds. For ver.1, RTDs are used for the sample cell and for ver.2, E-type
18
2.4
AC impedance spectroscopy
To obtain the ionic conductivity of solid electrolytes, AC impedance spectroscopy
is usually used. When a DC voltage is applied to solid electrolytes, all movable ions
migrate to the electrodes and then stop moving. On the other hand, when AC voltage is
applied, the ions oscillate parallel to the direction of the potential gradient with a
frequency that depends on the AC voltage frequency. The current I(ω) is measured and the impedance, Z(ω) is calculated from the voltage E(ω) and current as
) ( ) ( ) ( I E
Z (1)
where ω is the frequency of the AC voltage. The absolute value of the impedance |Z| can be obtained by the measured voltage, current, and phase difference θ (obtained from
delay of signals). The impedance of a solid electrolyte is equivalent to a parallel circuit
of resistance R and capacitance C (Figure 2.6); this impedance is analytically expressed by equation (2).
Figure 2.6. The equivalent circuit (parallel of R and C) of solid electrolyte
CR i R Z
1 (2)
19
2 2
2
2
2
Z R Z R
i
r (3)
In the case of solid acid compounds, the impedance profiles are shown on a Cole-Cole
Plot as in Figure 2.7(a) for low conductivity and (b) for superprotonic phase. In the
profile, the resistance of the electrolyte appears as the diameter of the semicircle.
However, in the case of superprotonic phase, the semicircle is not observed because the
proton mobility is very large. Here the conductivities of the superprotonic phases are
calculated as the distance between real axis and the plots, as shown in Figure 2.7(b).
Figure 2.7. The impedance profiles of low conductivity and superprotonic phases of solid acid
compounds.4
2.5 Energy-dispersive
spectroscopy
Energy-dispersive spectroscopy (EDS) is used to evaluate the elemental
composition of the sample. The accuracy of composition given by this method is better
for materials composed of heavier elements and poor for materials consisting of elements
lighter than potassium. The measurement results are also affected by the surface
conditions of the sample or the angle at which the electron beam strikes the sample
20
form of the sample. Since many compounds are destroyed by the electron beam, lower
accelerating voltages (< 10 kV) are suitable. When the sample contains two phases, they
can be distinguished from the back-scattered electron image (Figure 2.8).
Figure 2.8. The back scattered electron image of the annealed and quenched composite of (left) CsH2PO4 : KH2PO4 (7:3), (right) CsH2PO4 : CsI
The solubility limit of the dopant elements are measured by the annealing and
quenching method as follows:
A composite is annealed at certain temperature under humidified atmosphere.
It is rapidly cooled by putting the sample container into a water bath.
The phases are identified from the back scattered electron image.
EDS measurements are carried out on the phases.
The composition is determined by the results of at least five measurement points.2.6
Lattice parameter refinement
Powder X-ray diffraction analysis is a powerful method for characterizing phases
21
by using Nelson-Riley extrapolation method or by combination of the internal standard
and Rietveld refinement.
The high temperature sealed stage was built to keep samples from dehydration
while observing the superprotonic phases of solid acid compounds. Figure 2.9 shows the
actual setup of the stage. In this system, the sample is sealed and the chamber wall is
heated to around 150 °C. A drop of water is placed inside the chamber and the water
evaporates, providing humidity. The inside gas pressure is controlled by a check valve so
as not to exceed 1.2 atm. The sample is heated separately from the chamber by an
embedded heater in the stage.
Figure 2.9. The actual setup of the high temperature sealed stage for XRD.
2.6.1 Nelson-Riley extrapolation method5
The main cause of peak shifts in XRD profiles is sample displacement which is
22
Figure 2.10. The relation of the sample displacement and the error in the angle
The error of the plane distance Δd which is obtained from each peak location 2θ is expressed by Nelson-Riley equation as Equation (4).
2 2 cos sin cos K d d (4)
Where K is constant value which is corresponding to Δx. The contents of the parentheses in Equation (4) are called the Nelson-Riley parameter. Figure 2.11 shows an example of a
plot of the lattice parameter obtained from the peaks of an actual measurement for a cubic
structured compound. In this method, the extrapolation to zero for Nelson-Riley
parameter gives the true lattice parameter. Usually, the smaller 2θ gives the scattered
value against the fitting line. Therefore, the peaks which are located in larger 2θ value
than 60° are very important. If the sample does not have a cubic structure, it is necessary
to pick specific peaks to obtain each parameter. The number of such peaks is not large
23
Figure 2.11. Extrapolation of measured lattice parameters using the Nelson-Riley method6
2.6.2 Internal standard
By addition of a compound with a well-known lattice parameter into the sample,
the experimental errors of the angle can be corrected using the peaks from the known
compound. Si, SiO2 or Al2O3 are commonly used for this purpose as internal standard
materials. The requirements for internal standard materials are:
Minimum overlap of peaks from the internal standard with those of sample
Low number of the peaks
No reaction between the standard material and sample
In this work, Si is used as internal standard with CsH2PO4 and related compounds. No
reaction between Si and samples were observed at the measurement temperature
(~300°C).
2.6.3 Rietveld refinement
Rietveld method is used to refine the structure by finding the parameters which
24
the lattice constants of solid acid phases were obtained by this method using RIETAN-FP
software7. The parameters which were refined by this method are shown in Table 2.2.
Table 2.2. The parameters which are refined using Rietveld method
Description Parameters Note
lattice parameters a, b, c, β a = b = c, β = 90° for cubic scale factors s
FWHM parameters u, v, w
mixing parameters eta1, eta2, eta3, eta4 asymmetry a0, a1, a2
scale factors s
background b0, b1, b2, b3, b4, b5, b6 peak shift parameter t0, t1, t2, t3
atomic parameters occupancy, g
coordinate, x, y, z
isotopic atomic displacement, B11,
B12, B13, B22, B23, B33
B11 = B22 = B33,
B12 = B13 = B23 = 0 for cubic
Since the peak intensities of XRD profiles of superprotonic phases in the large angle
region (2θ > 60°) are very small, internal standard method was adopted in order to obtain the precise lattice constants. When lattice parameters of one of the phases are known,
reasonable values of the peak shift parameters can be determined because the peak shift
parameters and the lattice constants are not independent. In this study, Si powder was
used in samples as the internal standard. The fixed values are used for all Si phase
parameters except for the scale factor in the calculations. The reported value is applied
for the Si lattice constant at each temperature. The other parameters for Si phase are
determined from independent measurements at each temperature. The atomic coordinate,
x, y, z for O atoms is restricted to be the distance which between P and O atoms is equal
25
Bibliography
1 Price, D., www.sump4.com/downloads/TGA.ppt
2 Netzsch,
http://www.benelux-scientific.be/fileadmin/user_files/pdf/workshop_netzsch2009/intro_to_thermal_analysis.p df
3 Bunjes, H. & Unruh, T. "Characterization of lipid nanoparticles by differential scanning calorimetry, X-ray and neutron scattering". Advanced Drug Delivery Reviews 59,
379-402, (2007).
4 Haile, S. M., Chisholm, C. R. I., Sasaki, K., Boysen, D. A. & Uda, T. "Solid acid proton conductors: from laboratory curiosities to fuel cell electrolytes". Faraday Discussions 134, 17-39, (2007).
5 Cullity, B. D. ELEMENTS OF X-RAY DIFFRACTION 3rd edition. 326 (1956).
6 Yoshio Waseda, E. M., Kozo Shinoda. X-Ray Diffraction Crystallography: Introduction, Examples and Solved Problems. (2011).
26
Chapter 3
Dehydration-hydration of CsH
2PO
413.1. Introduction
Under sufficient humidification, the compound CsH2PO4 transforms at 228 °C
and 1 atm total pressure to a stable, cubic phase of high conductivity, recognized as the
superprotonic phase. The conductivity in the superprotonic state renders CsH2PO4 an
attractive material for fuel cell and other electrochemical applications 2. As discussed in a
recent overview of the literature regarding the high temperature properties of CsH2PO4,
some have suggested that the jump in conductivity at the purported transition is an
artifact of dehydration, but the evidence in favor of a polymeric transformation is
overwhelming 3. Essential to the observation and utilization of the superprotonic phase is
the application of sufficient humidity so as to prevent the dehydration that otherwise
occurs under ambient levels of humidification above the transition temperature 2. Several
recent studies have appeared describing the dehydration thermodynamics and kinetics of
CsH2PO4. The first semi-quantitative study was that of Boysen 2 who reported the
dehydration temperature of CsH2PO4 at selected water vapor pressures (over the T and
O H2
p ranges 205~280 °C and 0.01~0.35 atm, respectively) by detecting, in closed
chamber cells, small humidity increases resulting from dehydration. Taninouchi et al.
determined the dehydration temperature through a combination of thermogravimetric
analysis and conductivity measurements at HO 2
p = 0.008 ~ 0.4 atm 4-6. At temperatures
below 265 °C and water partial pressures below 0.22 atm, CsH2PO4 was observed to
undergo direct dehydration to the solid product CsPO3. At higher pH2O and intermediate
27
(CsH2(1-x)PO4-x(l) with x close to 0.4 but dependent on pH2O) was detected. Thus, a triple
point corresponding to the three-phase equilibrium between CsH2PO4(sp,s), CsH2(1-x)PO
4-x(l), and CsPO3(s) was observed at T = 265 °C and pH2O= 0.22 atm.
While these studies have revealed the general features of the T- HO 2
p phase
behavior of CsH2PO4, several aspects remain unresolved. For example, under high
humidity conditions, as reported by Taninouchi et. al. 6, different values for dehydration
temperatures were obtained from thermogravimetric and conductivity measurements.
Furthermore, the phase stability in the near vicinity of the triple point has not been fully
clarified. Because the dehydration kinetics of CsH2PO4 are extremely slow (even the
solid-solid dehydration remains undetectable by TG for as long as 20 hours under
isothermal, isobaric conditions 4), it is plausible that in such experiments equilibrium was
not attained and is responsible for the differences, despite the fact that the results were
extrapolated to zero heating rates. Kinetic effects are expected to be particularly acute for
high-humidity, fixed-heating-rate experiments that traverse the liquid phase, due to
sample consolidation by capillary forces generated by the presence of the liquid and the
concomitant loss of surface area. In the present work we re-examine the thermodynamics
and kinetics of dehydration of CsH2PO4 by thermal analysis. The measurements are
facilitated by the use of high-surface-area silica as an additive to enhance the overall rates
of the process and ensure access to thermodynamic behavior. The rehydration behavior of
CsPO3, which sheds light on both thermodynamic and kinetic properties of this system, is
28
3.2. Experimental details
Polycrystalline powders of CsH2PO4 were prepared by combining the starting
reagents of Cs2CO3 (Alfa Aesar, 99.99%) and H3PO4 (ACS, 85% w/w aqueous solution)
in a molar ratio of 1:2 in aqueous solution. Rapid precipitation of CsH2PO4 was induced
by injecting the solution into methanol, yielding material with a particle size of ~ 10 m.
The CsH2PO4 was then combined with 20 wt % amorphous silica powder (Alfa Aesar,
S.A 330-410, 325 mesh) and homogenized by mechanical agitation. For
thermogravimetric (TG) experiments, the composite was used in loose powder form,
whereas for differential scanning calorimetry (DSC) experiments, the powder was lightly
pressed into solid compacts (~ 85% theoretical density) using a uniaxial press. Selected
experiments were further performed using cesium metaphosphate, CsPO3, the preparation
of which is described below along with the associated measurements.
Microstructural features were observed by scanning electron microscopy (LEO
1550 VP FESEM). The accelerating voltage was 10 kV. The phase structure was
determined by Rietveld refinement from X-ray powder diffraction (Philips X’Pert Pro,
CuK radiation).
Thermogravimetric (TG) analysis was carried out using an in-house-constructed
system, the operation of which is discussed in detail elsewhere 4. In brief, the sample is
placed on a glass container incorporating a thermocouple junction (Type E) which, in
turn, is hung from a balance (Mettler Toledo AL54) into a humidified oven that also
incorporates a humidity sensor. The accessible water partial pressure and temperature
29
0.04 ºC, respectively. The mass resolution of the system is 0.1 mg, implying for a
typical sample weight of 130 mg a relative resolution of 0.08%.
Heat flow measurements were carried out using a second, in-house-constructed
system, shown schematically in Figure 3.1. The sample and reference containers are
placed on an Al heat sink holder incorporating Pt resistance temperature devices (RTD).
The resistances of the two RTDs are measured by a multimeter (KEITHLEY 2420) and
converted to temperature values. The difference between the two is converted to heat
flow, calibrated using melting enthalpy of pure Sn (7.03 kJ/mol) at its normal melting
temperature 231.9 ºC. Humid N2 gas is introduced to the chamber and humidity is
observed by humidity sensor (rotronic Hygrolab). The accessible temperature and water
partial pressure ranges are, respectively, 0.02~0.90 atm and 100~400 ºC, with stabilities
of 0.01 atm and 0.01 ºC, respectively. The heat flow resolution of the system is 0.05
mW. For a typical heating rate of 0.5 ºC/min and a typical sample weight of 63 mg, the
resolution for the thermal signature was 0.02 J/g. For both TG and DSC measurements,
the actual rather than nominal HO 2
30
Figure 3.1. The schematic diagram of the in-house-constructed DSC chamber: (a) expanded view of sample region with integrated RTDs (resistant temperature device), and (b) overview of the entire system including the chamber, humidity generator, and humidity sensor
3.3. Results and discussion
3.3.1. Interaction of CsH2PO4 with SiO2
Figure 3.2 shows XRD patterns of the products of dehydration of (a) neat
CsH2PO4 powder and (b) CsH2PO4 with silica, as well as (c) the product of rehydration of
the dehydrated composite of (b). While the specific method of dehydration did not impact
phase behavior or the resulting morphology, we note that in this case dehydration of neat
CsH2PO4 was achieved by exposure to pH2O= 0.02 atm at 320 ºC, whereas the composite
product was obtained after several heating and cooling process under high humidity
conditions ( HO 2
31
product of the composite that corresponds to silica. The pattern of (a) is furthermore
identical to that obtained previously by Taninouchi et al. 4 for the complete dehydration
of CsH2PO4. In light of the observed weight loss, this product is identified as CsPO3,
despite differences from the ICDD reference pattern attributed to this material 7,8. Upon
rehydration, the phosphate phase in the composite reverted to CsH2PO4, with lattice
constants, as determined by Rietveld refinement, Table 3.1, matching the literature values
of CsH2PO49. These results indicate that CsH2PO4 does not react with silica during either
dehydration or rehydration.
Figure 3.2. XRD profiles of (a) the dehydration product of neat CsH2PO4 powder, (b) the
dehydration product of composite CsH2PO4 and silica, and (c) the rehydration product of (b).
32
Table 3.1. Lattice constants of CsH2PO4 as measured post thermal cycling in the presence of SiO2, compared to standard literature values
Material a (Å) b (Å) c (Å) (°)
Rehydrated CsH2PO4 + silica 7.9032(6) 6.3889(4) 4.8763(3) 107.650(4)
CsH2PO4 [10] 7.90065(8) 6.36890(9) 4.87254(12) 107.742
Scanning electron microscopy images of the dehydration products are shown in
Figure 3.3, where (a) corresponds to a composite sample, and (b) to a sample of CsH2PO4
alone. It is immediately apparent that the neat phosphate forms large particles of CsPO3
that are several tens of microns in diameter. In contrast, the composite retains submicron
feature sizes, with typical grains of CsPO3 that are ~ 200 nm in diameter and reasonably
well separated in the porous, composite structure.
Figure 3.3. Scanning electron microscopy images obtained in secondary electron mode of (a) the
dehydration product of composite CsH2PO4 and silica and (b) of neat CsPO3
3.3.2. General dehydration characteristics and data analysis methodology
Typical isobaric gravimetric and differential calorimetry curves for CsH2PO4 in
both the presence and absence of SiO2 are presented in Figures 3.4 and 3.5, where the
former corresponds to humidity conditions falling below the triple-point and the latter to
33
the dehydration behavior under different heating rates and different water partial
pressures, and the role of SiO2. The most significant features of the data collected at low
humidification ( HO 2
p ~ 0.25 atm) are as follows. At sufficiently low heating rates, e.g.,
0.01 and 0.1 K/min [Figures 3.4(a) and (b)], the composite samples undergo a single-step
dehydration, with an onset designated Td. At higher heating rates, e.g., 0.5 K/min, the behavior of the composite changes, undergoing a two-step dehydration reaction that
extends over a broader temperature window. The neat CsH2PO4 displays extremely slow
dehydration kinetics and even at a low heating rate of 0.1 K/min, the data suggest a
complex, multistep process that reaches completion only upon exposure to high
temperature for prolonged times. Irrespective of the duration and pathway of dehydration
or the presence or absence of SiO2, however, the final product obtained at the completion
of the reactions by 360 ºC corresponds, by weight, to CsPO3. Thus, the introduction of
SiO2 has the effect of greatly enhancing kinetics without modifying the thermodynamic
outcome of the dehydration reaction, consistent with the diffraction data analysis and
34
Figure 3.4. Typical dehydration behavior of CsH2PO4 below the triple point: (a)
thermogravimetry (TG) profile of composite and neat CsH2PO4 at pH2O = 0.26 atm at the heating rates indicated. (b) Differential weight loss curves corresponding to the profiles in part (a). (c) Dependence of observed dehydration temperature in composite samples on heating rate. (d)
Differential scanning calorimetry (DSC) curve at pH2O = 0.27 atm and a heating rate of 0.5 K/min.
The data in Figure 3.4 further reveal that the onset of the dehydration reaction at
low humidity is largely independent of heating rate and of the presence or absence of
silica. For the example of HO 2
p = 0.26 atm indicated in the TG data, the onset temperatures
vary by just 0.7 ºC, from 257.2 to 257.9 ºC. The thermal significance of this dehydration
is clearly captured in the DSC data, Figure 3.4(d), with a Td that matches the TG results. The DSC curve (collected from a composite sample at a heating rate of 0.5 K/min)
further displays an anomaly with an onset at 228 ºC due to the polymorphic transition to
the cubic phase. The data unequivocally demonstrate (as has been shown previously in
the literature) that this transition is not connected to dehydration as weight loss under
35
enthalpy recorded is 11.7 ± 1.1 kJ/mol, consistent with the values summarized in
reference 3 and validating the calibration of the heat signal. The TG data for the same
sample type and experimental conditions, shown in differential form in Figure 3.4(b),
indicate that the second dehydration step is relatively well defined, with an onset of ~ 280
ºC, but that the signal is barely detectable by DSC. The composite sample is considered
to be out of equilibrium at a heating rate of 0.5 K/min and thus the nature of this second
dehydration was not further investigated.
Figure 3.5. Typical dehydration behavior of CsH2PO4 above the triple point: (a)
Thermogravimetry (TG) profile of composite and neat CsH2PO4 at pH2O = 0.64 atm at the heating
rates indicated. (b) Differential weight loss curves corresponding to the profiles in part (a). (c) Dependence of observed dehydration temperature in composite samples on heating rate. (d)
Differential scanning calorimetry (DSC) curve at pH2O = 0.60 atm and a heating rate of 0.5 K/min
The dehydration behavior of CsH2PO4 under high humidification conditions,
Figure 3.5, shows both differences and similarities to that under low humidification. The
36
the dehydration process occurs in two distinct and well-resolved steps. An initial sharp
weight change is followed by a slight, monotonic weight loss (a sloping plateau in the TG
plot), and then a second, sharp weight change. Thus, as suggested by Taninouchi 4, an
intermediate phase of variable H2O content is stable at high pH2O and intermediate
temperatures. The magnitudes of the weight changes reveal that the intermediate phase
has a composition CsH2(1-x)PO4-x with an initial, low-temperature x value of 0.33 and a final, high-temperature value of 0.4 ~ 0.5, depending on heating rate. All samples that
displayed this two-step dehydration process emerged from the experimental TG apparatus
as densified, almost glassy compacts, whereas those that displayed only a single-step
process remained in the form of loose powders, suggesting, in agreement with the
observations of Taninouchi, that the intermediate phase is a liquid.
Close examination of the data in Figures 3.5(a) and (b) reveals that, amongst the
composite samples, the onset of the first dehydration event, Td1, is independent of heating rate for rates between 0.01 and 0.5 K/min (occurring in this case at 284.0 ± 0.2 ºC). As in
the low humidity experiments, the absence of SiO2 greatly decelerates the overall kinetics.
The effect is so significant here, however, that the onset of this first dehydration event is
retarded by 5 to 6 ºC. Turning to the second dehydration step, the data reveal that not
only is this process sensitive to the nature of the sample, it is highly sensitive to heating
rate, unlike the first dehydration step. Specifically, the apparent onset temperature, Td2, shifts to increasingly higher values with increasing heating rate, dT/dt = R. Such behavior, also observed by Taninouchi 6, suggests that the dehydration of CsH
37
onset of dehydration, the observed Td2 values were plotted against R½, Figure 3.5(c), and extrapolated to R = 0. The DSC data, Figure 3.5(d), reveal clear thermal events associated with the superprotonic transition (with an onset value again of 228 ºC), and the first
dehydration event, with Td1 = 278.3 ºC, at a temperature generally consistent with the TG data. Reminiscent of the low humidity data, however, the second dehydration event is
barely detectable in the DSC profile. Such behavior is consistent with a kinetically
constrained reaction for which heat release is too gradual to be recorded as a thermal
anomaly.
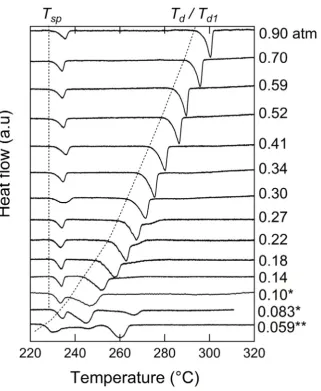
With the overall dehydration characteristics understood, the behavior of CsH2PO4
over a wide range of water partial pressures was explored. From the discussion presented
above, the dehydration reactions of interest are
(A) CsH2PO4 s,sp ↔CsPO3 s H2O g (1)
(B) CsH2PO4 s,sp ↔CsH2 1-xi PO4-xi l xiH2O g (2)
(C) CsH2 1-xf PO4-xf l ↔CsPO3 s xfH2O g (3)
where xi and xf reflect the respective stoichiometries of the intermediate liquid phase when it is first formed and then finally consumed during heating. The TG experiments
can detect all three of these dehydration steps and were performed using composite
samples at water partial pressures between 0.26 and 0.76 atm and a fixed heating rate of
0.01 K/min. At this slow heating rate the onset temperatures of Reactions (A) and (B) are
accurately obtained from TG data, whereas the overestimation of Td2 (Reaction C) is less than 3 ºC. The DSC measurements can detect Reactions (A) and (B) as well as the
38
rate. Measurements were performed at 0.5 K/min over the water partial pressures range
of 0.06 atm to 0.90 atm. To ensure accurate positioning of the triple point, measurements
in the HO 2
p range of 0.29 to 0.42 atm were repeated multiple times (and results confirmed
to be reproducible). At low humidities, at which dehydration would be expected to occur
at the lowest temperatures, additional isothermal gravimetric measurements were carried
out using partially dehydrated samples (composed of CsH2PO4, CsPO3, and SiO2) at
conditions in the near vicinity of the low temperature phase boundary of Reaction (A). It
was anticipated that the presence of both phosphate phases would overcome any
nucleation barrier and hence aid the transformation kinetics.
For each individual, constant ramp-rate measurement, the decomposition
temperature was defined as the onset of the thermal event, as implied through-out the
preceding discussion. In the case of the DSC profiles, a numerical procedure described in
detail elsewhere 10 was employed to precisely establish this onset. In the case of the TG
profiles, the onset was determined from the dTG plots by evaluating the intersection
between the baseline and the tangent of the dTG peak. Overall, it is to be emphasized that
the presence of SiO2 in composite samples here is believed to allow rapid access to
thermodynamic conditions, and for this reason is an advance over previous studies of
dehydration behavior.
3.3.3. Thermodynamics of dehydration
The TG and DSC data obtained from composite samples over the wide range of
conditions explored are presented in Figures 3.6 and 3.7, respectively. In agreement with
the discussion above, at low humidities ( HO 2
p < 0.5 atm) a single-step dehydration process
39
the dehydration generally shifts to higher temperatures with increasing HO 2
p , as evidenced
in both datasets. At HO 2
p = 0.10 and 0.083 atm the DSC peak due to dehydration overlaps
with that due to the superprotonic transition, and the dehydration temperature for these
conditions were not evaluated further. Moreover, at HO 2
p = 0.083 and 0.059 atm, an
additional thermal event at a temperature beyond the initial dehydration is evident in each
profile. This is believed to be due to the crystallization of amorphous CsPO3 and is not
considered further.
Figure 3.6. Weight change behavior of CsH2PO4 (in composite form with SiO2) at a heating rate
40
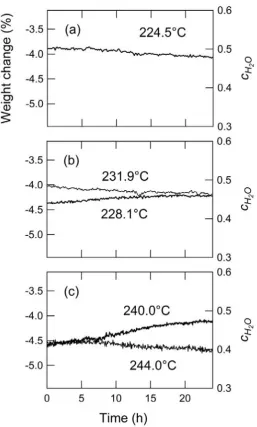
41
Figure 3.8. Isothermal weight change behavior of composite samples of CsPO3, CsH2PO4, and
SiO2 at (a)pH2O = 0.09 atm. (b) pH2O = 0.13 atm, and (c) pH2O = 0.18 atm.
The isothermal weight change results under low HO 2
p conditions, 0.09, 0.13 and
0.18 atm, are presented in Figure 3.8. The results reveal that at HO 2
p = 0.13 atm the phase
boundary occurs between 228.1 and 231.9 °C, whereas at HO 2
p = 0.18 it shifts to a
temperature between 240 and 244 °C. In contrast, the raw DSC curves, obtained under
42
for these two atmosphere conditions (Figure 3.7). From the HO 2
p = 0.09 atm data, it is
evident that the phase boundary lies somewhere below 225 °C, a temperature
significantly lower than what has been previously suggested in the literature. The results
thus further demonstrate that extremely long times are required to observe the
equilibrium weight change behavior. While the change in weight is extremely gradual in
these datasets (0.0202 to 0.0234 mg/hr), the change is statistically greater than the
43
Figure 3.9. The –T pH2Ophase diagram of CsH2PO4(a) in the vicinity of the triple point as determined in this work and (b) over a broader range of conditions, and shown in comparison with previous determinations of the phase boundaries. Red line (between the liquid and cubic
regions) corresponds to reaction B, blue (between the liquid and CsPO3regions) to reaction C,
green (between cubic and CsPO3regions) to reaction A above the superprotonic transition, and
black (between monoclinic and CsPO3regions) to reaction A* below the transition.
From the data of Figures 3.6-3.8, the dehydration temperature of CsH2PO4 as a
function of HO 2
p was determined and the results were compiled to yield the phase
diagram presented in Arrhenius form in Figure 3.9. Part (a) shows just the results of the
present work and part (b) a comparison with literature data over the water partial pressure
range HO 2
p = 0.05 ~ 0.90 atm and temperature range 215 to 320 °C. The general features