Lane, Mark
Using the AC Drive Motor as a Transducer for Detecting Electrical and Electromechanical Faults
Original Citation
Lane, Mark (2011) Using the AC Drive Motor as a Transducer for Detecting Electrical and
Electromechanical Faults. Masters thesis, University of Huddersfield.
This version is available at http://eprints.hud.ac.uk/id/eprint/10167/
The University Repository is a digital collection of the research output of the
University, available on Open Access. Copyright and Moral Rights for the items
on this site are retained by the individual author and/or other copyright owners.
Users may access full items free of charge; copies of full text items generally
can be reproduced, displayed or performed and given to third parties in any
format or medium for personal research or study, educational or notforprofit
purposes without prior permission or charge, provided:
•
The authors, title and full bibliographic details is credited in any copy;
•
A hyperlink and/or URL is included for the original metadata page; and
•
The content is not changed in any way.
For more information, including our policy and submission procedure, please
contact the Repository Team at: [email protected].
Using the AC Drive Motor as a Transducer for Detecting
Electrical and Electromechanical Faults
Master of Science by Research
Student: Mark Lane
Supervisors: Dr Crinela Pislaru
Professor Andrew Ball
Dr Fengshou Gu
January 2011
University of Huddersfield
Contents
Page
Abstract iv
Acknowledgements v
List of symbols vi
List of figures viii
List of tables xi
List of tables xi
Nomenclature xii
Chapter 1 Introduction 1-13
1.1 Research aims ... 1-2
1.2 Research objectives ... 1-2
1.3 Overview of thesis ... 1-3
Chapter 2 Literature review 2-4
2.1 Fault detection methods on motors using motor current signature analysis (MCSA)
... 2-4
2.2 Fault Detection using motor Instantaneous Angular Speed analysis (IAS) ... 2-6
2.3 Fault detection methods on inverter systems ... 2-6
2.4 Model-based condition monitoring ... 2-8
2.5 Fault detection using vibration analysis and advanced networks ... 2-9
Chapter 3 Theoretical aspects related to inverter-driven motor systems 3-11
3.1 Inverter Systems ... 3-11
3.1.1 Electric drive block diagram ... 3-12
3.1.2 Six-step VSI Inverter ... 3-13
3.1.3 PWM inverter ... 3-16
3.1.4 Sensorless Vector Drive Technology ... 3-17
3.1.5 Sensorless Flux-vector drive technology ... 3-18
3.1.6 Closed-loop flux-vector drive with field-orientated control ... 3-19
3.2 AC Motors (actuators)... 3-20
3.2.1 AC motor equivalent circuit and equations ... 3-27
3.2.2 AC motor mathematical model ... 3-29
4.2 Test rig specification ... 4-33
4.3 Electrical Drive Specification ... 4-34
4.4 Test Rig Panel Equipment ... 4-36
4.5 Test Rig Panel ... 4-44
4.6 External Test Rig Equipment ... 4-46
Chapter 5 Improvement of experimental test rig performance by changing its configuration
5-53
5.1 Test Rig Modifications – Automation ... 5-53
5.1.1 Equipment used to automate the test rig - PLC ... 5-55
5.1.2 Example PLC Program operation ... 5-57
5.1.3 Test Rig PLC and operator screen ... 5-58
5.1.4 Test rig PLC control strategy ... 5-60
5.2 Test Rig Modifications – Closed-loop operation ... 5-61
5.3 Commissioning the test rig ... 5-62
5.4 Performance improvements ... 5-63
Chapter 6 Monitoring procedures for inverter-driven motor systems 6-64
6.1 Introduction to monitoring procedures ... 6-64
6.2 Motor fault detection ... 6-65
6.2.1 Motor supply ... 6-67
6.2.2 Motor speed ... 6-73
6.2.3 Motor vibration ... 6-74
6.2.4 Motor acoustic emissions ... 6-75
6.3 Inverter Fault Detection ... 6-75
6.3.1 Incipient Fault Diagnosis in Electrical Drives by Tuned Neural Networks ....
6-77
6.3.2 Fault Diagnostics in an Inverter Feeding an Induction Motor ... 6-80
6.3.3 Fault Detection of 3-Phase VSI using Wavelet-Fuzzy Algorithm ... 6-83
Chapter 7 Fault diagnosis of experimental inverter-driven motor system 7-85
7.1 Introduction ... 7-85
7.2 Data Acquisition System ... 7-85
7.3 Measurement of experimental data for healthy and faulty gearbox ... 7-89
Chapter 8 Conclusions and further work 8-102
8.1 Review of Objectives ... 8-102
8.2 Conclusions ... 8-104
8.3 Contributions to Knowledge and Understanding ... 8-106
8.4 Future work ... 8-106
8.4.3 Improvement of measured inverter signals ... 8-108
8.4.4 Combining inverter and motor condition monitoring ... 8-109
8.4.5 Incorporating fault detection algorithms into existing automation/drive equipment
8-109
8.4.6 Validating the fault detection algorithms ... 8-110
References 8-111
Appendix A Gearbox Test Rig Modifications 8-2
A.1 Test rig modifications – mechanical and electrical works ... 8-2
A.2 Data acquisition system – modifications ... 8-5
Appendix B PLC Program detail and Memory allocation 9-6
B.1 PLC Program design ... 9-6
B.1.1 PLC Program Structure ... 9-7
B.1.2 Operator screens ... 9-15
Appendix C Commissioning tests 10-2
C.1 Test and calibration ... 10-2
C.2 PLC program verification ... 10-5
C.3 Tests to verify the automated test rig results ... 10-5
C.4 Actual Test Rig Operation Screenshots ... 10-23
Abstract
Condition monitoring of AC motors is a subject area that has received extensive research. Whether this
monitoring is carried out on a scheduled basis by engineer intervention, or continuously using an on-line unit, the
results of this testing enable preventative maintenance work to be a carried out earlier, before any major failure
occurs. Monitoring using vibration analysis is the most common and depending on the plant, can be done once
or twice a year. This is usually limited to the condition of motor bearings and is not commonly used to detect
failures in the motor electromagnetic systems. Monitoring units that use motor current measurements are also
available, but these are less widely-used and usually on major plant motors (>250kW for example) that have a
large capital outlay to replace.
The industry drivers – as always – are maximum plant and machinery uptime, with the minimal amount of
scheduled maintenance. If maintenance is carried out too regularly, costs rise significantly not only due to the
maintenance activity itself, but disruption to production schedules. Maintenance schedules that are too infrequent
can result in an unacceptable rise in total failures of plant that are unexpected and may cause a significant
amount of production disruption and downtime, especially if this occurs during out-of-hours working time.
However, industry now faces another big challenge and one that has had a good share of exposure over the last
few years. It is of course, the drive to reduce carbon emissions and with it the amount of energy that a plant itself
consumes. What has brought this more to the fore recently is the significant rise in energy costs. Whilst product
margins have to remain the same, many companies energy costs have seen a two to three-fold increase in
energy budgets in the last few years alone. For industry processes that have a significant amount of fan and
pump applications, the manufacturers of low-cost AC inverters have saturated the lower-performance market of
inverter drives such that any drive can control these type of fan and pump applications, where accurate speed
control is not a major driver.
Unfortunately, this can be a step backwards for end-users of plant that use equipment to monitor motor condition
via motor current signals. Additionally, vibration analysis that relies upon ‘base-lining’ motor data when the AC
motor is running at base speed may not give accurate readings when the motor is under inverter control and
running at a different speed.
For manufacturers of AC inverter drives in this low-end market, it can be difficult to sell a product from one
manufacturer over another without the unit having a “USP”, or Unique Selling Proposition. Most decisions taken
on inverter equipment purchase at this level are usually in favour of the equipment that costs the least to
purchase. Credibility of manufacturers based on product history and perceived reliability cuts little ground with an
ever cost-conscious industry.
This is where the research into diagnosis of faults on inverter driven motor systems can provide just this USP for
manufacturers. If the incorporation of on-line diagnosis for simple inverter applications can be brought to a
typical inverter unit at a reasonable cost, the manufacturer who can offer this gains a unique foothold in the
marketplace – a drive that can monitor and signal that the motor it is driving is showing signs of early failure.
It will be sensible to limit this research to simple inverter applications as high-end inverter drives that operate
equipment such as high-speed printing presses, rotary shears will be more difficult to model and simulate than a
fan or pump application.
It is hoped that a typical inverter drive can relay enough detailed information about the load which it is driving to
equipment. If this can be done without major modification to an inverter, then it may be easier to implement in
equipment offered by different manufacturers.
It is quite possible that this technology could be licensed under a name that guarantees the performance of the
condition monitoring algorithms and reliability from one drive manufacturer to another.
Acknowledgements
I would sincerely like to thank Professor Andrew Ball for his assistance in starting this research project as well as
for his guidance along the way. I would also like to thank Dr. Fengshou Gu and my Director of Studies Dr.
Crinela Pislaru who’s assistance was invaluable in progressing the research.
An additional thanks to my Father, John Lane for his help in modifying the rig on-site and my mother for her
List of symbols
AC Alternating Current
AFD Adjustable Frequency Drive
ANN Artificial Neural Network
ASL Above Sea Level
BNC Bayonet Neill-Concelma (Type of connector, commonly used in Radio Frequency
applications)
BP BackPropagation
CMMS Computerized Maintenance Management System
CSI Current Source Inverter
CT Current Transformer
DAQ Data Acquisition System
DC Direct Current
DOL Direct On – Line
DSP Digital Signal Processor
DWT Discrete Wavelet Transform
EA Evolutionary Algorithms
EEPROM Electrically Erasable Programmable Read Only Memory
EPRI Electrical Power Research Institute
FFT Fast Fourier Transform
FL Fuzzy Logic
FLC Full Load Current
FLT Full Load Torque
GA Genetic Algorithm
GMM Gaussian Mixture Model
GTO Gate Turn-off Thyristor
HMI Human machine interface (operator screen for control/visualisation of a control
system)
HVAC Heating, Ventilation And Control (for building management)
IAS Instantaneous Angular Speed
IEEE Institute of Electrical and Electronics Engineers
IGBT Insulated Gate Bipolar Transistor
IP Insulation Protection; Commonly referred to as ‘IP Ratings’. Used to define the level of
protection than an enclosure offers against contact with electrical parts and its
resistance to dust or moisture.
IR IR Losses. Usually referred to in to context of : ‘DC motor IR losses’ where I = DC
motor Armature Current; R = DC motor Armature Resistance.
LAD LADder (PLC programming language format)
MCSA Motor Current Signature Analysis
MOSFET Metal Oxide Semiconductor Field Effect Transistor
MRAS Model Reference Adaptive System
NFMCSA Notch Filtered Motor Current Analysis
PC Personal Computer
PCI Peripheral Card Interface
PI Proportional Integral (used to define the terms used within a control loop. Example: ‘PI
controller’)
PID Proportional Integral Derivative (used to define the terms used within a control loop.
Example: ‘PID controller’)
PII Process Image Inputs (used in a PLC)
PIO Process Image Outputs (used in a PLC)
PLC Programmable Logic Controller
PPF Pole Pass Frequency
PPI Point-to Point Interface © Siemens AG
PPR Pulses Per Revolution (for measuring encoder resolution)
PPU Power Processing Unit
PWM Pulse Width Modulation
RAM Random Access Memory
RLS Recursive Least Square
RMS Root-Mean Squared
SCR Semiconductor /Silicon Controlled Rectifier
STL Structured Text Language (PLC programming language format)
VFD Variable Frequency Drive
VSD Variable Speed Drive
List of figures
Figure 3-1 - Block diagram of an electric drive [29] ... 3-13
Figure 3-2 - Variable Voltage Inverter (VVI) Basic Circuit Diagram [29] ... 3-14
Figure 3-3 - Six-step VSI Block Diagram [29] ... 3-14
Figure 3-4 - DC bus PI regulator diagram [30] ... 3-15
Figure 3-5 - Six-step generator diagram [30] ... 3-15
Figure 3-6 - Six-step firing pulses and motor current generated [29] ... 3-16
Figure 3-7 - PWM Inverter output switching waveform [31] ... 3-16
Figure 3-8 - PWM inverter drive output [31]... 3-17
Figure 3-9 - Sensorless Vector Block Diagram [31] ... 3-18
Figure 3-10 - Sensorless Flux Vector Block Diagram [31] ... 3-19
Figure 3-11 - Field Oriented Control Block Diagram... 3-19
Figure 3-12 - Stator core detailing winding ‘slots’ [22] ... 3-20
Figure 3-13 - Phase pole winding details [22] ... 3-20
Figure 3-14 - Rotor construction (a) – with laminations; (b) – laminations removed [22] ... 3-21
Figure 3-15 - AC Squirrel-cage motor exploded view [23] ... 3-22
Figure 3-16 - AC Motor Torque Curve ; Redrawn from original diagram [24] ... 3-24
Figure 3-17 - AC Motor torque/speed curve; Redrawn from original diagram [24] ... 3-25
Figure 3-18 - Motor efficiency vs. loading curve; Redrawn from original diagram [24] ... 3-26
Figure 3-19 - AC Equivalent Exact Circuit (one phase); Redrawn from original [25] ... 3-27
Figure 3-20 - 3-phase supply waveform [27] ... 3-29
Figure 3-21 - Magnetic Linkages and voltages; Redrawn [28] ... 3-30
Figure 4-1 - Block diagram of test rig design ... 4-31
Figure 4-2 - Actual Gearbox Test Rig ... 4-32
Figure 4-3 - Block diagram of the experimental test rig ... 4-35
Figure 4-4 - Functional Block Diagram – 690+ Inverter, Frame C [32] ... 4-38
Figure 4-5 - DC load motor diagram on the test rig ... 4-40
Figure 4-6 - Resistor bank view [34] ... 4-41
Figure 4-7 - Resistor bank internal wiring schematic [34] ... 4-42
Figure 4-8 - Test rig control panel front ... 4-45
Figure 4-9 - Test rig control panel interior ... 4-46
Figure 4-10 - View of Helical Geared motor [35] ... 4-47
Figure 4-11 - Service factor table from David Brown Catalogue (page 65) [36] ... 4-47
Figure 4-12 - Cut-away view showing DC motor field/armature circuit; Re-drawn by ML [24]... 4-49
Figure 4-13 - Shunt-type DC motor as used on test rig ... 4-49
Figure 4-14 - DC Shunt motor speed, torque, voltage relationships ... 4-50
Figure 4-15 - Shunt wound machine circuit ... 4-50
Figure 4-16 - Power flow for Motor / Generator [25] ... 4-51
Figure 5-1 - Speed and load step operation ... 5-54
Figure 5-4 - Simple PLC block diagram ... 5-56
Figure 5-5 - PLC Hardware rack block diagram ... 5-57
Figure 5-6 - PLC Program operation ... 5-58
Figure 5-7 - S7-222 PLC [37] ... 5-59
Figure 5-8 - TP177 Micro Touch-screen [38] ... 5-59
Figure 5-9 - Typical PPI network [37]... 5-59
Figure 5-10 - Step 7 MicroWIN programming software ... 5-60
Figure 5-11 - Test Rig PLC design philosophy ... 5-61
Figure 5-12 - Installing the HTTL Speed Feedback Technology Box Option [51] ... 5-62
Figure 5-13 - Single-ended encoder wiring [51] ... 5-62
Figure 6-1 - Spectra of vibration and current signatures (0 -100 Hz) at 5.625 KW with no defects [3] ... 6-72
Figure 6-2 - Original and Notch-filtered current signals – healthy motor [4] ... 6-73
Figure 6-3 - Siemens Masterdrives Inverter Unit [47] ... 6-76
Figure 6-4 - Classification of common fault types [10] ... 6-78
Figure 6-5 - Block diagram of an AC drive with highlight on the measurement location and processing flow [10]6-79
Figure 6-6 - Comparison between expected validation outputs and predicted [10] ... 6-80
Figure 6-7 - Fuzzy logic fault diagnostics system [10] ... 6-81
Figure 6-8 - A voltage-fed PWM inverter system indicating the possible failure modes [14]... 6-82
Figure 6-9 - Inverter voltage spectra: (a) healthy case (b) one switch open (c) one switch short [14] ... 6-83
Figure 6-10 - A PWM voltage-fed inverter of induction motor (a) and after fault occurrence (b) [14] ... 6-84
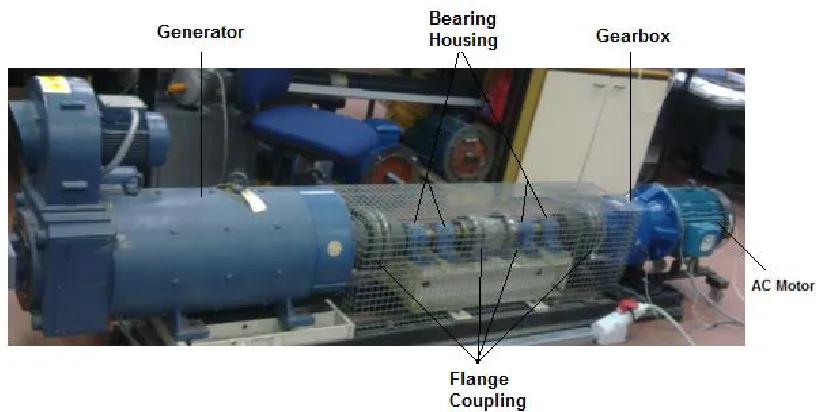
Figure 7-1 - Setup for experimental gearbox test rig ... 7-86
Figure 7-2 - Mounting of motor encoder ... 7-86
Figure 7-3 - Three-phase current measuring unit ... 7-87
Figure 7-4 - Diagram of three phase measurement unit... 7-88
Figure 7-5 - Diagram of measured signals ... 7-88
Figure 7-6 - Screenshot of measured signals ... 7-89
Figure 7-7 - Screenshot of operating status through 'dashboard' ... 7-89
Figure 7-8 - Simulation plots colour key ... 7-90
Figure 7-9 - Measured data for healthy gearbox – Test number 1 ... 7-91
Figure 7-10 - Comparing motor torque (a) vs. armature current (b) ... 7-92
Figure 7-11 - Measured data for healthy gearbox – Test number 2 ... 7-92
Figure 7-12 - Measured data for faulty gearbox – Test number 3 ... 7-93
Figure 7-13 - Measured data for faulty gearbox – Test number 4 ... 7-94
Figure 7-14 – Comparison of experimental data for Test number 1 and Test number 3 ... 7-95
Figure 7-15 - Comparison between the actual AC motor phase currents ... 7-96
Figure 7-16 - Measured current signals for healthy and faulty gear set ... 7-97
Figure 7-17 - Experimental Test Rig System ... 7-97
Figure 7-18 - Model reference system used for data analysis ... 7-97
Figure 7-19 - Comparison of torque feedback values from drive measured between a healthy and faulty gear set7-98
Figure 7-20 - Comparison between actual motor current signals for healthy and faulty gears... 7-100
Figure B-2 - Test rig panel exterior before and after modification ... 8-3
Figure B-3 - Test rig panel interior before and after modification ... 8-4
Figure B-4 - Diagram showing additional test rig signals ... 8-5
Figure B-5 - D-Type connector wiring for Data Acq. system (Optima Drawings) ... 8-5
Figure B-1 - PLC Program structure ... 9-8
Figure B-2 - Main Sequence (SBR0) ... 9-9
Figure B-3 - Subroutine SBR0 LAD network and symbols used ... 9-10
Figure B-4 - SBR2 Speed Sequence Diagram; State 2 ... 9-11
Figure B-5 - Speed (SBR2) and Load (SBR4) state diagrams ... 9-12
Figure B-6 - Ramp function block ... 9-13
Figure B-7 - Ramp change calculation block ... 9-13
Figure B-8 - PLC Program Symbol Table for Test Rig Program (screenshot from S7-MicroWIN software) ... 9-14
Figure B-9 - Main Operator Screen ... 9-15
Figure B-10 - ‘Set-up’ Screen ... 9-16
Figure B-11 - ‘Recipe Screen 1’ ... 9-17
Figure B-12 - Trending Display Screen... 9-17
Figure C-1 - Field controller (maximum current potentiometer arrowed) ... 10-3
Figure C-2 - Analogue output scaling blocks [50] ... 10-6
Figure C-3 - 690+ Analogue output scaling function [50] ... 10-6
Figure C-4 - 690+ Drive 'Feedbacks' Block [50] ... 10-6
Figure C-5 - ‘Wiring’ of inverter Feedbacks block to physical analogue outputs ... 10-7
Figure C-6 - Rig test 1a; 100% speed, varying load ... 10-9
Figure C-7 - Rig Test 1b; 100% speed, varying load ... 10-10
Figure C-8 - Rig Test 1c; 100% speed, varying load ... 10-11
Figure C-9 - Comparing AC inverter current feedback to actual measured instrument values ... 10-12
Figure C-10 - Commissioning Test 2; 30% load; Speed incremental steps ... 10-13
Figure C-11 - Commissioning Test 3; 60% load; Speed incremental steps ... 10-14
Figure C-12 - Commissioning Test 2; 30% load; Speed incremental steps ... 10-15
Figure C-13 - Commissioning Test 5a; 100% Load, Speed ramped 0 -100% ... 10-16
Figure C-14 - Commissioning Test 5a; 100% Load, Speed ramped 0 - 100% ... 10-17
Figure C-15 - Commissioning Test 5a; 100% Load, Speed ramped 0 - 100% ... 10-17
Figure C-16 - Repeat of Commissioning Test 5a; 100% Load, Speed ramped 0 - 100% ... 10-18
Figure C-17 - Test run 5c; Autotune performed ... 10-19
Figure C-18 - AC Motor no-load motor torque/speed plot ... 10-20
Figure C-19 - Test 7; verification of DC motor loading ... 10-21
Figure C-20 - Commissioning Test 8 ... 10-22
Figure C-21 - Test 8 speed response comparison of ... 10-22
Figure C-22 - Current and torque response comparisons of ... 10-23
Figure C-23 - Operator Screen; Test Rig running in Auto ... 10-24
List of tables
Table 4-1 - Gearbox Specification ... 4-33
Table 4-2 - Control transformer sizing ... 4-43
Table 4-3 - Control panel functions ... 4-45
Table 6-1 - Examples of motor failures arising from external system faults [40] ... 6-66
Table 6-2 - Component failures in motors > 50hp and <=200 hp ... 6-66
Table 6-3 - Selected inverter fault codes [47] ... 6-76
Table 6-4 - Selected inverter alarm codes [47] ... 6-77
Table 6-5 - Experimental setup settings [10] ... 6-79
Table 7-1 - Simulation data set for all healthy and faulty gear sets ... 7-90
Table 7-2 - Data plot signals and scaling factors ... 7-90
Table B-1 - PLC External Inputs ... 9-6
Table B-2 - PLC External Outputs ... 9-7
Table B-3 - Ramp function block inputs and outputs ... 9-13
Table B-4 - Operator Screen to PLC Data ... 9-18
Table B-5 - PLC to Operator Screen Data ... 9-19
Table C-1 - Main calibration parameters ... 10-2
Table C-2 - Calibration results table 1 ... 10-2
Table C-3 - Calibration results table 2 ... 10-3
Table C-4 - Calibration results table 3 ... 10-4
Table C-5 - Operator screen value scaling ... 10-4
Table C-6 - 'Feedbacks' block observation data ... 10-7
Table C-7 - Scaling of drive output data ... 10-7
Table C-8 - Data logging channels - Commissioning tests ... 10-8
Table C-9 - Commissioning Test 1a Data ... 10-8
Table C-10 - Table of load readings; Test 1a ... 10-9
Table C-11 - Commissioning Test 2 Data ... 10-12
Table C-12 - Table of load readings; Test 2 ... 10-13
Table C-13 - Table of load readings; Test 3 ... 10-14
Table C-14 - Commissioning Test 4 Data ... 10-15
Table C-15 - Commissioning Test 5a Data ... 10-15
Table C-16 - 690+ Drive Autotune Parameters ... 10-20
Table C-17 - Commissioning Test 6 Data ... 10-20
Table C-18 - Commissioning Test 7 Data ... 10-21
Nomenclature
Ea Voltage generated by rotation of armature in the field
f Frequency (Hz)
hg Gearbox per unit efficiency
Ia Armature current
Im Reactive or magnetising component of Io
Io Current in magnetising branch of motor
Ip Power component of Io
J Moment of inertia of the rotating components of the drive (kg.m2)
Jl Load inertia
Jlr Load inertia referred to motor
n Rev/sec
ns Rev/sec synchronous
Nl Load Speed Rev/min
Nm Motor Speed Rev/min
Nr Rotor speed Rev/min
Ns Synchronous speed Rev/min
p Number of pole pairs
Pg Air gap power per phase
Pm Mechanical power output
Ra Armature resistance
Rm Magnetising resistance, representing iron losses
s Slip
s Fractional Slip (AC equivalent circuit)
Tf Frictional torque loss
Tl Load torque
Tl Applied load
Tm Motor torque / Mechanical torque (Newtons)
Va Applied armature voltage
ωm Mechanical angular rotation velocity (2πnradians/s)
Chapter 1
Introduction
AC motors are responsible for approximately 70% of all electricity consumed on the grid network and
are used in 90% of all industrial motor applications for manufacturing processes of various forms.
Depending on the size of these units, from 1 kilowatt to megawatts they can be costly items to replace.
Even on smaller motors, lost production resulting from motor failure often costs manufacturing more in
downtime than the actual motor is worth.
Demand for monitoring the condition of AC motors is now high as the pressure on processes is to
perform with less and less profit margin and with vastly reduced down-time available on plant
equipment. This places a heavy emphasis on the components used to perform day after day, with the
minimum of maintenance input and the maximum amount of up-time.
There are many methods that can be used to monitor the condition of a motor and those such as
vibration analysis rely on a person to manually perform the measurement task. Often, this is not
possible due to the hazardous or inaccessible location of these motors, particularly when processes
are running. It would be of great benefit to industry if the monitoring of motor condition could be done
actively, be non-intrusive and run on a continuous basis using an unmodified, standard motor. Ideally,
this form of monitoring would require no input from maintenance personnel and would signal potential
failure conditions as and when they arise – not months later when manual checks are performed.
This approach tends towards requiring the motor to operate as a ‘transducer’ (since no other
equipment will be fitted to the motor for diagnostic purposes), effectively using only the equipment fitted
as standard to a typical motor in order to ‘feed-back’ information to a higher-level diagnostics system
for the purposes of fault detection.
Condition-based monitoring of fixed-speed AC motor applications using the motor as a transducer is
not a new research area. There are systems available on the market that can be wired non-intrusively
into an existing AC motor application to monitor the motor behaviour and alarm when abnormal
conditions exist. However, these systems rely on the motor operating at a continuous fixed-speed and
coupled directly to the 3-phase supply. This is known industry-wide as Direct On-Line – DOL operation.
Systems that rely on the motor operating in a DOL mode cannot be utilised on inverter-driven motor
systems because the voltage, frequency and phase angles of motor current will vary as the motor
speed is changed. As the use of inverter technology in industry becomes more widespread, the
opportunity to perform diagnosis using these systems is no longer possible and manual measurement
is required once again.
It follows that any new method developed to use the motor as transducer for the purposes of
monitoring both the condition of the motor and the mechanical load that it drives must be compatible
1.1
Research aims
The aim of this research is to advance motor condition monitoring methods into the field of
inverter-driven motor systems, rather than the fixed-speed non-inverter inverter-driven systems that have been the
focus of much research up to now.
It is important to determine at the outset, whether any existing research has been undertaken into the
specific area of using the AC motor as a transducer for detecting electrical and electromechanical
faults on an inverter-driven motor system. This will ensure that the research is not duplicating any
existing work and makes a valuable contribution to research in this field.
A study of all elements of inverter-driven motor systems will be required, from AC motor technology
used through to the inverter-drive systems available on the automation market. This will include details
of how modern flux-vector closed-loop and open-loop inverter systems operate, because any system
that relies on the inverter to provide fault diagnosis will have to be compatible with the latest control
methods available.
In order to test and simulate fault conditions, it will be important to have a test rig that contains all of the
equipment required to perform theses tests satisfactorily. Therefore, the design of a test rig, together
with subsequent test and validation is incorporated into this research as a key contribution.
A series of tests run on healthy and faulty mechanical equipment will then be carried out. The most
appropriate condition monitoring method will be used for the fault diagnosis of the test rig based on the
differences between data sets for healthy and faulty gearbox.
1.2
Research objectives
The main objective of this project is to investigate the operation of an inverter-driven motor system with
a view to determining whether the existing output signals on a typical AC inverter drive contain
sufficient information so as to allow this to be used for purposes of condition monitoring and fault
diagnosis on the driven motor system. The AC inverter must be from a latest-generation of drive and
must not be modified from its original factory-delivered state. This will ensure that all results from the
research are relevant to and useable with the current generation of modern inverter drives without
requiring any modification.
The project objectives can be divided up into several parts and these are given below:
− Investigate actual motor condition monitoring techniques with a view to determine whether
any existing research has been undertaken into the specific area of using the AC motor as
a transducer together with the AC inverter signals for detecting electrical and
electromechanical faults on an inverter-driven motor system.
− Research the latest state-of-the-art control strategies implemented in modern electrical
drives.
− Change the open-loop configuration of the test rig into the closed-loop configuration in
order to increase the system performance and the accuracy of the test results.
− Investigate the signals received from the inverter drive to ascertain their usefulness in
detecting fault/non-fault conditions on the faulty equipment
1.3
Overview of thesis
An overview of the thesis is presented as follows.
Chapter 2 - contains a critical appraisal of the literature review about operation of the various existing
fault diagnostic methods used on AC motor driven systems, AC Inverter drives and AC Inverter-driven
motor systems is presented.
Chapter 3 - the theoretical aspects relating to inverter-driven motor systems are described. A study of
all elements of these systems will be undertaken from the AC motor used through to the inverter-drive
systems available on the automation market. This will include details of how modern flux-vector
open-loop and closed-open-loop inverter systems operate.
Chapter 4 - the design of the test rig will be covered in detail. The operating specification that was
created will be discussed, along with the equipment subsequently specified in order to control the test
rig to an acceptable standard.
Chapter 5- the improvement of the experimental test rig performance by changing its configuration will
be described, together with the equipment and design methods used.
Chapter 6 - the monitoring systems that have been developed and researched for use on AC motors
and inverter systems are investigated and detailed.
Chapter 7 – the tests carried out on the actual test rig using healthy and faulty gear sets will be
presented and the experimental data will be analysed.
Chapter 8 – contains the conclusions from the research performed and suggestions for future work.
The next chapter presents a critical appraisal of the exiting publications related to electrical drives and
Chapter 2
Literature review
This chapter describes a critical appraisal of the literature review about the operation of the various
existing methods used for diagnosis on:
− AC motor systems − AC Inverter drives
− AC Inverter-driven motor systems
Firstly, research on condition monitoring methods on motors involving measurements taken from motor
speeds, vibration or current signals are detailed. Following on from this, investigation into the methods
used for fault detection on the inverter drives is undertaken. This leads onto research work including
model-based condition monitoring and those involving artificial neural networks.
2.1
Fault detection methods on motors using motor current signature analysis (MCSA)
Bo Liang’s [1] research involved the condition monitoring and fault diagnosis of three-phase induction
motors. Firstly, modelling of the three phase motor under different conditions and performing digital
simulations of healthy and faulty inverter motor operation was carried out. This led to the second part of
the research which was to evaluate the performance of range of fault detection and diagnostic
techniques not limited to phase current analysis. The other techniques developed were vibration and
transient speed variations. Finally, the research would lead to the development of fault detection and
diagnostics for faults in three-phase induction motors based on novel signal processing techniques
such as higher order spectral analysis and neural networks.
From the research, it was found that vibration analysis and per-phase current analysis are the most
sensitive techniques for fault detection of induction motors. The success of neural networks developed
for the same purposes of per-phase current fault detection were found to be dependent on the input
variables used by the model. The fault detection models were developed to detect stator and rotor
symmetries.
Juggrapong Treetrong [2] researched the use of parameter identification methods for the condition
monitoring of electric motor drives. This would use MCSA as a basis for the research, but the
efficiencies of these systems would be improved by the use of parameter identification techniques. A
key element of the research would be that the system performing the parameter identification would
have to work from available data (such as stator voltages, currents and the rotor speed) collected
easily from the motor’s power supply. The technique would not rely on any other intrusive equipment or
(Genetic Algorithm) method would be used. This would use the MCSA signals without requiring any
previous knowledge of the parameters to be estimated and without any other instruments.
Induction motor parameter estimation using the GA technique minimised the difference between the
measured and predicted state variables for the motor. The results from testing concluded that the new
scheme can estimate the parameters and predict motor condition with sufficient accuracy for motor
fault diagnosis. It was found that the method can not only detect the faults, but can also quantify how
many faults are happening in the induction motor.
Chinmaya Kar et al. [3] progressed MCSA research into motor gearbox loads, where load fluctuations
on the gearbox and gear defects are two major sources of vibration. Fast Fourier Transforms, along
with further processing using Discrete Wavelet Transform (DWT) to study the transients in MCSA. The
drivers of this research were not due to the complexity involved in detecting faults from the analysed
signals, but in actually needing the vibration measuring instruments. If these could be dispensed with
and the same faults detected through MCSA, then this would be an important step in advancing MCSA
further.
It was shown during the research that the use of Continuous Wavelet Transform (CWT) was unable to
detect defects or load fluctuations. However, results did conclude that MCSA along with DWT can be a
genuine replacement for conventional vibration monitoring.
Serkan Günal et al [4], researched a method whereby the main motor fundamental frequency of 50Hz
(Europe) would be notch-filtered out before being fed into the fault detection process. This was known
as the Notch-Filtered Motor Current Analysis (NFMCSA) method. The reasoning behind this method
was that the spectral components of motor current (other than the fundamental component) carry
required information for fault detection and it is easier to interpret this data once the fundamental
component had been removed. The experimental verification of the proposed features and classifiers
revealed that NFMCSA approach is a promising analysis especially considering the fact that high
classification accuracy can be achieved even in case of structurally different machines with numerous
different faults under varying motor load conditions.
Research undertaken by F. Gu et al [5], involved the use of induction motor current feedback signals to
identify and quantify common faults within a two-stage reciprocating compressor based on bispectrum
analysis. This theoretical basis is developed to understand the non-linear characteristics of current
signals when the motor is driving a varying load under different faulty conditions. This work provides a
novel approach to the analysis of stator current for the diagnosis of motor drive faults from downstream
driving equipment and it was proved that the bispectrum feature gives rise to reliable fault classification
results using non-intrusive methods.
Mohamed El Hachemi Benbouzid et al [6], realised that intensive research had been focused on MCSA
methods and proposed to use advanced signal processing techniques on the stator motor current
experimental results clearly illustrated that stator current high-resolution spectral analysis is very
sensitive to induction motor faults that modify the main spectral components, such as voltage
unbalance and single-phasing effects. Experimental results demonstrated that the stator current
high-resolution spectral analysis – proposed as a medium for induction motors faults detection – has
definite advantages over the traditionally used FFT spectral analysis. Generally, this technique will be
useful in detecting other fault conditions that modify the main spectral component signals.
2.2
Fault Detection using motor Instantaneous Angular Speed analysis (IAS)
Filippetti, F et al [7], researched using Artificial Intelligence techniques in induction machines diagnosis
that including the ‘speed ripple’ effect. Torque ripples that occur due to the broken rotor bars in an AC
induction machine manifest themselves as large speed fluctuations when using the high-resolution
measuring device.
Rotor electrical faults of AC induction machines were used as the basis for this research together with
a new, simple procedure based on a model which includes the speed ripple effect. Their research led
to a new diagnostic index being developed, that was independent of the machine operating condition
and inertia value, thus allowing the implementation of the diagnostic system to be achieved with a
minimum of configuration intelligence.
This research validated the use of AI techniques because the improvements that they introduce in the
diagnostic process and proved that in order to obtain an indication on the fault extent, faulty machine
models are still essential.
Ahmed Yousef et al [8], researched the technique of instantaneous angular speed (IAS) condition
monitoring applied to reciprocating and rotating machinery. This technique was used to detect broken
rotor bars in such systems. Results from a broken rotor bar fault show that the power spectrum of the
IAS signals could be used for the diagnosis of this failure mode.
The key features in this case are the use of the pole pass speed sidebands around the rotor speed
components for the purposes of fault detection. These sidebands could be visible at high loads as in
vibration and current signature monitoring.
2.3
Fault detection methods on inverter systems
B. Biswas et al. [9] researched current harmonics analysis of an inverter-fed induction motor drive
system under fault conditions. They presented harmonic analysis of motor current signatures under
different fault conditions of medium and high power Variable Frequency Drive (VFD) systems. The
medium to high power ranges can be a significant capital investment, making early diagnosis of faults
in this arena even more paramount. Computer simulation of a variable speed inverter-fed induction
motor based on constant voltage/frequency (V/f) operation is implemented using Powersim (PSIM)
simulation software. Frequency response characteristics of motor currents are compared to analyze
fault conditions in the motor drive system.
The method used was to analyse each of the frequency responses for different fault conditions in the
inverter and compare these to establish the utility of FFT algorithm to identify the nature of the fault.
frequency responses under three different fault conditions were distinctly different and the research
was able to discriminate each of the different fault states.
A. Azzini et al. [10] researched the use of tuned neural networks to diagnose incipient fault diagnosis in
electrical drives. In order to identify any decrease in efficiency and any loss in industrial application a
suitable monitoring system for processes is often required. With their proposed approach, useful
diagnostic indications can be obtained by a low-cost extension of the monitoring activity. In this way,
the reliability of the obtained indications can be significantly increased considering the combination of
advanced time-frequency transform, or time-scale, such as wavelets, and a new evolutionary
optimisation approach based on Artificial Neural Networks (ANN’s).
Their research had been successfully applied to a real-world electric machine fault diagnosis problem.
The experiments showed that the algorithm is quite robust with regard to the setting of the parameters
– it does not require so much fine-tuning of the parameters. Their adopted methodologies were able to
give good results for fault / non-fault identification in electrical drives. This was especially
advantageous as it was found that due to the use of both wavelet processing of the acquired current
and EA evolution of the ANN is a very simple and easy to implement system for diagnostic purposes.
Khater, Faeka et al. [11] presented a fault diagnostics system for a three-phase voltage source inverter
using rule-based fuzzy logic system. The system was developed as a rule-based fuzzy logic system for
faults occurring on the inverter power semiconductor switches (IGBT’s). Based on a time domain
simulation model, the inverter different fault conditions are simulated with the resulting voltage
spectrum providing the database for the fuzzy logic system. The developed fault diagnostics system is
capable of identifying the type and location of the inverter fault.
The proposed fault diagnostics system resulted in a matrix that provides the fault condition according
to the data base status
Rozailan Mamat et al. [12] considered the fault detection of 3-Phase VSI using Wavelet-Fuzzy
Algorithm. A real-time condition monitoring algorithm for a 3-phase PWM inverter drive using
fuzzy-logic was developed. It is designed to detect and identify the transistor open-circuit fault and an
intermittent misfiring fault, which commonly occurs in the inverter drive system. The condition
monitoring mechanism is based on discrete wavelet transform (DWT) and fuzzy logic (FL). With this
method, stator currents are used as an input to the system – no direct access to the induction motor is
required.
Rigorous testing – both theoretically and practically – of the system proved that it is robust and reliable.
The features are directly extracted from the wavelet transform of the stator currents. The results clearly
show that wavelet analysis together fuzzy logic, offers a great potential for monitoring and diagnosis of
power electronic drives.
M. Abul Masrur et al. [13] researched intelligent Diagnosis of Open and Short Circuit Faults in Electric
simulation tool to generate voltages and current signals at a broad range of operating points selected
by a machine learning algorithm. Extensive simulation experiments were conducted to test the system
with added noise, and the results show that the structured neural network system which was trained by
using the proposed machine learning approach gives high accuracy in detecting whether a faulty
condition has occurred, thus isolating and pin-pointing to the type of faulty conditions occurring in
power electronics inverter based electrical drives.
Three important sets of signals, namely the torque, and voltages and currents in different phases were
used for the fault diagnostics. These signals were segmented simultaneously and diagnostic features
were extracted from signal segments. The accuracy of the diagnostic results has reached more than
99% in average and furthermore, the authors presented a structured neural network system that is
trained to detect and isolate any of the 15 faults in a three-phase induction motor in real-time. System
performance is evaluated on the basis of time elapsed to detect a fault after it occurs and simulation
results show that the proposed system takes less than 20 ms on an average to successfully detect and
isolate a fault.
Debaprasad Kastha et al. [14] investigated Fault Modes of Voltage-Fed Inverter System for Induction
Motor Drive. They recognised that knowledge about the fault mode behaviour of an converter system is
extremely important from the standpoint of improved system design, protection and fault-tolerant
control. They have undertaken a systematic investigation into the various fault modes of a voltage-fed
PWM inverter system for induction motor drives and then developed a preliminary mathematical
analysis for the key fault types. Such faults covered include input supply line faults to inverter drive
transistor open and short-circuit faults. The predicted fault performances were then substantiated by
simulation study. The study has been used to provide fault-tolerant control by determining the stresses
in power components to allow operation to continue, post-fault by using steady-state operating regions.
The research applied to inverters operating in the volts/hertz mode and the extensive simulation study
was able to define the zone of operation where the drive can continue to operate safely in a degraded
mode. In high-reliability process control environments, this is extremely important.
2.4
Model-based condition monitoring
Filippetti, F et al [15], presented the improvement of induction machine rotor fault diagnosis based on a
neural network approach. By training the neural network using data sampled through experimental
tests on healthy machines and through simulation in case of faulted machines, the diagnostic system
can discern between “healthy” and “faulty” machines.
This was found to be a more robust method for on-line identification of induction machine rotor bar
failures. The input and the output patterns to train the neural network were obtained using both
experimental data related to healthy machines and computed data obtained from a faulted machine
model as a simulator. In addition to this, the network was able to be introduced to manufacturing
dissymmetry – inevitable in equipment – rather than by setting a fixed trigger threshold for
Filippetti, F et al [16], then further researched the application of expert systems, artificial neural
networks (ANNs), and fuzzy logic systems that can be integrated into each other and used with more
traditional techniques for fault diagnosis of electrical machines and drives. This research brings
together the diagnosis of the induction machine itself and the AC converter drive including both open
and closed-loop variants for detecting failed machine rotor bars.
Whilst the techniques covered are limited to only a number of practical implementations, it is believed
that these techniques will have a significant role in electrical drive diagnostic systems. In particular,
fuzzy-neural diagnostic systems will become extensively used for machine condition monitoring,
potentially in self-repairing electrical drives.
Loránd Szabó et al [17], researched an Improved Condition Monitoring System for Induction Machines
Using a Model-Based Fault Detection Approach. The monitoring system was based on improving the
accuracy of fault detection by the combined application of two monitoring methods. A fault signal will
only be generated when both methods indicate its presence in the electrical machine. The two fault
detection methods used are MSCA (motor current signature analysis) and IAS (Instantaneous Angular
Speed).
It was found that using two different monitoring methods at the same time improves the accuracy of the
entire monitoring system following the correct operation of a vector controlled AC squirrel cage
induction machine. However, with this paper, no actual simulated tests of motor faults was performed
and the accuracy of the proposed system was not verified.
2.5
Fault detection using vibration analysis and advanced networks
Electric motor vibration creates additional power consumption and degrades the performance of the
motor. To avoid unexpected equipment failures and obtain higher accuracy in diagnostic for the
predictive maintenance of induction motors, on-line health monitoring systems play an important role to
improve system reliability and availability. The recent developments in MEMS technology shows an
increasing trend to integrate vibration analysis for fault diagnostic purposes. Vibration-based detection
using an accelerometer is gaining popularity due to higher reliability of the devices, low power
consumption and low cost.
To this end, Wei-Jen et al [18], presented a paper on a wireless health monitoring system for vibration
analysis of induction motors. This paper presents the study of vibration due to the rotor imbalance. The
technique of vibration detection and observation of vibration signal in the 3-phase induction machine is
studied in this paper. A novel health monitoring system of the electric machine based on a wireless
sensor network (ZigBee™/IEEE802.15.4 Standard) is also proposed and developed in this paper.
Experimental results of the proposed severity detection technique of rotor vibration under different
levels of imbalance conditions are investigated and discussed.
Research on the actual signal processing techniques required was studied and some of the more
Piotr Czech et al [19], presented research on classification of tooth gear wheel faults of a gearbox by
multilayer perceptron (MLP) and continuous wavelet transform (CWT) simulated on a test rig stand.
The outline of the research was to build classifiers of the local teeth damages in gear wheels, based on
artificial neural networks (ANN’s). The gear damage was in the form of a crack in the tooth base and
the crumbling of a tooth tip.
As a result of the conducted research it was possible to build a correctly working classifier of both the
type and advancement of the gear damage. However, it was found that the achieved classification
error relies extensively on how the damaged model is prepared and the teaching method of the ANN in
order to obtain accurate results.
Salem Al-Arbi et al [20], presented Early Diagnosis of Gear Transmission Failure based on Advanced
Intelligence Analysis on vibration signals measured remotely. The research was concerned with
investigating more reliable and effective approaches to the detection and diagnosis of different gear
faults based on enabling techniques such as Time Synchronous Averaging (TSA), Spectrum analysis,
Cepstrum analysis, Time-frequency analysis and Wavelet transforms. The sensors were mounted at
two different locations, one on the gearbox and the other at the motor end.
It was found that spectral analysis based on TSA signals is a more appropriate solution to the remote
fault diagnosis problem and the analysis results illustrate that spectral analysis based on TSA signals
can achieve the same results at a remote position as when the sensor is mounted as close to the gear
as possible.
Wavelet transforms were found to be the most effective due to factors such as allowing decomposition
of signals at different scales, therefore allowing different gearbox transmission stages to be analysed,
but further research work is required to confirm the operation of this in a real industrial environment.
The next chapter presents the theoretical aspects related to the operation of electrical drives including
Chapter 3
Theoretical aspects related to inverter-driven motor
systems
This chapter will describe the operation and theoretical aspects of inverter-driven motor systems on
which this research is based. Study of the AC motor and inverter in detail is important, as the two
effectively become one system for this research.
In the first instance, operation and theoretical equations of the AC asynchronous induction motor will
be described. Following this, operation of modern inverter control systems will be detailed. From basic
six-step inverters through to pulse-width-modulated sensorless vector units and then to devices
operating in closed loop mode using motor encoder feedback. Closed-loop drive performance is
discussed and comparisons made with other inverter operating modes.
3.1
Inverter Systems
An inverter-driven motor system controls the rotational speed of an alternating current (AC) electric
motor by controlling the frequency and voltage of the electrical power supplied to the motor. This
system is also called variable frequency drive (VFD), adjustable-frequency drive (AFD), and
variable-speed drive (VSD). Variable-frequency drives are widely used in ventilation systems, pumps, elevators,
conveyors, machine tools, etc. There are four basic design types of VFDs that are described briefly
below:
a) Pulse Width Modulation (PWM) – this controller is extremely popular because it is affordable,
highly reliable and reflects the least amount of harmonics back into its power source. The AC line
supply voltage is the input signal for the converter (with diodes and large DC capacitors) which creates
and maintains a stable DC bus voltage. The DC voltage feeds the inverter (now commonly with
insulated gate bipolar transistors (IGBTs)) which regulate both voltage and frequency to the motor to
produce a near sine wave like output.
PWM means that each transition of the alternating voltage output is actually a series of short pulses of
varying widths. By varying the width of the pulses in each half cycle, the average power produced has a
sine-like output. The number of transitions from positive to negative per second determines the actual
frequency to the motor. The main advantages of PWM are: excellent input power factor; no motor
cogging; high efficiency 92 - 96%; lower initial cost. However there are also several disadvantages:
motor heating and insulation breakdown in some applications; non-regenerative operation; line-side
power harmonics.
b) Current Source Inverter (CSI) - is t
(Silicon Controlled Rectifiers) are switched in a six-step sequence to direct the current to a three-phase
AC load as a stepped current waveform. CSI inverter could have load commutation and parallel
capacitor commutation which are assisted by the input current regulation so it requires a large internal
inductor to operate. The main advantages of CSIs are: reliability due to inherent current limiting
operation; regenerative power capability; simple circuits. The main shortcomings are: large power
harmonic generation back into power source; cogging below 6 Hz due to square wave output; poor
input power factor due to SCR converter section.
c) Voltage Source Inverter (VSI) - uses an SCR converter section to regulate DC bus voltage. The
inverter output is six-step output, the drive is a voltage regulator and uses transistors, SCRs or Gate
Turn-Off thyristors (GTO’s) to generate an adjustable frequency output to the motor. VSI’s have the
following advantages: simple design; applicable to multi-motor operations; operation is independent of
load. The main disadvantages are: large power harmonic generation back into the power source; poor
input power factor; cogging below 6 Hz due to square wave output; non-regenerative operation.
d)Flux Vector PWM drive – contains new power switching devices and smart 32-bit microprocessors
to drive high torque, low RPM applications. The power section is the same as for all PWM drives and
the motor's rotor position and speed are monitored in real time via a resolver or digital encoder for a full
closed-loop system. In a sensorless vector control system, the motor speed is calculated from the
voltage and current signals measured from the motor. From this information, the drive microprocessor
determines and controls the motor actual speed, torque, and power produced. The vector control
algorithms can be programmed into the motor or learned by the drive. These drives have the following
advantages: excellent control of motor speed, torque, and power; quick response to changes in load,
speed, and torque commands; ability to provide 100% rated torque at 0 speed; lower maintenance cost
as compared to DC motors and drives.
The shortcomings of these drives are: higher initial cost in comparison to standard PWM drives;
require special inverter-rated motors; and some drive manufacturer setup parameters are complex
(although this is improving).
3.1.1 Electric drive block diagram
Figure 3-1 presents the components of an electric drive. The user introduces the input command
(speed and /or position) into the controller which is sent to the Power Processing Unit (PPU). The
electrical motor receives the electrical energy from the electric source and the command signal from
the PPU. The electrical motor transforms the electrical power into mechanical energy which activates
the mechanical load. The sensors are used to monitor the actual operating state of the drive and to
feed back to the input of the controller an analogue or digital signal representing the output state. The
actual and reference states are continually compared and if the actual state is different from the
reference state an error signal is generated which the controller uses to force a change in the
controllable parameters to eliminate the error by driving the system back towards the desired operating
state as a reference and the control system will automatically move the system to the desired operating
[image:27.596.100.490.105.353.2]point and maintain it at that point thereafter.
Figure 3-1 - Block diagram of an electric drive [29]
3.1.2 Six-step VSI Inverter
The most basic form of a six-step AC inverter is the Variable Voltage Inverter (VVI). The term ‘six-step’
comes from the fact that it takes six 60° switching steps to complete one full 360° cycle.
The VVI consists of an SCR (Semiconductor/Silicon Controlled Rectifier) circuit to convert the incoming
AC voltage into DC. An SCR as opposed to just simply a bridge-rectifier arrangement is employed
because the DC voltage needs to be controlled and regulated – this completes the ‘Converter’ section.
A choke and capacitor make up the DC link section, helping to keep the converted DC voltage smooth
and reduce ripple.
Finally, the output (Inverter) circuit consisting in modern drives of an IGBT (Insulated Gate Bipolar
Transistor) circuit is used to convert the DC bus voltage into an 3-phase AC waveform. Older drives
employed Thyristors, Bipolar Transistors or MOSFETS, but these are rarely used now. A diagram of
Figure 3-2 - Variable Voltage Inverter (VVI) Basic Circuit Diagram [29]
The circuit components of the six-step VSI are now described in more detail and Figure 3-3 below
illustrates how all of the individual components function as part of a VSD controller and the control
loops used.
Figure 3-3 - Six-step VSI Block Diagram [29]
Bridge Firing Unit
The bridge firing unit is used to convert the firing angle, provided by the DC bus voltage regulator, into
pulses applied to the thyristor gates. The bridge firing unit block contains notch filters applied to the
voltage measurement to remove harmonics. The discrete synchronized six-pulse generator block is
used to generate the pulses.
The DC bus voltage regulator is based on a PI controller and a hysteresis chopper logic. When the bus
voltage decreases, the PI controller reduces the firing angle. When the bus voltage increases, the PI
controller increases the firing angle. The chopper logic is based on hysteresis control. If the voltage
reaches the upper hysteresis limit, the DC voltage controller toggles to braking mode and the chopper
is activated, whereas the thyristor bridge is shut off. In chopper mode, the proportional action remains
active but the integral gain is set to zero because the chopper dynamics are very high and the integral
Figure 3-4 - DC bus PI regulator diagram [30]
The six-step generator illustrated in Six-Step Generator
Figure 3-5 contains six comparators to produce the six-step
[image:29.596.106.489.380.607.2]switching waveforms. Some supplementary logic enables a speed reversal by inverting two phases.
Figure 3-5 - Six-step generator diagram [30]
In the AC1 motor drive, the motor speed is not regulated in closed loop. Instead, the speed set point is
used only to determine the motor voltage and frequency applied by the six-step inverter in order to
maintain the (V/F) ratio (or the motor flux) constant from 0 to the nominal speed. Above nominal speed,
the motor operates in the flux weakening mode; that is, the voltage is maintained constant at its
nominal value while the frequency is increased proportionally to the speed set point.
When reversing speed, a short delay is required at the zero speed crossing so that air gap flux decays
to zero.
Figure 3-6 - Six-step firing pulses and motor current generated [29]
This method of switching is no longer used in AC inverters, due to the torque pulsations that occur in
the AC motor each time one of the devices is switched. These torque pulsations manifest as ‘cogging’
in the motor and as the motor current is no longer sinusoidal, harmonic currents produced in the motor
create additional heating, requiring de-rating of the motor.
However, because there is no high frequency carrier, a 6-Step type of inverter produces no audible
noise in the AC motor.
3.1.3 PWM inverter
The block diagram of a PWM inverter is the same as for the six-step inverter. The major difference
with a PWM inverter, however is how the 3-phase output to the motor is generated.
All modern VSI’s now use PWM (Pulse Width Modulation), as this provides a more sinusoidal current
output to control frequency and voltage supplied to the AC motor. Thus, they are more efficient and
can provide a higher level of performance than the VVI or six-step units with no motor de-rating
required.
The advent of PWM inverters brought with it the need to have a device capable of switching at a
high-frequency and this is what an IGBT is designed to do. Typically, an IGBT can turn on in less than 400
nanoseconds and off in approximately 500 nanoseconds.
Figure 3-7 - PWM Inverter output switching waveform [31]
Observing Figure 3-7, it can be seen that the output of the PWM drive doesn't provide an exact replica
of the AC input sine waveform. Instead, it provides voltage pulses that are at a constant amplitude.
the 3-phase output. The longer the power device remains on, the higher the output voltage. The less
time the power device is on, the lower the output voltage. Conversely, the longer the power device is
off, the lower the output frequency with Figure 3-8 illustrating this.
Figure 3-8 - PWM inverter drive output [31]
The speed at which power devices switch on and off is determined by the carrier frequency, also
known as the switching frequency. The higher the switching frequency, the more resolution each PWM
pulse contains. Typical switching frequencies are between 3KHz to 4KHz. The higher the switching
frequency, the smoother the output waveform and therefore a higher resolution is obtained. However,
higher switching frequencies decrease the efficiency of the drive because of increased heat in the
power devices so a trade-off is made between resolution and efficiency.
High-performance drives have now taken PWM a step further and employ new technologies such as
Sensorless Vector control to further improve motor performance. These are now described in more
detail, with the Closed-loop flux-vector drive that uses encoder feedback being detailed last as this is
the highest-performance drive offering.
3.1.4 Sensorless Vector Drive Technology
Sensorless Vector Control, like a V/Hz drive, continues to operate as a frequency control drive, with
slip compensation keeping actual motor speed close to the desired speed. The Torque Current
Estimator block determines the percent of current that is in phase with the voltage, providing an
approximate torque current. This is used to estimate the amount of slip, providing better speed control
Figure 3-9 - Sensorless Vector Block Diagram [31]
The control improves upon the basic V/Hz control technique by providing both a magnitude and angle
between the voltage and current. V/Hz drives only control the magnitude. Volts-angle (V angle in the
figure) controls the amount of total motor current that goes into motor flux enabled by the Torque
Current Estimator. By controlling this angle, low speed operation and torque control is improved over
the standard V/Hz drive.
3.1.5 Sensorless Flux-vector drive technology
Sensorless flux vector control retains the basic core Volts/Hertz control philosophy and adds additional
blocks around this core to improve the performance of the drive. A “current resolver” attempts to
identify the flux and torque producing currents in the motor and makes these values available to other
blocks in the drive. A current regulator that more accurately controls the motor replaces the current
limit block. Notice that the output of the current regulator is still a frequency reference.
Early versions of Flux-vector drives required a speed feedback signal (typically an encoder) and also
detailed information about the motor in order to properly identify the flux and torque currents. This led
to the requirement for “matched motor/drive” combinations and many of the Siemens “Masterdrives”
units had every motor type stored in the drive memory for such control. While there was nothing
inherently wrong with this approach, it does limit the choice of motor to the end user and at the time,
did not offer independent control of motor flux and torque. Figure 3-10 shows the additional
Figure 3-10 - Sensorless Flux Vector Block Diagram [31]
3.1.6 Closed-loop flux-vector drive with field-orientated control
The true closed-loop flux vector drive offers improved performance over the sensorless vector drive
and modern units can now fully autotune to match completely the motor that they are controlling. These
drives now employ field-oriented control that takes motor control a step further. What distinguishes a
product using Field Oriented Control from a traditional vector product is its ability to separate and
independently control (or regulate) the motor flux and torque. A block diagram of such a drive is given
in Figure 3-11.
Figure 3-11 - Field Oriented Control Block Diagram
A high bandwidth current regulator that separates and controls the components of stator current
replaces the Volts/Hertz core. The high bandwidth characteristics of this control eliminate nuisance
trips due to shock loads and continuously adapt to changes in the motor and load characteristics. A
separate adaptive controller uses information gained during auto tuning, actual reference information,
and motor feedback information to give independent torque and flux control. This allows continuous
regulation of the motor speed and torque. This is the type of controller that will be specified for the test
3.2
AC Motors (actuators)
The type of AC motor used in this test rig for research purposes is an asynchronous squirrel-cage AC
polyphase induction motor. The construction and principles behind the operation of this motor are
![Figure 3-1 - Block diagram of an electric drive [29]](https://thumb-us.123doks.com/thumbv2/123dok_us/356801.1036826/27.596.100.490.105.353/figure-block-diagram-electric-drive.webp)
![Figure 3-4 - DC bus PI regulator diagram [30]](https://thumb-us.123doks.com/thumbv2/123dok_us/356801.1036826/29.596.114.486.66.315/figure-dc-bus-pi-regulator-diagram.webp)
![Figure 3-12 - Stator core detailing winding ‘slots’ [22]](https://thumb-us.123doks.com/thumbv2/123dok_us/356801.1036826/34.596.244.357.475.586/figure-stator-core-detailing-winding-slots.webp)
![Figure 3-15 - AC Squirrel-cage motor exploded view [23]](https://thumb-us.123doks.com/thumbv2/123dok_us/356801.1036826/36.596.67.543.78.482/figure-ac-squirrel-cage-motor-exploded-view.webp)
![Figure 3-16 - AC Motor Torque Curve ; Redrawn from original diagram [24]](https://thumb-us.123doks.com/thumbv2/123dok_us/356801.1036826/38.596.108.492.69.359/figure-ac-motor-torque-curve-redrawn-original-diagram.webp)
![Figure 3-17 - AC Motor torque/speed curve; Redrawn from original diagram [24]](https://thumb-us.123doks.com/thumbv2/123dok_us/356801.1036826/39.596.116.480.64.350/figure-motor-torque-speed-curve-redrawn-original-diagram.webp)

![Figure 4-4 - Functional Block Diagram – 690+ Inverter, Frame C [32]](https://thumb-us.123doks.com/thumbv2/123dok_us/356801.1036826/52.596.105.491.71.404/figure-functional-block-diagram-inverter-frame-c.webp)
![Figure 4-6 - Resistor bank view [34]](https://thumb-us.123doks.com/thumbv2/123dok_us/356801.1036826/55.596.200.403.335.571/figure-resistor-bank-view.webp)
