2016 International Conference on Artificial Intelligence and Computer Science (AICS 2016) ISBN: 978-1-60595-411-0
Remote Sensing Data Classification Using Combined Spectral and
Spatial Local Linear Embedding (CSSLE)
Li-fang XUE, Xiu-shuang YI,
Xiu-mei LIU, Feng-yun LI
*and Jie LI
Computing Center, Northeastern University, Shenyang, China *Corresponding author
Keywords: Combined spectral and Spatial local linear embedding, Remote sensing data, Feature learning, Manifold learning
Abstract. Feature learning and extraction have been used to reduce the complexity of the representation of remote sensing data. In this paper, a novel remote sensing data feature analysis method is proposed based on the locally linear embedding (LLE) techniques, which is an unsupervised manifold learning algorithm. If the remote sensing data variability is described by a small number of spatial features, we can treat the data as lying on a low dimensional manifold in the high dimensional space of remote sensing data. The proposed method, combined spectral and spatial local linear embedding (CSSLE) makes use the neighbors in both domains. Compared with LLE, CSSLE makes up the shortage that LLE ignores the relationship among the spatial neighboring pixels which is extremely important for remote sensing images. In this paper we provide experiment results from the analysis of remote sensing data using PCA, LLE and CSSLE. Classification results show that proposed method can give higher accuracies than the linear method of PCA and the nonlinear method of LLE.
Introduction
Remote sensing data are characterized by the high spectral resolution that offers many wavelength channels per pixel[1]. These continuous spectral channels increase the efficiencies for feature extracting, classifying and clustering over an area. In remote sensing data, nonlinear properties are intrinsic. There are various origins of nonlinearity, one of the important sources originate from wavelength dependent nonlinear reflectance defined by the bidirectional reflectance distribution function (BRDF). Another source of nonlinearity stems from the complex scattering between photons and ground targets, within-pixel spectral mixing, and scene heterogeneity [2,12]. The nonlinear characteristics of remote sensing data embody nonlinear topological structures in feature space and this feature may disappear if input data are projected into a space described by eigenvectors. The nonlinear structures are important for information extraction from remote sensing data. A low dimensional submanifold may have a significant nonlinear structure that linear methods couldn’t discover.
input data virtually may be situated on a low dimensional manifold, which is defined by local geometric differences between data samples. Nonlinear manifold learning methods are categorized as global or local approaches. Global manifold learning methods including, ISOMAP [5] and Kernel PCA [6], keep the reliable global topology of the data set, but have greater computational overhead for large data sets. Local manifold learning methods including, locally linear embedding (LLE) [7], local tangent space alignment (LTSA) [8] and Laplacian eigenmaps (LE) [9], preserve local geometry isometric feature. The advantage of these local manifold learning methods is that they have computational efficiency because of only requiring sparse matrix computations. Manifold learning algorithms may also be meaningful in remote sensing data analysis. Instances of these applications include projecting remote sensing data into a low dimensional space for visualization or extracting properties for remote sensing data classification. A number of exploratory studies [2,10,11,12] have shown that manifold learning algorithms can be used to analysis and classify remote sensing data successfully in a low dimensionality space.
In this paper, we apply one of these algorithms–combined spectral and spatial linear embedding (CSSLE)-to the feature analysis and classification of remote sensing data. CSSLE method makes use of both spectral and spatial information implicated in remote sensing data to increase system efficiency. The method makes up the shortage that LLE method ignores the relation of neighboring pixels spatially which is extremely important for remote sensing data. This important spatial information is recognized as characteristics of geographical data, including the relation of neighboring samples to the target data sample. There has few feature analysis approaches to exploit spatial information because remote sensing data have high dimensionality and the spectral and spatial heterogeneity. The ideal of combined spectral and spatial linear embedding is to group the neighboring pixels into spectrally homogeneous objects. The ability of the algorithm to discover low dimensional structure within remote sensing data and classification results are evaluated and compared.
Remote Sensing Data Feature Extraction by Combined Spectral and Spatial Linear Embedding
Locally Linear Embedding (LLE)
The LLE proposed by Sam T.Roweis [7] is an effective algorithm for the dimensionality reduction of high dimensionality data. Given high dimensionality data inputs
1 N i i X
in D dimensions, LLE
algorithm tries to discover low dimensionality data outputs
1 N i i Y . We can make a distinction between LLE and other algorithms for dimensionality reduction, including multidimensional scaling [4] and Isomap [5], by local geometric properties. The reason is that MDS and Isomap attempt to preserve global properties such as the pairwise distances between all input data.
The algorithm has three steps as followed:
Firstly, the algorithm attempts to compute neighbors for every high dimensionality input Xi
. Neighbors may be computed according to the simplest K nearest neighbors based on Euclidean
distance.
Secondly, the algorithm appeals to the thought that neighboring input samples situate on a locally linear patch of the manifold. For every input data Xi
, LLE compute series of linear coefficients to reconstruct the input data from neighboring samples. The total reconstruction error of the inputs is measured by the cost function:
2
( ) i ij j
i j
W X W X
The weight Wij saves the contribution of X j
to the linear reconstruction of Xi
.
Thirdly, the algorithm tries to compute a low dimensionality embedding that is characterized by the same reconstruction weights. In general, we choose the low dimensionality outputs Yi
to minimize the embedding cost function:
2
( ) i ij j
i j
Y Y W Y
. (2) We can compute the bottom d1 eigenvectors of the NN matrix (I W ) (T I W ) to obtain
The minimum of Eq. 2. The bottom eigenvector is discarded, and the remainder d eigenvectors
minimizes Eq. 2 by the constraints of centering and orthogonality.
The LLE algorithm has two free parameters: the number of neighbors K and the target
dimensionality d . The number of neighbors normally should be greater than the target
dimensionality. Moreover, if we represent the input data using the vertices of an undirected graph, which has edges connecting neighboring input samples, then LLE algorithm should only be applied to input samples that give rise to connected graphs. In general, the target dimensionality depends on the actual use of the nonlinear manifold embedding.
Combined Spectral and Spatial Linear Embedding (CSSLE)
Combined spectral and spatial linear embedding (CSSLE) method makes use of both spectral and spatial information implicated in remote sensing data to increase system efficiency. The method makes up the shortage that LLE ignores the relation of neighboring pixels spatially which is extremely important for remote sensing data. So except for choosing neighbors on the basis of Euclidean distance in remote sensing data, the neighboring pixels (up, down, left and right) spatially of an input sample can be also utilized to determine reconstruction weights. We can define the neighborhood of an input sample by both spectral and spatial terms, and choose the k (k = k1 + k2) closest points along the spectral and spatial coordinate system.
Error equations of combined spectral and spatial linear embedding (CSSLE) for reconstruction and embedding can be expressed and optimized according to LLE.
( ) ( )
( , ) (( N ) (T N ) T )
X W trace I W I W X X
. (3)
( T )
trace MY Y . (4)
Experiment and Result Analysis
In this paper, To investigate CSSLE’s potential on extracting features from remote sensing data, we used the image data called SubCanb.BSQ. The image segment is 100 lines of 400 pixels each and contains 6 Thematic Mapper bands (Bands 1, 2, 3, 4, 5, & 7). The image was fully processed for geometric orthorectification, spectral correction and atmospheric removal. The water absorption bands were removed, leaving 6 bands for further analysis.
Figure 1. SubCanb image (the selected subset is enclosed by the dotted square).
Information Content Preservation
The first experiment conducted was on information content preservation. For eigenvector-based linear algorithms, information content is evaluated in terms of variance that is quantified as eigenvalues. For example, the information content represented by the first PCA-band image is calculated as the eigenvalue corresponding to the first eigenvector of the data covariance matrix. So are the other PCA-band images. Because the first few eigenvectors account for the majority of the total variance, the corresponding PCA-band images maintain the major part of the information content in the image. The first three PCA-band images are shown in Fig.2.
[image:4.612.163.449.318.411.2]
Figure 2. PCA-band images for the subset of SubCanb image (left=PCA 1; middle=PCA 2;right=PCA 3).
To investigate CSSLE’s ability on information preservation, we compared CSSLE-band images with PCA-band images of the same SubCanb data shown in Fig.1. The corresponding CSSLE results are given in Fig.3.
Figure 3. CSSLE-band images for the subset of SubCanb image (left= CSSLE 1; middle= CSSLE 2;right= CSSLE 3).
This comparison revealed that: the three CSSLE-band images preserved similar amounts of spatial information as that preserved by the PCA-band images, which are believed to represent the major information content of the original remote sensing image.
Pure Pixel Identification
[image:4.612.136.476.487.595.2]Feature extraction is often employed to reduce data dimensionality, and make it manageable when expressed in a scatter plot. Fig.4 is a 3D-scatter plot constructed with the first 3 PCA-band images. However, this featureless data cloud makes it impossible for us to spot more than one pure pixel. In contrast, Fig.5 and Fig.6 is another 3D-scatter plot built with the first 3 LLE and the first 3 CSSLE band-images. By tracking down the pixels located at the four tips of the data cloud, pure pixels are readily identified. It turned out that these were four endmembers – water, soil, plant or forest.
Figure 4. 3D-scatter plot with PCA. Figure 5. 3D-scatter plot with LLE. Figure 6. 3D-scatter plot with CSSLE.
Classification Experiment
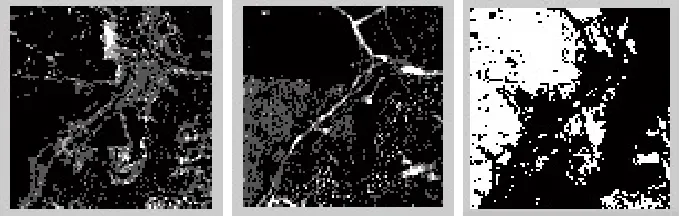
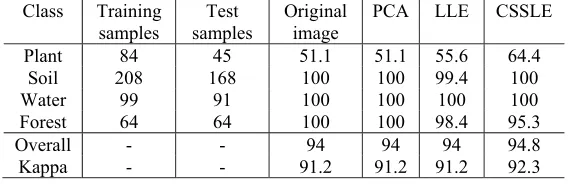
In this remote sensing data classification experiment, classification results of the original image, PCA, LLE and CSSLE algorithm results have been compared. Fig.7 and Fig.8 show the original, PCA, LLE and CSSLE image and classification results. As can be seen, classification map of CSSLE contain more homogeneous regions than LLE. Table 1 lists the class-specific producer’s accuracies and the OAs for the two methods tested. It shows that CSSLE gives the better class-specific accuracies for most of the classes and its OA is 0.8% higher than LLE.
[image:5.612.147.465.402.478.2]
Figure 7. The original, PCA, LLE and CSSLE image.
[image:5.612.164.451.632.724.2]
Figure 8. The original, PCA, LLE and CSSLE classification results.
Table 1. Number of samples and classification accuracies in percentage of the SubCanb image. Class Training
samples
Test samples
Original image
PCA LLE CSSLE
Conclusions
In this paper, we have presented results from the remote sensing data analysis using combined spectral and spatial linear embedding (CSSLE). We observed that the nonlinear embedding of combined spectral and spatial linear embedding is promising for remote sensing data feature extraction. It compared favourably with PCA on spatial information preservation. In addition, it exceeded PCA and LLE on pure pixel identification through scatter plots. The proposed algorithm was completely simulated on PC. The classification results show that the approach is correct and effective. Future considerations will be given to thoroughly examining CSSLE for hyperspectral data information extraction and optimizing CSSLE to process full scene hyperspectral images.
Acknowledgements
This research was financially supported by the Fundamental Research Funds for the Central Universities (N110216001), the National Science Foundation of China (61502092, 61602106) and the Doctor Research Start-up Fund of Liaoning Province (201601014).
References
[1] M.A. Karaska, R.L. Huguenin, J.L. Beacham, M. Wang, J.R. Jensen, and R.S. Kaufmann, “AVIRIS Measurements of Chlorophyll, Suspended Minerals, Dissolved Origanic Carbon, and Turbidity in the Neuse River, North Carolina,” Photogrammetric Engineering & Remote Sensing, Vol. 70, No. 1, January 2004, pp. 125-133.
[2] T. Han, D.G. Goodenough, “Nonlinear Feature Extraction of Hyperspectral Data Based on Locally Linear Embedding (LLE),” Geoscience and Remote Sensing Symposium, Vol. 2, pp. 1237-1240, 2005.
[3] I.T. Jolliffe, “Principal Component Analysis,” Springer Series in Statistics, Springer-Verlag, New York, 1986.
[4] T. Cox and M. Cox, “Multidimensional Scaling,” Chapman & Hall, London, 1994.
[5] J.B. Tenenbaum, V.de Silva and J.C, “Langford. A global geometric framework for nonlinear dimensionality reduction,” Science, 2000, vol. 290, pp. 2319-2323.
[6] B. Schölkopf, A J. Smola, K.R. Muller, “Kernel principal component analysis,” Lecture Notes in Computer Science, 1997, vol. 1327, pp. 583-588.
[7] S.T. Roweis and L.K. Saul, “Nonlinear dimensionality reduction by locally linear embedding,” Science, 2000, vol. 290(5500), pp. 2323-2326.
[8] Z.Y. Zhang, H.Y. Zha, “Principal Manifolds and Nonlinear Dimension Reduction via Local Tangent Space Alignment,” SIAM Journal of Scientific Computing, 2004, vol. 26, No. 1, pp. 313-338.
[9] M. Belkin and P.Niyogi, “Laplacian eigenmaps and spectral techniques for embedding and clustering,” Advances in Neural Information Processing, 2002, vol. 14, pp. 585-591.
[10] Viren Jain and Lawrence K. Saul, “Exploratory analysis and visualization of speech and music by locally linear embedding,” ICASSP, 2004, vol. 3, pp. 984-987.
[11] D. Lunga, S. Prasad, M.M. Crawford and O. Ersoy, “Manifold-Learning-Based Feature Extraction for Classification of Hyperspectral Data,” IEEE Signal Processing Magzine, 2014, January, pp. 55-66.