Mycobacterial Culture for Quantification of Early Bactericidal Activity
Xavier A. Kayigire,aSven O. Friedrich,bAmour Venter,cRodney Dawson,dStephen H. Gillespie,eMartin J. Boeree,fNorbert Heinrich,g,h Michael Hoelscher,g,hAndreas H. Diacon,bon behalf of the Pan African Consortium for the Evaluation of Anti-tuberculosis Antibiotics
Division of Molecular Biology and Human Genetics, Department of Biomedical Sciences, Faculty of Medicine and Health Sciences, Stellenbosch University, Cape Town, South Africaa
; Division of Medical Physiology, Department of Biomedical Sciences, Faculty of Medicine and Health Sciences, Stellenbosch University, Cape Town, South Africab
; MRC Centre for Molecular and Cellular Biology, Department of Biomedical Sciences, Faculty of Medicine and Health Sciences, Stellenbosch University, Cape Town, South Africac
; Division of Pulmonology, Department of Medicine, University of Cape Town Lung Institute, Groote Schuur Hospital, Cape Town, South Africad
; School of Medicine, University of St. Andrews School of Medicine North Haugh, St. Andrews, United Kingdome
; Radboud University Nijmegen Medical Centre, Nijmegen, The Netherlandsf
; Division of Infectious Diseases and Tropical Medicine, Medical Centre of the University of Munich (LMU), Munich, Germanyg
; DZIF German Centre for Infection Research, Munich, Germanyh
The early bactericidal activity of antituberculosis agents is usually determined by measuring the reduction of the sputum
myco-bacterial load over time on solid agar medium or in liquid culture. This study investigated the value of a quantitative PCR assay
for early bactericidal activity determination. Groups of 15 patients were treated with 6 different antituberculosis agents or
regi-mens. Patients collected sputum for 16 h overnight at baseline and at days 7 and 14 after treatment initiation. We determined the
sputum bacterial load by CFU counting (log CFU/ml sputum, reported as mean
ⴞ
standard deviation [SD]), time to culture
posi-tivity (TTP, in hours [mean
ⴞ
SD]) in liquid culture, and Xpert MTB/RIF cycle thresholds (
C
T,
n
[mean
ⴞ
SD]). The ability to
discriminate treatment effects between groups was analyzed with one-way analysis of variance (ANOVA). All measurements
showed a decrease in bacterial load from mean baseline (log CFU, 5.72
ⴞ
1.00; TTP, 116.0
ⴞ
47.6;
C
T, 19.3
ⴞ
3.88) to day 7 (log
CFU,
ⴚ0.26
ⴞ
1.23,
P
ⴝ
0.2112; TTP, 35.5
ⴞ
59.3,
P
ⴝ
0.0002;
C
T, 0.55
ⴞ
3.07,
P
ⴝ
0.6030) and day 14 (log CFU,
ⴚ0.55
ⴞ
1.24,
P
ⴝ
0.0006; TTP, 54.8
ⴞ
86.8,
P
<
0.0001;
C
T, 2.06
ⴞ
4.37,
P
ⴝ
0.0020). The best discrimination between group effects was found
with TTP at day 7 and day 14 (
F
ⴝ
9.012,
P
<
0.0001, and
F
ⴝ
11.580,
P
<
0.0001), followed by log CFU (
F
ⴝ
4.135,
P
ⴝ
0.0024,
and
F
ⴝ
7.277,
P
<
0.0001).
C
Twas not significantly discriminative (
F
ⴝ
1.995,
P
ⴝ
0.091, and
F
ⴝ
1.203,
P
ⴝ
0.316, respectively).
Culture-based methods are superior to PCR for the quantification of early antituberculosis treatment effects in sputum.
S
everal novel antituberculosis drugs and regimens are currently
under clinical investigation. The first step in their evaluation is
the measurement of early bactericidal activity (EBA) in sputum
over up to 2 weeks of treatment in smear-positive,
treatment-naive pulmonary tuberculosis patients. The EBA is commonly
de-fined as the mean daily decrease in CFU counted on agar plates
(log CFU) per ml of expectorated sputum (
1
,
2
). Alternatively, the
change in time to culture positivity (TTP) in broth culture can be
measured in the mycobacterial growth indicator tube (MGIT)
sys-tem (Becton, Dickinson, Sparks, MD) (
3
). This is based on the
inverse relationship of the time a culture requires to develop a
critical measure of metabolic activity to the number of viable
bac-teria initially inoculated into the system. TTP in semiautomated
liquid culture has been shown to correlate well with CFU counting
in the first 2 weeks of treatment (
3
–
5
).
The Xpert MTB/RIF assay (Xpert; Cepheid, Sunnyvale, CA) is
a new nucleic acid amplification test (NAAT) detecting
M.
tuber-culosis
complex on sputum specimens with real-time PCR. Xpert
is rapid (less than 1 h of hands-on time), standardized, and easy to
use (
6
,
7
). Its sensitivity to detect
M. tuberculosis
in sputum of
untreated patients suspected of having tuberculosis in
high-bur-den countries is 98% for positive samples and 72% for
AFB-negative specimens with an overall specificity of
⬎
99% (
8
). Xpert
is able to detect as few as 100 organisms per ml
in vitro
suspension
(
9
). It is less well known that Xpert also provides a
semiquantita-tive measurement based on the number of PCR cycles required for
detection of a critical amount of DNA (cycle threshold [
C
T]). It
was repeatedly demonstrated on spiked samples and sputum
sam-ples collected from untreated tuberculosis patients that the
quan-titative
C
Treadouts from Xpert correlate with (semi)quantitative
results of conventional microbiological tests such as smear
mi-croscopy grade, liquid culture TTP, and solid-culture CFU counts
(
9
–
13
).
As a platform for quantifying
M. tuberculosis
in sputum, Xpert
could make EBA studies less costly, more reproducible, and
tech-nically more accessible if the change in
C
Tis a reliable measure of
treatment effects. However, it is unclear how DNA load correlates
with culture-based quantification of viable bacteria in patients
being treated for tuberculosis. To investigate this question, we
performed a prospective study to compare the ability of log CFU,
TTP, and Xpert
CT
to monitor and distinguish between treatment
effects in a 14-day EBA study with 6 parallel groups receiving
different antituberculosis treatments.
MATERIALS AND METHODS
Sample collection and ethics.Sputum samples were collected during a 14-day early bactericidal activity study from untreated adult pulmonary
Received13 December 2012Returned for modification17 January 2013 Accepted7 April 2013
Published ahead of print17 April 2013
Address correspondence to Andreas H. Diacon, [email protected].
Copyright © 2013, American Society for Microbiology. All Rights Reserved. doi:10.1128/JCM.03290-12
on May 16, 2020 by guest
http://jcm.asm.org/
tuberculosis patients. Participants were required to be smear positive (ⱖ1⫹; WHO/IUATLD scale [14]) and free of severe comorbidities. HIV-positive patients with a CD4 count of⬍250/l and those on antiretroviral therapy were excluded. From December 2010 until August 2011, 90 pa-tients (59% male; 10% HIV positive; median age, 30.4 years) were hospi-talized at one of two centers in Cape Town, South Africa (University of Cape Town Lung Institute, Mowbray; Task Applied Science, Intercare, Durbanville) and randomized to one of six equally sized groups that were treated with different dosages and/or combinations of two antituberculo-sis agents. All patients’ isolates were susceptible to the treatment given. Spontaneously expectorated sputum was collected for 16 h overnight, refrigerated after collection, and transported to the central study labora-tory (Centre of Clinical Tuberculosis Research, Department of Biomedi-cal Sciences, Stellenbosch University). Specimens were allowed to warm up to room temperature before homogenization for 30 min with a mag-netic stirrer and processing. The institutional ethical committees and the Medicines Control Council (MCC) granted approval for the main study and this substudy.
Determination of log CFU.A maximum of 10 ml of homogenized sputum was digested by addition of an equal volume of 0.1% dithiothre-itol (Sputasol; Oxoid, Cambridge, United Kingdom) for 20 min. Sterile saline (0.85%) containing 0.01% Tween was used to generate 10-fold serial dilutions. A volume of 100l of every dilution was incubated on each half of two selective agar plates containing Middlebrook 7H11 agar enriched with Middlebrook OADC (oleic acid-albumin-dextrose-cata-lase; Becton, Dickinson) and Selectatab (Mast; Bootle, Merseyside, United Kingdom) containing polymyxin B sulfate (200,000 units/liter), ampho-tericin B (10 mg/liter), ticarcillin (100 mg/liter), and trimethoprim (10 mg/liter). The plates were incubated at 37°C for 3 to 4 weeks before nies were counted on the dilution that yielded between 20 and 200 colo-nies. These data were log transformed to provide log CFU.
Determination of TTP.Five ml of digested sputum was mixed with an equal volume of 2% NaOH (BBL Mycoprep; Becton, Dickinson) and decontaminated for 20 min at room temperature. This mixture was neu-tralized by addition of sterile phosphate-buffered saline (PBS, pH 6.8; Becton, Dickinson) to a final volume of 45 ml and centrifuged for 15 min at 3,000⫻gand 4°C. The supernatant was discarded and the pellet resus-pended with PBS to a final volume of 2 ml. Two MGITs for each specimen were prepared by addition of 0.8 ml PANTA (polymyxin B, amphotericin B, nalidixic acid, trimethoprim, and azlocillin) mixed with OADC (Bec-ton, Dickinson). Each MGIT was inoculated with 0.5 ml of resuspended pellet and incubated at 37°C in a Bactec MGIT960 instrument. Cultures that were flagged as positive were tested for contamination by placing one drop on a blood agar plate (NHLS, Cape Town, South Africa) and incu-bating at 37°C for 48 h. The presence of acid-fast bacilli (AFB) in positive liquid culture was confirmed by Ziehl-Neelsen staining and microscopy; only TTPs from AFB positive and noncontaminated cultures were used for analysis.
Xpert MTB/RIF assay.An aliquot of digested sputum sample (1 to 2 ml) was frozen at⫺80°C at the time of culture processing. After thawing, the specimen was resuspended by vortexing, and 1 ml was used according to the instructions of the manufacturer. Briefly, the diluted sample was mixed with 2 ml of Xpert sample reagent, inverted 10 times, and incubated for 15 min at room temperature; inversion was repeated after the first 8 min. This mixture was then transferred into an Xpert cartridge and loaded into the GeneXpert instrument, which conducts all necessary steps auto-matically using GeneXpert Dx software (version 4.0; Cepheid). The soft-ware reports results asCTs, which represent the number of PCR cycles needed to reach a detection threshold; theCTof probe B was used for all analyses according to previously published data (6).
Analysis plan.From the sputum samples available from the EBA study, we prospectively selected the two baseline samples collected on the days directly preceding the treatment initiation and those collected after 7 and 14 days of treatment, when we expected treatment effects to emerge. We analyzed the data in a stepwise fashion. First, we studied the baseline samples to gain an impression of the variation of the measurements with-out treatment effects. Second, individual values were plotted against one another and inspected for correlation. Next, we examined the correlation of individual treatment activities for all measurements. Finally, we quan-tified the treatment effects and the respective ability of the measurements to differentiate between treatment groups by comparing variation within the groups to the variation between the groups for the periods from 0 to 7 days and 0 to 14 days.
Statistical methods.The group sample size of 15 patients and study duration of 14 days were predetermined by the parent EBA study. Corre-lations between the methods of detection were quantified with the Spear-man rank sum test. Treatment activity was calculated as the arithmetic difference between the means of the baseline values (also termed day 0 values) and the values obtained after 7 or 14 days, first for each individual and then as an average to obtain a group result. The significance of treat-ment effects within groups from day 0 to 7 or day 0 to 14 was determined by Student’sttest. Variance within groups and between groups was com-pared withFstatistics (one-way analysis of variance [ANOVA]). The larger theFstatistic is, the better the chance that a measurement can differentiate group effects. APvalue of⬍0.05 was considered statistically significant.
RESULTS
Log CFU, TTP, and
C
T.
Out of a possible 360 values, 304 log CFU
(84.4%), 341 TTP (94.7%), and 317
C
T(88.1%) results were
ob-tained. The missing values were due to contamination, no growth,
no sample being received, or invalid results. There was no
signif-icant difference between groups regarding the proportions of
available data or the magnitude of the mean baseline values. The
day-to-day variance estimated using the baseline values within
0 1 2 3 4 5 6 7 8
0 50 100 150 200 250 300 350 400
logCFU
TTP
(h
)
0 1 2 3 4 5 6 7 8
0 5 10 15 20 25 30 35 40
logCFU CT
0 100 200 300 400 500 600 700 800 0
5 10 15 20 25 30 35 40
TTP (h) CT
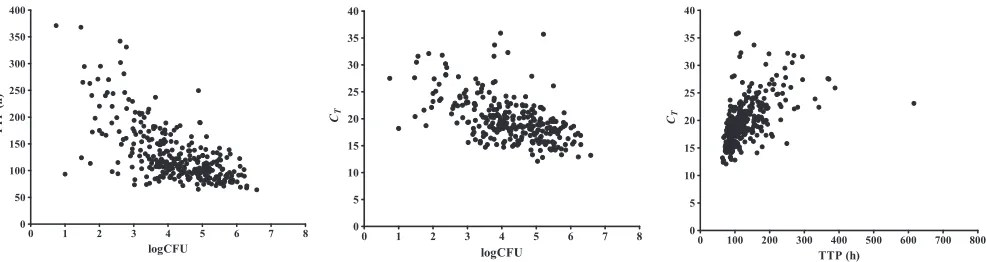
FIG 1Individual log CFU, TTP, andCTvalues are shown for all patients and time points combined. Rho values were calculated by the Spearman rank sum test for log CFU versus TTP (rho⫽ ⫺0.613;P⬍0.0001), log CFU versusCT(rho⫽ ⫺0.547;P⬍0.0001), and TTP versusCT(rho⫽0.632;P⬍0.0001).
on May 16, 2020 by guest
http://jcm.asm.org/
[image:2.585.48.541.66.197.2]subjects was compared with the total baseline variance to give
ratios of 0.1621/0.9853 (0.165) for log CFU, 748.7/3448.5 (0.220)
for TTP, and 12.25/6.94 (0.567) for
C
T. While 16.5% and 22% are
similar, the value of 56.7% for
C
Tsuggests a larger day-to-day
variability and smaller between-subject variability for
C
Tthan for
the culture-based measurements, log CFU count and TTP.
Indi-vidual log CFU, TTP, and
C
Tvalues were moderately correlated at
baseline, day 7, and day 14 and are illustrated in
Fig. 1
.
Treatment effects measured with log CFU, TTP, and C
T.
In-dividual treatment effects were strongly correlated between log
CFU and TTP; log CFU and
C
Tand TTP and
C
Twere moderately
correlated (
Fig. 2
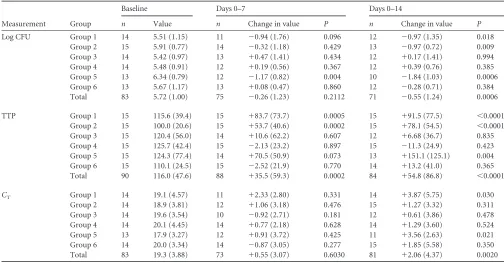
). All three measurements showed an overall
de-crease from baseline, which was significant for TTP at day 7 and
for all three measurements at day 14 (
Table 1
;
Fig. 3
). A significant
difference between baseline and day 7 and/or day 14 was found in
4 groups with log CFU, in 5 groups with TTP, and in 2 groups with
C
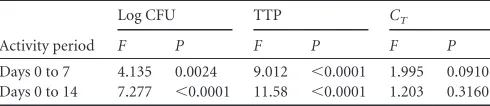
T. The real test for discrimination between treatment effects at
day 7 and day 14 is shown in
Table 2
. One-way ANOVA delivered
the greatest
F
values for TTP, indicating that liquid culture had the
most favorable ratio of within-group to between-group variation
to discriminate between groups for treatment effects at day 7 and
day 14. Log CFU from solid culture medium displayed acceptable
discriminatory ability, while quantitative PCR, represented by
Xpert
C
T, was relatively poor.
DISCUSSION
This prospective study directly compared three different methods
for the quantification of the mycobacterial load in sputum
speci-mens collected 7 and 14 days after initiation of antituberculosis
treatment. All three methods were able to demonstrate an average
-4 -2 0 2 4
-100 0 100 200 300
Delta logCFU
D
el
ta
TTP
-4 -2 0 2
-10 0 10 20
Delta logCFU
De
lt
a
CT
-200 0 200 400 600
-10 0 10 20
Delta TTP
De
lt
a
CT
[image:3.585.45.543.66.197.2]FIG 2Individual activities of log CFU, TTP, andCTfrom day 0 to day 14 are plotted against each other. A strong correlation was found between log CFU and TTP (rho⫽ ⫺0.726;P⬍0.0001), and a moderate correlation was found between log CFU andCT(rho⫽ ⫺0.385;P⫽0.0017) and TTP andCT(rho⫽0.400; P⫽0.0004).
TABLE 1Treatment effects measured with log CFU, TTP, andCTa
Measurement Group
Baseline Days 0–7 Days 0–14
n Value n Change in value P n Change in value P
Log CFU Group 1 14 5.51 (1.15) 11 ⫺0.94 (1.76) 0.096 12 ⫺0.97 (1.35) 0.018
Group 2 15 5.91 (0.77) 14 ⫺0.32 (1.18) 0.429 13 ⫺0.97 (0.72) 0.009
Group 3 14 5.42 (0.97) 13 ⫹0.47 (1.41) 0.434 12 ⫹0.17 (1.41) 0.994
Group 4 14 5.48 (0.91) 12 ⫹0.19 (0.56) 0.367 12 ⫹0.39 (0.76) 0.385
Group 5 13 6.34 (0.79) 12 ⫺1.17 (0.82) 0.004 10 ⫺1.84 (1.03) 0.0006
Group 6 13 5.67 (1.17) 13 ⫹0.08 (0.47) 0.860 12 ⫺0.28 (0.71) 0.384
Total 83 5.72 (1.00) 75 ⫺0.26 (1.23) 0.2112 71 ⫺0.55 (1.24) 0.0006
TTP Group 1 15 115.6 (39.4) 15 ⫹83.7 (73.7) 0.0005 15 ⫹91.5 (77.5) ⬍0.0001
Group 2 15 100.0 (20.6) 15 ⫹53.7 (40.6) 0.0002 15 ⫹78.1 (54.5) ⬍0.0001
Group 3 15 120.4 (56.0) 14 ⫹10.6 (62.2) 0.607 12 ⫹6.68 (36.7) 0.835
Group 4 15 125.7 (42.4) 15 ⫺2.13 (23.2) 0.897 15 ⫺11.3 (24.9) 0.423
Group 5 15 124.3 (77.4) 14 ⫹70.5 (50.9) 0.073 13 ⫹151.1 (125.1) 0.004
Group 6 15 110.1 (24.5) 15 ⫺2.52 (21.9) 0.770 14 ⫹13.2 (41.0) 0.365
Total 90 116.0 (47.6) 88 ⫹35.5 (59.3) 0.0002 84 ⫹54.8 (86.8) ⬍0.0001
CT Group 1 14 19.1 (4.57) 11 ⫹2.33 (2.80) 0.331 14 ⫹3.87 (5.75) 0.030
Group 2 14 18.9 (3.81) 12 ⫹1.06 (3.18) 0.476 15 ⫹1.27 (3.32) 0.311
Group 3 14 19.6 (3.54) 10 ⫺0.92 (2.71) 0.181 12 ⫹0.61 (3.86) 0.478
Group 4 14 20.1 (4.45) 14 ⫹0.77 (2.18) 0.628 14 ⫹1.29 (3.60) 0.524
Group 5 13 17.9 (3.27) 12 ⫹0.91 (3.72) 0.425 11 ⫹3.56 (2.63) 0.021
Group 6 14 20.0 (3.34) 14 ⫺0.87 (3.05) 0.277 15 ⫹1.85 (5.58) 0.350
Total 83 19.3 (3.88) 73 ⫹0.55 (3.07) 0.6030 81 ⫹2.06 (4.37) 0.0020
aBaseline values are means⫾standard deviations. AllPvalues were calculated using unpaired Student’sttest.n, number of patients with measurements.
on May 16, 2020 by guest
http://jcm.asm.org/
[image:3.585.39.543.453.716.2]decrease of the mycobacterial sputum load. TTP in liquid culture
detected treatment effects earlier and more frequently than the
other methods, and it discriminated best between treatment
groups. CFU counting on agar plates was comparable to TTP.
Both culture-based methods had discriminatory power that was
clearly superior to that of real-time PCR.
Why does PCR in the form of standardized Xpert
C
Tperform
so poorly in the detection of early treatment effects? This can be
explained by the ability of Xpert to detect DNA from whole but
metabolically inactive or dead bacteria or even free DNA causing
false-positive signals. For establishing the diagnosis of
tuberculo-sis, a high sensitivity is an advantage because the presence of
my-cobacterial DNA in sputum is associated with disease, and it does
not matter whether the DNA detected comes from viable or dead
bacteria. For monitoring of treatment effects, however, the
dis-tinction between DNA contained in viable mycobacteria and
DNA originating from other sources becomes critical, because
bacteria killed by antituberculosis treatment are subsequently
ex-pectorated in sputum, and it is known that mycobacterial DNA
survives for an extended period (
15
). This does not encourage the
hope that Xpert could emerge as a treatment-monitoring tool for
the HIV-positive, smear-negative tuberculosis patients frequently
encountered in countries such as South Africa. A modified
proto-col for Xpert intended to exclude DNA from nonviable
mycobac-teria from the reaction could remedy this problem, and research in
this area is ongoing (
16
).
The analysis reported here is based on a single study of only 14
days’ duration with only 4 time points assayed. We are confident,
however, that the results are valid, since TTP and
C
Twere similarly
well correlated in a previous study at our laboratory with 74
spu-tum samples collected before treatment (rho
⫽
0.539; present
study, rho
⫽
0.632) (
13
). Also, merged data from five different
EBA studies revealed very similar correlations between 7-day
treatment activities determined by TTP and log CFU (rho
⫽
0.649; present study, rho
⫽ ⫺
0.673) (
4
).
In conclusion, our results demonstrate that culture-based
methods remain the standard for measuring the decline of sputum
bacterial load during the early phase of antituberculosis
treat-ment. The Xpert’s easy handling and quick results do not
com-pensate for its low discriminatory power between groups with
different treatments. Measures that reduce contamination with
DNA from nonviable bacteria might transform the value of this
technique.
ACKNOWLEDGMENTS
We thank all patients for participation in this study and the staff from the Centre of Clinical Tuberculosis Research (CCTR) for technical assistance. This study was conducted as an activity of the Pan African Consortium for the Evaluation of Anti-tuberculosis Antibiotics (PanACEA). PanACEA is funded by EDCTP grants CT.2004.32011.001, IP.2007.32011.011, IP.2007.32011.012, and IP.2007.32011.013, the Bill and Melinda Gates Foundation, the UK Medical Research Council, and the German Ministry of Science and Technology (BmBF; grant 01KA0901). A specific Ph.D. stipend was given by PanACEA to X. A. Kayigire to foster local career development.
The Pan African Consortium for the Evaluation of Anti-tuberculosis Antibiotics (PanACEA) comprises the following individuals and institu-tions: Medical Centre of the University of Munich, Munich, Germany (Sonja Henne and Anna Maria Mekota, Norbert Heinrich, Andrea Ra-chow, Anke Kohlenberg, Elmar Saathoff, and Michael Hoelscher); Uni-versity of St. Andrews, St Andrews, United Kingdom (Stephen Gillespie); Radboud University Nijmegen Medical Centre, Nijmegen, the Nether-lands (Georgette Plemper van Balen, Marloes Weijers, Rob Aarnoutse, and Martin Boeree); University College of London, London, United
King-Group 1 Group 2 Group 3 Group 4 Group 5 Group 6
logCFU
2 4 6 8
BL D7 D14
*
2 4 6 8
BL D7 D14
*
2 4 6 8
BL D7 D14 2
4 6 8
BL D7 D14 2 4 6 8
BL D7 D14
* **
2 4 6 8
BL D7 D14
TTP
100 200 300 400
BL D7 D14
** ***
100 200 300 400
BL D7 D14 ** ***
100 200 300 400
BL D7 D14 100 200 300 400
BL D7 D14
100 200 300 400
BL D7 D14 *
100 200 300 400
BL D7 D14
CT 10 15 20 25 30
BL D7 D14
* 10 15 20 25 30
BL D7 D14 10 15 20 25 30
BL D7 D14 10 15 20 25 30
BL D7 D14 10 15 20 25 30
BL D7 D14
* 10 15 20 25 30
BL D7 D14
[image:4.585.45.543.67.266.2]FIG 3The mean change from baseline (SDs are shown as vertical bars) of log CFU, TTP, andCTafter 7 and 14 days of treatment is shown for all six groups. Significantly different measurements for days 0 to 7 or days 0 to 14 were found for TTP in 2 and 3, for log CFU in 1 and 3, and forCTin 0 and 2 groups, respectively. Statistically significant differences between time points are indicated by asterisks (*⫽P⬍0.05, **⫽P⬍0.001, ***⫽P⬍0.0001, BL⫽baseline, D7⫽day 7, D14⫽day 14).
TABLE 2Discrimination between treatment effectsa
Activity period
Log CFU TTP CT
F P F P F P
Days 0 to 7 4.135 0.0024 9.012 ⬍0.0001 1.995 0.0910 Days 0 to 14 7.277 ⬍0.0001 11.58 ⬍0.0001 1.203 0.3160
aOne-way ANOVA was used for treatment activities over 7 days and 14 days measured
with log CFU, TTP, andCT. GreaterFvalues represent a better ability to discriminate
between groups for treatment effects (there were 6 treatment groups for each period).
on May 16, 2020 by guest
http://jcm.asm.org/
[image:4.585.41.286.644.697.2]dom (Anna Bateson, Timothy McHugh, Kasha Singh, Robert Hunt, and Alimuddin Zumla); MRC Clinical Trials Unit, London, United Kingdom (Andrew Nunn and Patrick Phillips); University of Cape Town, Cape Town, South Africa (Rodney Dawson and Kim Narunsky); University of Stellenbosch, Cape Town, South Africa (Andreas Diacon, Jeannine du Bois, Amour Venter, and Sven Friedrich); University of the Witswa-tersrand, Johannesburg, South Africa (Ian Sanne, Karla Mellet, and Eefje de Jong); The Aurum Institute, Johannesburg, South Africa (Gavin Churchyard and Salome Charalambous); University of Zambia, Lusaka, Zambia (Peter Mwaba); NIMR-Mbeya Medical Research Centre, Mbeya, Tanzania (Nyanda Elias, Chacha Mangu, Gabriel Rojas-Ponce, Bariki Mtafya, and Leonard Maboko); Ifakara Health Institute-Bagamoyo Re-search and Training Centre, Bagamoyo, Tanzania (Klaus Reither and Levan Jugheli); Kilimanjaro Clinical Research Institute, Moshi, Tanzania (Noel Sam, Gibson Kibiki, Hadija Semvua, and Stellah Mpagama); Med-ical Research Unit—Albert Schweitzer Hospital, Lambarene, Gabon (Af-satou Traore and Ayola Akim Adegnika); Kenya Medical Research Insti-tute, Nairobi, Kenya (Evans Amukoye); Makerere University, Kampala, Uganda (Alphonse Okwera).
No author has a conflict of interest to state.
REFERENCES
1.Hong Kong Chest Service.1987. Five-year follow-up of a controlled trial of five 6-month regimens of chemotherapy for pulmonary tuberculosis. Am. Rev. Respir. Dis.136:1339 –1342.
2.Jindani A, Aber VR, Edwards EA, Mitchison DA. 1980. The early bactericidal activity of drugs in patients with pulmonary tuberculosis. Am. Rev. Respir. Dis.121:939 –949.
3.Pheiffer C, Carroll NM, Beyers N, Donald P, Duncan K, Uys P, Van Helden P.2008. Time to detection of Mycobacterium tuberculosis in BACTEC systems as a viable alternative to colony counting. Int. J. Tuberc. Lung Dis.12:792–798.
4.Diacon AH, Maritz JS, Venter A, Van Helden PD, Dawson R, Donald PR.2012. Time to liquid culture positivity can substitute for colony counting on agar plates in early bactericidal activity studies of antituber-culosis agents. Clin. Microbiol. Infect.18(7):711–717.
5.Hesseling AC, Walzl G, Enarson DA, Carroll NM, Duncan K, Lukey PT, Lombard C, Donald PR, Lawrence KA, Gie RP, Van Helden PD, Beyers N.2010. Baseline sputum time to detection predicts month two culture conversion and relapse in non-HIV-infected patients. Int. J. Tu-berc. Lung Dis.14:560 –570.
6.Blakemore R, Story E, Helb D, Kop J, Banada P, Owens MR, Chakra-vorty S, Jones M, Alland D.2010. Evaluation of the analytical perfor-mance of the Xpert MTB/RIF assay. J. Clin. Microbiol.48:2495–2501.
7.Helb D, Jones M, Story E, Boehme C, Wallace E, Ho K, Kop J, Owens MR, Rodgers R, Banada P, Safi H, Blakemore R, Lan NT, Jones-Lopez EC, Levi M, Burday M, Ayakaka I, Mugerwa RD, McMillan B, Winn-Deen E, Christel L, Dailey P, Perkins MD, Persing DH, Alland D.2010. Rapid detection of Mycobacterium tuberculosis and rifampin resistance by use of on-demand, near-patient technology. J. Clin. Microbiol.48: 229 –237.
8.Boehme CC, Nabeta P, Hillemann D, Nicol MP, Shenai S, Krapp F, Allen J, Tahirli R, Blakemore R, Rustomjee R, Milovic A, Jones M, O’Brien SM, Persing DH, Ruesch-Gerdes S, Gotuzzo E, Rodrigues C, Alland D, Perkins MD.2010. Rapid molecular detection of tuberculosis and rifampin resistance. N. Engl. J. Med.363:1005–1015.
9.Van Zyl-Smit RN, Binder A, Meldau R, Mishra H, Semple PL, Theron G, Peter J, Whitelaw A, Sharma SK, Warren R, Bateman ED, Dheda K. 2011. Comparison of quantitative techniques including Xpert MTB/RIF to evaluate mycobacterial burden. PLoS One6:e28815.
10. Rachow A, Zumla A, Heinrich N, Rojas-Ponce G, Mtafya B, Reither K, Ntinginya EN, O’Grady J, Huggett J, Dheda K, Boehme C, Perkins M, Saathoff E, Hoelscher M.2011. Rapid and accurate detection of Myco-bacterium tuberculosisin sputum samples by Cepheid Xpert MTB/RIF assay-A clinical validation study. PLoS One6(6):e20458.
11. Theron G, Peter J, Van Zyl-Smit R, Mishra H, Streicher E, Murray S, Dawson R, Whitelaw A, Hoelscher M, Sharma S, Pai M, Warren R, Dheda K.2011. Evaluation of the Xpert MTB/RIF assay for the diagnosis of pulmonary tuberculosis in a high HIV prevalence setting. Am. J. Respir. Crit. Care Med.184:132–140.
12. Blakemore R, Nabeta P, Davidow AL, Vadwai V, Tahirli R, Munsamy V, Nicol M, Jones M, Persing DH, Hillemann D, Ruesch-Gerdes S, Leisegang F, Zamudio C, Rodrigues C, Boehme CC, Perkins MD, Alland D.2011. A multisite assessment of the quantitative capabilities of the Xpert MTB/RIF assay. Am. J. Respir. Crit. Care Med.184:1076 –1084. 13. Friedrich SO, Venter A, Kayigire XA, Dawson R, Donald PR, Diacon AH.2011. Suitability of Xpert MTB/RIF and Genotype MTBDRplus for patient selection for a tuberculosis clinical trial. J. Clin. Microbiol.49: 2827–2831.
14. International Union Against Tuberculosis and Lung Dis.2000. Tech-nical guide: Sputum examination for tuberculosis by direct microscopy in low income countries. 5th edition.
15. Kennedy N, Gillespie SH, Saruni AO, Kisyombe G, McNerney R, Ngowi FI, Wilson S.1994. Polymerase chain reaction for assessing treatment response in patients with pulmonary tuberculosis. J. Infect. Dis.170:713– 716.
16. Miotto P, Bigoni S, Migliori GB, Matteelli A, Cirillo DM.2012. Early tuberculosis treatment monitoring by Xpert(R) MTB/RIF. Eur. Respir. J. 39:1269 –1271.