Frequency of beryllium-specific, central
memory CD4
+
T cells in blood determines
proliferative response
Andrew P. Fontenot, … , Lee S. Newman, Brian L. Kotzin
J Clin Invest.
2005;
115(10)
:2886-2893.
https://doi.org/10.1172/JCI24908
.
Beryllium exposure can lead to the development of beryllium-specific CD4
+T cells and
chronic beryllium disease (CBD), which is characterized by the presence of lung
granulomas and a CD4
+T cell alveolitis. Studies have documented the presence of
proliferating and cytokine-secreting CD4
+T cells in blood of CBD patients after beryllium
stimulation. However, some patients were noted to have cytokine-secreting CD4
+T cells in
blood in the absence of beryllium-induced proliferation, and overall, the correlation between
the 2 types of responses was poor. We hypothesized that the relative proportion of memory
T cell subsets determined antigen-specific proliferation. In most CBD patients, the majority
of beryllium-specific CD4
+T cells in blood expressed an effector memory T cell maturation
phenotype. However, the ability of blood cells to proliferate in the presence of beryllium
strongly correlated with the fraction expressing a central memory T cell phenotype. In
addition, we found a direct correlation between the percentage of beryllium-specific CD4
+T
EMcells in blood and T cell lymphocytosis in the lung. Together, these findings indicate
that the functional capability of antigen-specific CD4
+T cells is determined by the relative
proportion of memory T cell subsets, which may reflect internal organ involvement.
Research Article
Immunology
Find the latest version:
Frequency of beryllium-specific,
central memory CD4
+
T cells in blood
determines proliferative response
Andrew P. Fontenot,1,2 Brent E. Palmer,1 Andrew K. Sullivan,1 Fenneke G. Joslin,1
Cara C. Wilson,1,2 Lisa A. Maier,1,3,4 Lee S. Newman,1,3,4 and Brian L. Kotzin1,2,4
1Department of Medicine, 2Department of Immunology, and 3Department of Preventive Medicine and Biometrics, University of Colorado Health Sciences Center,
Denver, Colorado, USA. 4Department of Medicine, National Jewish Medical and Research Center, Denver, Colorado, USA.
Beryllium exposure can lead to the development of beryllium-specific CD4
+T cells and chronic beryllium
disease (CBD), which is characterized by the presence of lung granulomas and a CD4
+T cell alveolitis. Studies
have documented the presence of proliferating and cytokine-secreting CD4
+T cells in blood of CBD patients
after beryllium stimulation. However, some patients were noted to have cytokine-secreting CD4
+T cells in
blood in the absence of beryllium-induced proliferation, and overall, the correlation between the 2 types of
responses was poor. We hypothesized that the relative proportion of memory T cell subsets determined
anti-gen-specific proliferation. In most CBD patients, the majority of beryllium-specific CD4
+T cells in blood
expressed an effector memory T cell maturation phenotype. However, the ability of blood cells to proliferate
in the presence of beryllium strongly correlated with the fraction expressing a central memory T cell
pheno-type. In addition, we found a direct correlation between the percentage of beryllium-specific CD4
+T
EMcells
in blood and T cell lymphocytosis in the lung. Together, these findings indicate that the functional capability
of antigen-specific CD4
+T cells is determined by the relative proportion of memory T cell subsets, which may
reflect internal organ involvement.
Introduction
With a known antigen and an accessible target organ, chronic beryl-lium disease (CBD) serves as an important model of an organ-spe-cific immune-mediated disease. This disorder occurs in susceptible individuals exposed to beryllium in the workplace, and more than 1 million workers are at risk for the development of CBD (1–5). Beryl-lium sensitization is associated with the presence of circulating beryllium-specific CD4+ T cells, which proliferate in the presence
of beryllium salts in culture in an MHC class II–restricted manner (6–10). The in vitro response forms the basis of the beryllium lym-phocyte proliferation test (BeLPT), which is currently used to detect beryllium sensitization in the workplace (11–13). Progression from sensitization to CBD occurs at a rate of 6–8% per year (14) and is characterized by the accumulation of large numbers of beryllium-specific, Th1-type cytokine–secreting CD4+ T cells in the lung and
granulomatous inflammation. Important differences exist between antigen-specific T cells that reside in the lung and those present in the circulation. For example, beryllium-specific memory CD4+ T
cells in blood remain dependent on CD28 engagement for optimal T cell activation, while the memory CD4+ T cells present in
bron-choalveolar lavage (BAL) no longer require CD28 costimulation for either proliferation or Th1-type cytokine secretion; this suggests a maturation within the memory CD4+ T cell population (15).
Using ELISPOT analysis, we found significant numbers of IFN-γ– secreting CD4+ T cells when peripheral blood cells from CBD
patients were stimulated with beryllium salts in culture (16). The correlation between cytokine secretion and proliferative responses was poor. Furthermore, we identified 13 subjects with beryllium-specific, IFN-γ–secreting T cells in blood yet no beryllium-induced lymphoproliferation. These findings suggested that low beryl-lium-induced proliferation with cells from some CBD patients is due to a different proliferative capacity rather than the absence of beryllium-specific CD4+ T cells. We hypothesized that this reduced
proliferative response might parallel differences in memory T cell maturation. Recent studies suggest that memory T cells of differ-ent maturation states possess differdiffer-ent migratory and functional capabilities (17, 18). Based on the expression of the lymph node homing receptor CCR7 and the CD45RA isoform, at least 2 sub-sets of memory cells exist (17–21). Central memory T (TCM) cells
have lost the expression of CD45RA while retaining CCR7 expres-sion. Retention of CCR7 expression renders cells capable of enter-ing lymph nodes and recirculatenter-ing between blood and lymph (22). In contrast, effector memory T (TEM) cells have downregulated the
expression of both CD45RA and CCR7 and migrate to and reside in target organs such as the lung. TCM cells appear capable of
differen-tiating into TEM cells upon restimulation. Based on this paradigm,
TEM and TCM cells are thought to play complementary roles when
reexposed to antigen. The TEM cells provide rapid effector function
within the target organ, while the TCM cells proliferate in the lymph
node, generating increased numbers of effector cells (17, 18). In this study, we analyzed the Th1-type cytokine profile, prolifera-tive capacity, and maturation phenotype of beryllium-specific CD4+
T cells in blood and BAL of CBD and beryllium-sensitized (BeS) subjects. No correlation between the frequencies of beryllium-spe-cific, Th1-type cytokine–expressing CD4+ T cells in blood and
beryl-lium-induced T cell proliferation in culture was seen. The majority of beryllium-specific CD4+ T cells in blood and BAL expressed a
Nonstandard abbreviations used: BAL, bronchoalveolar lavage; BeLPT, beryllium lymphocyte proliferation test; BeS, beryllium-sensitized; BeSO4, beryllium sulfate;
CBD, chronic beryllium disease; SEB, staphylococcal enterotoxin B; TCM, central
memory T (cell); TEM, effector memory T (cell).
Conflict of interest: The authors have declared that no conflict of interest exists. Citation for this article: J. Clin. Invest. 115:2886–2893 (2005).
research article
TEM cell phenotype, and we observed a correlation between
percent-age of beryllium-specific TEM cells in blood and lymphocytosis in
BAL. In contrast, proliferation of blood CD4+ T cells in response
to beryllium was closely tied to the proportion of antigen-specific cells expressing a TCM phenotype. These results suggest that the
functional properties of the beryllium-specific CD4+ T cell in blood
are determined by the relative proportion of memory T cell subsets, which is influenced by the degree of target organ inflammation.
Results
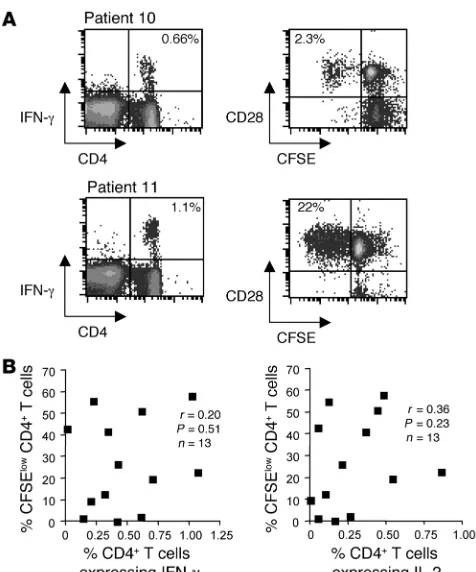
Lack of correlation between proliferating and cytokine-secreting responses after stimulation of blood CD4+ T cells with beryllium. Our previous
studies have detected the presence of beryllium-specific, cytokine-producing CD4+ T cells in the blood of some CBD patients in the
absence of a beryllium-induced proliferative response (16). These findings raise the possibility that patients may have different subsets of beryllium-specific memory T cells in blood. To further assess this possibility, fresh PBMCs from 13 CBD patients were CFSE-labeled and cultured in the presence of medium alone or 1 × 10⁻⁴ M beryllium sulfate (BeSO
4) for 7 days. At the same time
point, the frequency of beryllium-specific, Th1-type cytokine– expressing CD4+ T cells in blood was determined. Two
representa-tive examples of patient responses are shown in Figure 1A. The fre-quency of beryllium-specific, IFN-γ–secreting CD4+ T cells in the
blood of patients 10 and 11 was 0.66% and 1.1%, respectively (Fig-ure 1A). Marked differences in the ability of the beryllium-specific CD4+ T cells from these 2 subjects to proliferate (i.e., lose CFSE
expression) after BeSO4 exposure were noted. For example, 22%
of the CD28+CD4+ T cells from patient 11 underwent
beryllium-induced proliferation (CFSE low) after 7 days of culture compared with only 2.3% for patient 10 (Figure 1A). Nearly all proliferating CD4+ T cells expressed the costimulatory molecule CD28 (15).
Overall, we observed no correlation between the ability of CD4+ T
cells to proliferate (i.e., percentage CFSE-low cells) and their ability to generate IFN-γ (r = 0.20; P = 0.51) or IL-2 (r = 0.36; P = 0.23) when stimulated with BeSO4 (Figure 1B). Consistent with the lack of
correlation, 3 subjects with substantial populations of beryllium-responsive, Th1-type cytokine–expressing CD4+ T cells in blood
(ranging from 0.14% to 0.66% of total blood CD4+ T cells)
dem-onstrated minimal beryllium-induced T cell proliferation (Figure 1B). On the other hand, 2 subjects had vigorous beryllium-induced proliferation despite low numbers of beryllium-induced, cytokine-secreting CD4+ T cells in blood. For example, in 1 CBD patient,
0.2% of ex vivo CD4+ T cells expressed IFN-γ after beryllium
expo-sure, while 55% of CD4+ T cells from this subject exhibited
beryl-lium-induced proliferation after 7 days of culture (Figure 1B).
Characterization of memory CD4+ T cell populations in the blood of
CBD and BeS individuals. Surface staining of blood CD4+ T cells for
CD45RA and CCR7 has identified 3 distinct T cell populations: naive (CCR7+CD45RA+), central memory (TCM; CCR7+CD45RA–),
and effector memory (TEM; CCR7–CD45RA–) T cells. To
deter-mine whether the distribution of these memory cell subsets was altered in our study population, we examined total blood CD4+ T
cell population in 20 CBD, 9 BeS, and 9 normal control subjects for these subpopulations. In Figure 2A, a representative example of immunofluorescent staining is shown, with 49% of the CD4+
T cells expressing a naive phenotype, 40% expressing a TCM
phe-notype, and TEM cells accounting for the remaining 11% of blood
CD4+ T cells. Unlike CD8+ T cells, very few, if any, CD4+ T cells
re-express CD45RA (<0.01% in the example shown) (17). Consid-erable overlap was seen among the study groups in the overall percentages of CD4+ T cells expressing these phenotypes (Figure
2, B–D). Although a slightly higher median TEM percentage was
measured in the CBD group (16.7%) compared with the BeS and normal control subjects (median percentage of 10.8% and 10.5%, respectively), no significant differences were noted.
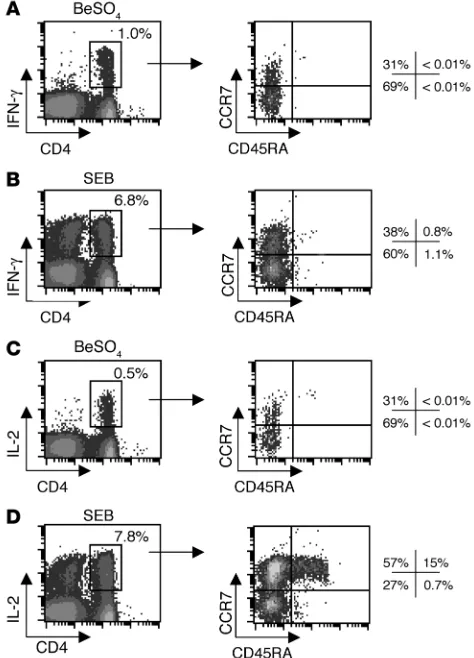
Memory phenotype of beryllium-specific CD4+ T cells. To determine the
maturation state of beryllium-specific CD4+ T cells, we stimulated
PBMCs with 1 × 10⁻⁴ M BeSO
4 for 6 hours and analyzed IFN-γ– and
IL-2–expressing CD4+ T cells for surface expression of CD45RA and
CCR7 (Figure 3). In order to ensure that enough gated events were observed, only subjects with at least 0.04% IFN-γ– and IL-2–secret-ing beryllium-specific CD4+ T cells in blood were studied. For the
CBD patient shown in Figure 3A, 1.0% of the CD4+ T cells expressed
[image:3.585.45.283.80.366.2]IFN-γ after beryllium stimulation. The majority (69%) of these cells
Figure 1
Frequency of beryllium-specific CD4+ T cells in blood and
beryllium-induced CD4+ T cell proliferation. (A) Representative examples of
beryllium-induced intracellular IFN-γ expression from the blood of 2 CBD patients are shown (left density plots). The number in the top right quadrant of the density plots indicates the percentage of CD4+ T cells
expressing IFN-γ after short-term exposure to 1 × 10⁻⁴ M BeSO4.
Beryl-lium-induced proliferation as detected by loss of CFSE labeling (right density plots) after exposure to 1 × 10⁻⁴ M BeSO4 for 7 days in culture
for the same 2 CBD patients is shown. After gating on CD4+ T cells, loss
of CFSE expression in relation to the costimulatory molecule CD28 is shown. The number in the top left quadrant of the density plots indicates the percentage of CD4+ T cells proliferating after 7 days of culture in the
presence of 1 × 10⁻⁴ M BeSO4. (B) Correlation of lymphoproliferation as
measured by loss of CFSE expression on CD4+ T cells and
expressed a TEM cell phenotype, compared with 31% TCM cells. As
expected, the naive CD4+ T cell population did not include
beryl-lium-responsive cytokine-secreting cells. Similar proportions of IFN-γ–expressing CD4+ T
EM and TCM cells were seen after
staphy-lococcal enterotoxin B (SEB) stimulation (Figure 3B) as compared with beryllium stimulation. Few, if any, CD8+ T cells stained
posi-tively for IFN-γ after BeSO4 stimulation, whereas CD8+ cells
capa-ble of IFN-γ secretion were present in the blood of this patient and expressed IFN-γ after SEB stimulation (data not shown).
Analysis of IL-2 secretion in the same individual showed that 0.5% of the CD4+ T cells expressed this cytokine following BeSO4
exposure (Figure 3C). A similar percentage of these cells expressed the TEM, TCM, and naive phenotypes compared with IFN-γ+ cells
generated under the same conditions. However, when cells were stimulated by SEB, the majority of IL-2–expressing cells had a TCM
phenotype (57%), and 15% expressed a naive phenotype (Figure 3D). Thus, SEB stimulation appears to reveal IL-2–producing CD4+ T
cells that are less differentiated (i.e., more TCM cells than TEM cells)
compared with those secreting IFN-γ under the same conditions, being more representative of the total CD4+ T cell population.
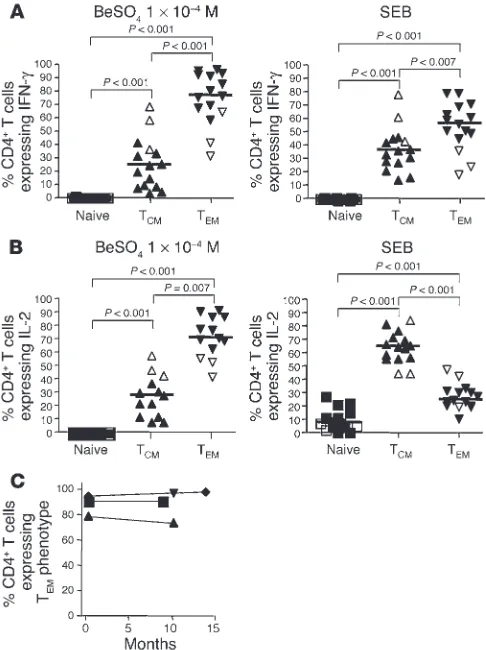
Figure 4 shows the maturation states of IFN-γ– and IL-2–pro-ducing beryllium-specific CD4+ T cells in blood for all CBD
(n = 12) and BeS (n = 3) patients evaluated. Because of the low frequency of beryllium-specific cells in the blood of BeS patients, we identified only 3 BeS individuals with sufficient numbers of
these cells to evaluate using intracellular cytokine staining. The median percentage of beryllium-specific, IFN-γ–expressing CD4+
T cells with a TEM phenotype (76%, range 31–96%) was
signifi-cantly greater than the median percentage of those with either a TCM (24%, range 3.2–69%; P < 0.001) or a naive (0%, range 0–0.7%;
[image:4.585.44.356.82.305.2]P < 0.001) phenotype (Figure 4A, left). Similar findings were seen
Figure 2
Expression of CCR7 and CD45RA on the total CD4+ T cell population. (A) Representative
example of CCR7 and CD45RA expression on gated CD3+CD4+ T cells is shown. (B–D) Naive
(CCR7+CD45RA+) (B), TCM (CCR7+CD45RA–)
(C), and TEM (CCR7–CD45RA–) (D) phenotypes
were assessed on the total CD3+CD4+ T cell
population from 9 normal control subjects, 9 BeS patients, and 20 CBD patients. The median per-centage of CD4+ T cells expressing each
[image:4.585.301.538.411.740.2]matura-tion phenotype is shown as a solid line.
Figure 3
Maturation phenotype staining of beryllium-specific IFN-γ– and IL-2-expressing CD4+ T cells in blood of a representative CBD subject.
Intracellular expression of IFN-γ (A, left) and IL-2 (C, left) after a 6-hour stimulation with 1 × 10⁻⁴ M BeSO4 is shown. In addition, expression
of intracellular IFN-γ (B, left) and IL-2 (D, left) after SEB stimulation is shown. The percentage of CD4+ T cells expressing the various
Th1-type cytokines is shown in the upper right of each density plot. The expression of CCR7 and CD45RA in the IFN-γ–expressing (A and B, right) and IL-2–expressing (C and D, right) CD4+ T cells was then
deter-mined, and the percentage of CD4+ T cells in each quadrant of the
research article
for SEB-stimulated IFN-γ–expressing CD4+ T cells, except that
the median percentage of TEM cells among SEB-stimulated cells
was slightly lower than that among BeSO4-responsive cells (57%
TEM cells, range 19–80%; 38% TCM cells, range 15–79%; P < 0.001)
(Figure 4A, right). We were able to identify 10 CBD patients and 3 BeS subjects with frequencies of at least 0.04% for IL-2–secreting beryllium-specific cells. Again, the majority of these cells expressed a TEM phenotype (72%, range 42–92%) with the remainder being
TCM cells (28%, range 8.2–58%; P < 0.01). On the other hand, as
shown in Figure 4B, the maturation profile for SEB-responsive, IL-2–expressing CD4+ T cells was markedly different, with a
signif-icantly higher median percentage of TCM cells (64%, range 43–83%)
as compared with either TEM (24%, range 10–47%; P < 0.001) or
naive cells (6.8%, range 0–27%; P < 0.001). In order to determine that no change in the maturation phenotype occurred during the 6-hour stimulation, blood from 3 CBD patients was sorted into TCM and TEM subsets and stimulated with either medium alone,
plate-bound anti-CD3 plus 3 µg/ml anti-CD28, or SEB. Despite T cell activation after short-term culture, no change in the memory cell phenotype was seen. For example, the percentage of CD4+ T
CM
cells before and after short-term culture in the presence of SEB was 97% ± 0.1% and 97% ± 0.9%, respectively (data not shown).
Interestingly, there appeared to be a higher proportion of beryl-lium-specific, IFN-γ–expressing cells with a TCM cell phenotype in
the 3 BeS subjects evaluated (open symbols in Figure 4) as com-pared with the CBD patients (59% versus a median of 17% in the CBD patients). A similar pattern was seen for beryllium-induced IL-2 production in the BeS subjects (47% versus a median of 23%
in the CBD patients). Although only 3 BeS subjects had sufficient numbers of beryllium-specific CD4+ T cells in blood to evaluate,
these findings raise the possibility that progression from sensitiza-tion to disease may be associated with a further differentiasensitiza-tion of memory T cells to an effector memory phenotype.
Four CBD patients underwent repeat analysis at time intervals ranging from 7 to 14 months after the initial evaluation (Figure 4C). These subjects experienced no change in their disease status over the interval time period and possessed similar quantities of IFN-γ–expressing beryllium-specific CD4+ T cells at both time
points (data not shown). The median percentage of beryllium-spe-cific CD4+ T cells expressing a T
EM cell phenotype was 92% (range
80–96%) at time 0 compared with 95% (range 75–99%; P = 0.69) at the subsequent evaluation. These findings suggest that in the pres-ence of persistent antigen exposure, the circulating pool of TEM
cells in beryllium disease remains stable over time.
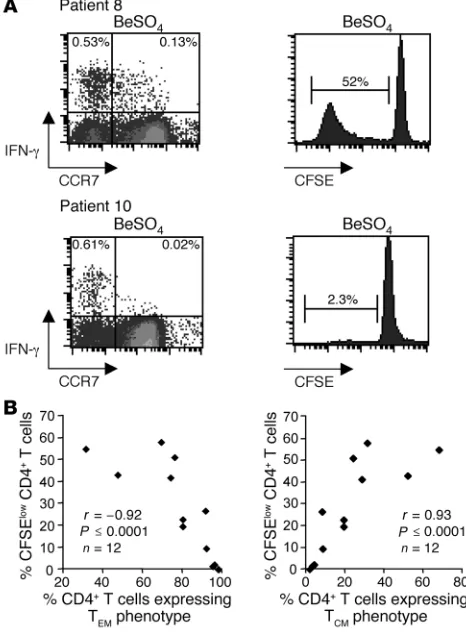
Memory maturation phenotype determines beryllium-induced T cell pro-liferation in blood. To determine whether the memory cell phenotype influenced the ability of CD4+ T cells to divide after BeSO4
expo-sure, PBMCs from 12 CBD patients were stimulated with BeSO4 in
culture for 7 days, and CD4+ T cell proliferation was assessed using
the CFSE-based proliferation assay. As shown in Figure 5A (top left), 20% of the IFN-γ–expressing CD4+ T cells after BeSO4
expo-sure displayed a TCM cell phenotype. After culture of fresh PBMCs
from this individual for 7 days in the presence of 1 × 10⁻⁴ M BeSO4,
52% of CD4+ T cells proliferated compared with after culture with
medium alone. In contrast, only 3.2% of beryllium-induced, IFN-γ– expressing CD4+ T cells from another CBD subject displayed a T
CM
cell phenotype, with the remaining 97% representing beryllium-specific effector memory CD4+ T cells (Figure 5A, bottom left).
Only 2.3% of the CD4+ T cells from this individual proliferated in
response to BeSO4 exposure. Similar findings were seen with respect
to beryllium-induced IL-2 expression. Overall, in 12 CBD subjects, an inverse correlation (r = –0.92; P ≤ 0.0001) was observed between the percentage of beryllium-stimulated proliferating cells and the percentage of beryllium-specific CD4+ T cells expressing a T
EM
phe-notype ex vivo (Figure 5B, left). Conversely, we found a significant correlation (r = 0.93; P ≤ 0.0001) between beryllium-induced T cell proliferation and the percentage of beryllium-specific CD4+ T cells
expressing a TCM phenotype (Figure 5B, right).
Correlation of the memory phenotype of beryllium-specific CD4+ T cells
[image:5.585.44.287.83.408.2]in blood and the degree of inflammation in the lung. Based on our previ-ous observation that higher frequencies of beryllium-specific cells in blood were associated with the extent of alveolar inflamma-tion as measured by both BAL wbc and lymphocyte counts (16), we correlated the percentage of beryllium-specific CD4+ T cells
Figure 4
Maturation phenotype of beryllium-specific and SEB-responsive CD4+
T cells from 12 CBD patients (filled triangles) and 3 BeS subjects (open triangles). (A and B) The percentage of beryllium-specific IFN-γ+ (A,
left) and IL-2+ (B, left) CD4+ T cells displaying a particular maturation
phenotype as determined by the expression of CCR7 and CD45RA is shown. In addition, the percentage of SEB-responsive IFN-γ+ (A, right)
and IL-2+ (B, right) CD4+ T cells displaying a particular maturation
phe-notype based on the expression of CCR7 and CD45RA is shown. The median percentage is shown as a solid line. (C) Longitudinal studies of the percentage of beryllium-specific CD4+ T cells expressing a TEM cell
expressing a TEM phenotype in blood with these parameters of
lung involvement. As shown in Figure 6, a significant positive correlation was seen for the percentage of lymphocytes in BAL (r = 0.69; P = 0.009), and a trend was noted with total BAL wbc count (r = 0.49; P = 0.09). Conversely, an inverse correlation was observed between the percentage of lymphocytes in BAL and the percentage of beryllium-specific CD4+ T cells expressing a T
CM
phenotype in blood (r = –0.71; P = 0.007). We did not observe a correlation between percentage of beryllium-specific CD4+ T cells
expressing a TEM phenotype in blood and any pulmonary or
exer-cise physiologic variable (data not shown). Thus, the severity of the CD4+ T cell–mediated inflammation in BAL is closely tied to the
maturation state of circulating beryllium-specific memory T cells.
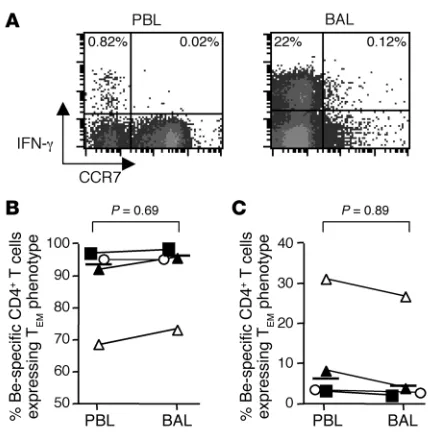
Comparison of the memory phenotype of beryllium-specific CD4+ T cells
in blood and lung. Because of the inaccessibility of the target organ in most diseases, few studies have been able to compare the T cell memory phenotypes of antigen-specific cells found in blood versus the target organ. In a disease characterized by CD4+ T cell alveolitis,
BAL allows the direct sampling of lung lymphocytes, with up to 25% of those CD4+ T cells expressing Th1-type cytokines after beryllium
exposure in culture (14). Using blood and BAL from 4 of the CBD patients described above, we determined the memory phenotype of the beryllium-specific CD4+ T cell populations. In a
representa-tive example shown in Figure 7A, the majority of beryllium-specific, IFN-γ–expressing CD4+ T cells possessed a T
EM cell phenotype (97%
of blood and 99% of BAL beryllium-specific CD4+ T cells).
Over-all, the percentages of beryllium-specific CD4+ T cells in blood and
BAL expressing a TEM cell phenotype were similar, with a median of
94% (range 69–96%) in blood compared with 96% (range 74–99%;
P = 0.69) in BAL (Figure 7B). In addition, similar findings were seen with respect to beryllium-specific CD4+ T cells expressing a central
memory phenotype in blood (median, 6.1%, range 3.2–31%) and BAL (median, 4.4%, range 1.5–26%; P = 0.89). Despite the compart-mentalization of the majority of beryllium-specific CD4+ T cells in
the target organ (14), these findings suggest that beryllium-specific TEM cells are either trafficking from secondary lymphoid organs to
the lung or recirculating from the lung.
Discussion
Our previous studies suggest that the frequency of beryllium-specific, cytokine-secreting CD4+ T cells in blood is significantly
greater in CBD patients compared with individuals with beryllium sensitization (16). However, no difference in beryllium-induced T cell proliferation in these disease groups was seen. Furthermore, in CBD patients, the correlation between numbers of circulating beryllium-specific, cytokine-secreting CD4+ T cells and
beryllium-stimulated lymphoproliferation is poor. With a known antigenic stimulus and an accessible target organ, beryllium-induced disease serves as an ideal system in which to investigate the role of differ-ent human memory CD4+ T cell subsets in disease. Using blood
and BAL from patients with beryllium sensitization and CBD, the current studies show that the majority of beryllium-specific CD4+
T cells in blood and lung express an effector memory phenotype, irrespective of IFN-γ or IL-2 production. Importantly, the ability of CD4+ T cells to proliferate after beryllium exposure in culture
depends on the maturation state of the memory T cell, which is significantly correlated with the severity of the CD4+ T
[image:6.585.48.281.86.402.2]cell–medi-ated inflammation in the lung.
Figure 5
Relationship of memory maturation phenotype of beryllium-specific CD4+ T cells and beryllium-induced T cell proliferation. (A)
Representa-tive examples of beryllium-induced IFN-γ expression at day 0 and pro-liferation as measured by loss of CFSE at day 7 on gated CD3+CD4+
T cells are shown for 2 CBD patients. The numbers in the top left and right quadrants of the density plots (left panel) represent the percent-age of beryllium-specific CD4+ T cells expressing a TEM (CCR7–) or
TCM (CCR7+) cell phenotype, respectively. The percentage of CD4+ T
cells losing CFSE expression after 7 days of culture in the presence of 1 × 10⁻⁴ M BeSO4 for the respective CBD patients is shown (right
panel). (B) Correlation between beryllium-induced CD4+ T cell
prolif-eration and the percentage of beryllium-specific CD4+ T cells
[image:6.585.302.530.590.698.2]express-ing either a TEM or a TCM phenotype is shown.
Figure 6
Correlation between the percentage of beryllium-specific CD4+ T cells
in blood expressing a TEM phenotype and total BAL wbc count or
research article
The presence of a beryllium-specific immune response in blood is detected by the beryllium lymphocyte proliferation test (BeLPT) (11–13). This assay is used for screening and diagnosis of beryl-lium sensitization in the workplace and is a required component of the US Department of Energy CBD prevention program (23). However, the BeLPT is unable to distinguish between stages of beryllium-induced disease and requires that beryllium-specific cells maintain the ability to proliferate after antigen stimulation in culture. In the lung, it is clear that certain beryllium-specific CD4+
T cells proliferate poorly after antigen exposure, yet maintain the ability to secrete Th1-type cytokines (9). In addition, we recently showed that ELISPOT analysis for IFN-γ and/or IL-2 detected cytokine secretion from blood cells of 6 BeS and 7 CBD subjects after beryllium exposure at a time when beryllium-induced T cell proliferation was undetectable (16). These findings are consistent with our present observations that, despite the presence of signifi-cant quantities of beryllium-specific CD4+ T cells in blood, the
ability of these cells to divide is closely linked to their memory T cell maturation state. Our findings suggest that the reduction in beryllium-induced lymphoproliferation seen in certain individu-als with beryllium-induced disease is due not to the absence of circulating beryllium-specific CD4+ T cells but rather to a high
fraction of TEM cells that are incapable of vigorous proliferation.
Similar discordance between proliferation and cytokine-secreting
responses has been seen in other diseases characterized by persis-tent antigen exposure such as HIV (24–26).
Even in the presence of low numbers of beryllium-induced, cytokine-secretingCD4+ T cells in blood, an increased
percent-age of those cellsexpressing a TCM cell phenotype was associated
with strong proliferation. The ability of CD4+ T
CM cells to secrete
IL-2 may be responsible for their enhanced proliferation, further improving their ability to mediate protective immunity. Despite the absence of a correlation between the frequency of IL-2–express-ing, beryllium-specific CD4+ T cells in blood and
lymphoprolifera-tion (r = 0.35; P = 0.26), we did observe a significant association between the frequency of beryllium-specific CD4+ T cells
express-ing a central memory phenotype and beryllium-induced CD4+ T
cell proliferation (r = 0.92; P = 0.0001). Direct proof that beryl-lium-specific CD4+ TCM cells possess a proliferative advantage over
TEM cells would require separation of these cells at time 0 followed
by analysis of beryllium-induced proliferation. Because of limita-tions on the usage of peripheral blood from CBD patients and the low frequency of beryllium-specific CD4+ T cells in blood, we were
unable to perform these studies. However, in preliminary experi-ments using blood from healthy subjects stimulated with phy-tohemagglutinin, CD4+ T
CM cells displayed greater proliferative
responses compared with TEM cells (data not shown).
In the current studies of patients with beryllium-induced disease, we noted that the overall proportions of CD4+ T cell memory
sub-sets were similar to those in control subjects. This is not surprising, since the circulating beryllium-specific CD4+ T cell population
rep-resents only a very small fraction of the total CD4+ T cell
compart-ment (9, 16). When the superantigen SEB was used as a polyclonal activator, CD4+ T cells that secreted both IL-2 and IFN-γ, compared
with those that only made IFN-γ, were enriched in the TCM
popu-lation, and even a few naive CD4+ cells were capable of secreting
IL-2. However, when we focused on beryllium-specific CD4+ T cells,
the TEM and TCM composition of cytokine-secreting cells was
simi-lar whether or not the cells retained the capacity to express IL-2. We found that the majority of beryllium-specific CD4+ cells that
secreted both IL-2 and IFN-γ, similar to the ones that expressed IFN-γ alone, were TEM cells, irrespective of their location in blood or
the target organ. In addition, the memory phenotype of the beryl-lium-specific CD4+ T cells in blood mirrored that expressed by the
beryllium-specific cells in the target organ.
We have previously shown that 2 populations of beryllium-spe-cific CD4+ T cells exist in blood and BAL of CBD patients: those
cells capable of secreting both IFN-γ and IL-2 and those only able to express IFN-γ (9, 16). Few, if any, beryllium-specific CD4+
T cells secreted only IL-2. These observations are very similar to those reported in persistent viral infections such as progressive HIV infection in which virus-specific CD4+ T cells primarily
pro-duce IFN-γ and little, if any, IL-2 (24, 26, 27). However, when viral antigen burden is reduced by the administration of highly active antiretroviral therapy, a partial recovery of IL-2–producing TCM
cells is seen (24, 27). It has also been shown in a perforin-deficient murine model of chronic lymphocytic choriomeningitis virus infection that T cells first lose the capacity to produce IL-2, then TNF-α, and finally IFN-γ (24, 27). Our findings suggest that per-sistent antigen exposure drives the beryllium-specific CD4+ T cells
toward a maturation state in which their cytokine and other func-tional characteristics are inconsistent with a vigorous proliferative response, particularly in those subjects with an intense CD4+ T cell
[image:7.585.57.271.79.296.2]alveolitis. One limitation of our analysis is that we were only able
Figure 7
Beryllium-specific CD4+ T cells from blood and BAL of CBD patients
express similar maturation phenotypes. (A) Beryllium-induced IFN-γ
expression on gated CD3+CD4+ T cells from blood and BAL of a
repre-sentative CBD subject is shown. The numbers in the top left and right quadrants represent the percentage of beryllium-specific CD4+ T cells
expressing a TEM (CCR7–) or TCM (CCR7+) cell phenotype,
respec-tively. (B and C) Frequency of beryllium-specific CD4+ T cells
express-ing a TEM or TCM phenotype in blood and BAL from 4 CBD patients is
shown. The median percentage of IFN-γ–secreting, beryllium-specific CD4+ T cells in blood and BAL expressing a TEM phenotype was 94%
(range 69–96%) and 96% (range 74–99%), respectively. The median percentage of IFN-γ–secreting, beryllium-specific CD4+ T cells in blood
and BAL expressing a TCM phenotype was 6.1% (range 3.2–31%) and
to evaluate stages of maturation in subjects with significant quan-tities of beryllium-specific, Th1-type cytokine–expressing CD4+ T
cells in blood; this resulted in a decreased sample size. We have previously shown that greater frequencies of beryllium-specific cells in blood are associated with the extent of alveolar inflamma-tion, as measured by both BAL wbc and lymphocyte counts (16). Despite this limitation, the association between memory matura-tion phenotype of the circulating beryllium-specific CD4+ T cell
and T cell alveolitis is quite strong, which suggests that the degree of inflammation in the target organ determines the maturation state of the beryllium-specific T cell. In addition, our findings sug-gest that the combination of the frequency of circulating berylli-um-specific CD4+ T cells and their memory phenotype may predict
the extent of alveolitis.
Fifty percent of the CBD patients enrolled in this study were receiving immunosuppressant treatment at the time of enroll-ment. Of the subjects with frequencies of beryllium-specific CD4+
T cells in blood detectable by intracellular cytokine expression (see Figure 3), 5 of 13 (38%) were receiving immunosuppressant thera-py. Our previous studies investigating the TCR repertoire of CD4+
T cells in BAL showed persistence of clonal expansions despite the initiation of corticosteroids (6). In addition, no significant differ-ence in the frequency of beryllium-specific T cells in blood was seen between treated and untreated CBD subjects (16). In the pres-ent study, a significantly increased number of lymphocytes in the BAL was seen in the treated versus the untreated subjects (data not shown). This almost certainly reflects the fact that the severity of pulmonary involvement (and the need for treatment) parallels the severity of the CD4+ T cell–mediated inflammation. There was no
evidence that treatment status affected the parameters being mea-sured (e.g., memory T cell maturation state) in the current study.
Of all the subjects evaluated, the 3 BeS patients studied had the highest frequency of beryllium-specific, IL-2–expressing CD4+ TCM
cells. These subjects also had the lowest BAL absolute lymphocyte counts. Only 1 of these subjects had a positive beryllium-induced proliferative response from BAL cells, and none had
granuloma-tous inflammation in the lung. Interestingly, there was an associa-tion between the extent of lung inflammaassocia-tion as measured by the percentage of lymphocytes in the BAL and the percentage of beryl-lium-specific CD4+ T cells expressing a T
EM phenotype in blood.
Taken together, our findings support the hypothesis that disease progression and potentially disease severity may be associated with a further differentiation of memory T cells from a proliferation-competent beryllium-specific CD4+ T
CM cell to an IFN-γ
–express-ing, poorly proliferating TEM cell. In the presence of
continu-ous antigenic exposure, the redevelopment of a predominantly IL-2–expressing TCM population is thus prevented. In conclusion,
these findings help explain some of the variability that has been observed with the BeLPT and extend our current understanding of beryllium-induced disease and persistent antigen exposure.
Methods
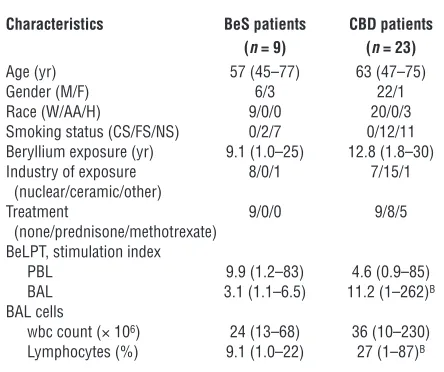
Study population. Twenty-three patients with a diagnosis of CBD and 9 BeS patients were enrolled in this study. Nine healthy non–beryllium-exposed control subjects were also enrolled. The diagnosis of CBD was established using previously defined criteria, including a history of beryllium exposure, the presence of granulomatous inflammation on lung biopsy, and a posi-tive proliferaposi-tive response of blood and/or BAL T cells to BeSO4 in vitro (28, 29). The diagnosis of beryllium sensitization was established based on a history of beryllium exposure, positive proliferative response of PBMCs to BeSO4 in vitro, and the absence of granulomatous inflammation or other abnormalities on lung biopsy (30, 31). Active smokers were excluded from enrollment. Informed consent was obtained from each patient and control subject, and the protocol was approved by the Human Subject Institutional Review Boards at the University of Colorado Health Sciences Center and National Jewish Medical and Research Center.
The demographics of the BeS and CBD patients are shown in Table 1. No difference was seen in the age of the BeS and CBD patients enrolled in this study. The majority of both subject groups were male. No difference in the estimated duration of beryllium exposure was observed in BeS and CBD subjects. Eight CBD patients were treated with oral glucocorticoids, and 5 received oral methotrexate. No difference in beryllium-induced proliferation of blood cells was seen between BeS and CBD patients. In contrast, a significant increase in the proliferation of BAL cells from CBD patients compared with BeS subjects in response to beryllium was seen (median, 11.2, range 1.0 –262, versus median, 3.1, range 1.1–6.5; P = 0.02). At the time of this study, BAL cells from 3 of the BeS subjects prolifer-ated in the presence of beryllium. All clinical BeLPTs were performed in the Clinical Immunology Laboratory at National Jewish Medical and Research Center as previously described (16). CBD subjects had a statisti-cally significant increase in the percentage of BAL lymphocytes (median, 27, range 1–87, versus median, 9.1, range 1.0–22; P < 0.005) compared with BeS patients.
Preparation of peripheral blood cells and beryllium-induced CD4+ T cell prolif-eration. PBMCs were isolated from heparinized blood by Ficoll-Hypaque density gradient separation, and BAL was performed as previously described (6, 7). Proliferation assays were performed using fresh PBMCs (10 × 106 cells per well) labeled with 1.5 µM CFSE (Invitrogen Corp.) for 20 minutes at 37°C and washed twice with PBS (27). The CFSE-labeled cells were cultured at 37°C for 7 days in a humidified 5% CO2 atmo-sphere in 12-well flat-bottom microtiter plates in complete culture media containing RPMI 1640 supplemented with 10% heat-inactivated human serum (Gemini Bio-Products), 20 mM HEPES, 1 mM sodium pyruvate, 100 U/ml penicillin, 100 µg/ml streptomycin, and 2 mM l-glutamine (all
[image:8.585.51.273.110.296.2]from Invitrogen Corp.) with 1 of the following stimulants added: medi-um alone, 2.5 µg/ml phytohemagglutinin (Sigma-Aldrich), or 1 × 10⁻⁴ M
Table 1
Characteristics of BeS and CBD patientsA
Characteristics BeS patients CBD patients
(n = 9) (n = 23)
Age (yr) 57 (45–77) 63 (47–75) Gender (M/F) 6/3 22/1 Race (W/AA/H) 9/0/0 20/0/3 Smoking status (CS/FS/NS) 0/2/7 0/12/11 Beryllium exposure (yr) 9.1 (1.0–25) 12.8 (1.8–30) Industry of exposure 8/0/1 7/15/1 (nuclear/ceramic/other)
Treatment 9/0/0 9/8/5 (none/prednisone/methotrexate)
BeLPT, stimulation index
PBL 9.9 (1.2–83) 4.6 (0.9–85) BAL 3.1 (1.1–6.5) 11.2 (1–262)B
BAL cells
wbc count (× 106) 24 (13–68) 36 (10–230)
Lymphocytes (%) 9.1 (1.0–22) 27 (1–87)B
AData are expressed as median (range). BP <0.05. W, white; AA,
research article
BeSO4 (Brush Wellman). Cells were stained with mAbs directed against CD3 and CD4 (all from BD Biosciences — Pharmingen). The lymphocyte population was identified using forward and 90° light scatter patterns, and fluorescence intensity was analyzed using a FACSCalibur cytometer (BD) as previously described (9, 15).
Immunofluorescence staining and analysis for intracellular cytokine expres-sion. Since ex vivo intracellular cytokine staining assays are only able to detect circulating antigen-specific cells present at frequencies greater than approximately 1 in 2,500 cells, only subjects with at least 0.04% IFN-γ– and IL-2–secreting beryllium-specific CD4+ T cells in blood were studied. For cytokine expression, PBMCs (2 × 10⁶ cells) and BAL cells (5 × 10⁵ cells) were placed in polypropylene tubes (12 × 75 mm; Fisher Scientific) con-taining 1 ml of complete culture media and 3 µg/ml CD28 and anti-CD49d (BD Biosciences — Pharmingen) with 1 of the following added: medium alone, 10 ng/ml SEB, or 1 × 10⁻⁴ M BeSO4. Cells were incubated for a total of 6 hours at 37°C in a humidified 5% CO2 atmosphere with 10 µg/ml brefeldin A added after the first hour of stimulation, as previ-ously described (9, 15). After stimulation, cells were washed and stained with mAbs directed against CD4, CD45RA, and CCR7 (all from BD Bio-sciences — Pharmingen) as previously described (9, 15). Cells were washed with PBS containing 1% BSA and placed in fixation medium (CALTAG Laboratories) for 15 minutes at room temperature. After washing with PBS containing 1% BSA, cells were added to permeabilization medium (CALTAG Laboratories), and stained with mAbs directed against IFN-γ
and/or IL-2 (both from CALTAG Laboratories) for 30 minutes at 4°C. Fluorescence intensity was analyzed as described above.
Statistical analysis. ANOVA analysis was used to determine whether there was a global difference between groups. After the data were checked for overall group differences, individual contrasts were calculated to compare group means of interest. A Spearman correlation was performed to analyze the associations among beryllium-induced T cell proliferation, frequency of Th1-type cytokine–producing cells, and percentage of cells expressing each maturation phenotype. A P value of less than 0.05 was considered statistically significant.
Acknowledgments
This work was supported by NIH grants HL62410, ES06358, and ES011810, and by the General Clinical Research Center (M01-RR-0051) of Research Resources at the NIH.
Received for publication March 1, 2005, and accepted in revised form July 1, 2005.
Address correspondence to: Andrew P. Fontenot, Division of Clinical Immunology (B164), University of Colorado Health Sciences Center, 4200 East Ninth Avenue, Denver, Colorado 80262, USA. Phone: (303) 315-7601; Fax: (303) 315-7642; E-mail: [email protected].
1. Fontenot, A.P., Newman, L.S., and Kotzin, B.L. 2001. Chronic beryllium disease: T cell recognition of a metal presented by HLA-DP. Clin. Immunol. 100:4–14.
2. Fontenot, A.P., and Kotzin, B.L. 2003. Chronic beryllium disease: immune-mediated destruction with implications for organ-specific autoimmunity [review]. Tissue Antigens. 62:449–458.
3. Newman, L.S., and Maier, L.A. 2003. Beryllium disease. In Interstitial lung disease. 4th edition. M.I. Schwarz and T.E. King Jr., editors. B.C. Decker Inc. Hamilton, Ontario, Canada. 435–451.
4. Newman, L.S., Lloyd, J., and Daniloff, E. 1996. The natural history of beryllium sensitization and chronic beryllium disease. Environ. Health Perspect. 104(Suppl. 5):937S–943S.
5. Infante, P.F., and Newman, L.S. 2004. Beryllium exposure and chronic beryllium disease. Lancet. 363:415–416.
6. Fontenot, A.P., Kotzin, B.L., Comment, C., and Newman, L.S. 1998. Expansions of T-cell sub-sets expressing particular T cell receptor variable regions in chronic beryllium disease. Am. J. Respir. Cell Mol. Biol. 18:581–589.
7. Fontenot, A.P., Falta, M.T., Freed, B.M., Newman, L.S., and Kotzin, B.L. 1999. Identification of patho-genic T cells in patients with beryllium-induced lung disease. J. Immunol. 163:1019–1026. 8. Fontenot, A.P., Torres, M., Marshall, W.H.,
New-man, L.S., and Kotzin, B.L. 2000. Beryllium presen-tation to CD4+ T cells underlies disease
suscepti-bility HLA-DP alleles in chronic beryllium disease. Proc. Natl. Acad. Sci. U. S. A. 97:12717–12722. 9. Fontenot, A.P., Canavera, S.J., Gharavi, L., Newman,
L.S., and Kotzin, B.L. 2002. Target organ localiza-tion of memory CD4+ T cells in patients with
chron-ic beryllium disease. J. Clin. Invest. 110:1473–1482. doi:10.1172/JCI200215846.
10. Lombardi, G., et al. 2001. HLA-DP allele-specific T cell responses to beryllium account for DP-associ-ated susceptibility to chronic beryllium disease. J. Immunol. 166:3549–3555.
11. Maier, L.A. 2001. Beryllium health effects in the era of the beryllium lymphocyte proliferation test. Appl. Occup. Environ. Hyg. 16:514–520.
12. Frome, E.L., Newman, L.S., Cragle, D.L., Colyer, S.P., and Wambach, P.F. 2003. Identification of an abnormal beryllium lymphocyte proliferation test. Toxicology. 183:39–56.
13. Stange, A.W., Furman, F.J., and Hilmas, D.E. 2004. The beryllium lymphocyte proliferation test: rel-evant issues in beryllium health surveillance. Am. J. Ind. Med. 46:453–462.
14. Newman, L.S., Mroz, M.M., Balkissoon, R., and Maier, L.A. 2004. Beryllium sensitization progresses to chronic beryllium disease: a longitudinal study of disease risk. Am. J. Respir. Crit. Care Med. 171:54–60. 15. Fontenot, A.P., et al. 2003. CD28 costimulation
independence of target organ versus circulating memory antigen-specific CD4+ T cells. J. Clin. Invest.
112:776–784. doi:10.1172/JCI200318317. 16. Pott, G.B., et al. 2005. The frequency of
beryllium-specific, Th1-type cytokine-expressing CD4+ T
cells in patients with beryllium-induced disease. J. Allergy Clin. Immunol. 115:1036–1042.
17. Sallusto, F., Lenig, D., Forster, R., Lipp, M., and Lanzavecchia, A. 1999. Two subsets of memory T lymphocytes with distinct homing potentials and effector functions. Nature. 401:708–712. 18. Sallusto, F., and Lanzavecchia, A. 2001. Exploring
pathways for memory T cell generation. J. Clin. Invest. 108:805–806. doi:10.1172/JCI200114005. 19. Lanzavecchia, A., and Sallusto, F. 2000. Dynamics
of T lymphocyte responses: intermediates, effectors, and memory cells [review]. Science. 290:92–97. 20. Geginat, J., Sallusto, F., and Lanzavechia, A. 2001.
Cytokine-driven proliferation and differentiation of human naive, central memory, and effector memory CD4+ T cells. J. Exp. Med. 194:1711–1719.
21. Seder, R.A., and Ahmed, R. 2003. Similarities and differences in CD4+ and CD8+ effector and mem-ory T cell generation. Nat. Immunol. 4:835–842. 22. Macallan, D.C., et al. 2004. Rapid turnover of
effector-memory CD4+ T cells in healthy humans.
J. Exp. Med. 200:255–260.
23. [No authors listed]. 1999. Chronic beryllium dis-ease prevention program. Office of Environment, Safety and Health, Department of Energy. Final rule. Fed. Regist. 64:68854–68914.
24. Palmer, B.E., Boritz, E., and Wilson, C.C. 2004. Effects of sustained HIV-1 plasma viremia on HIV-1 gag-specific CD4+ T cell maturation and function. J. Immunol. 172:3337–3347.
25. Palmer, B.E., Boritz, E., Blyveis, N., and Wilson, C.C. 2002. Discordance between frequency of human immunodeficiency virus type 1 (HIV-1)-specific gamma interferon-producing CD4+ T cells and HIV-1-specific lymphoproliferation in HIV-1- infected subjects with active viral replication. J. Virol. 76:5925–5936.
26. Younes, S.A., et al. 2003. HIV-1 viremia prevents the establishment of interleukin 2-producing HIV-spe-cific memory CD4+ T cells endowed with prolifera-tive capacity. J. Exp. Med. 198:1909–1922. 27. Harari, A., Petitpierre, S., Vallelian, F., and
Panta-leo, G. 2004. Skewed representation of function-ally distinct populations of virus-specific CD4 T cells in HIV-1-infected subjects with progressive disease: changes after antiretroviral therapy. Blood. 103:966–972.
28. Newman, L.S., Kreiss, K., King, T.E., Jr., Seay, S., and Campbell, P.A. 1989. Pathologic and immunologic alterations in early stages of beryllium disease: re-examination of disease definition and natural his-tory. Am. Rev. Respir. Dis. 139:1479–1486. 29. Rossman, M.D., et al. 1988. Proliferative response
of bronchoalveolar lymphocytes to beryllium. Ann. Intern. Med. 108:687–693.
30. Newman, L.S. 1996. Significance of the blood beryllium lymphocyte proliferation test. Environ. Health Perspect. 104(Suppl. 5):S953–S956. 31. Mroz, M.M., Kreiss, K., Lezotte, D.C., Campbell,