ISSN 2250-3153
Analysis of Tree Based Supervised Learning Algorithms
on Medical Data
Thin Thin Swe
* Faculty of IT Support & Maintenance, University of Computer Studies (Myitkyina)
DOI: 10.29322/IJSRP.9.04.2019.p8817 http://dx.doi.org/10.29322/IJSRP.9.04.2019.p8817
Abstract- Classification is one of the major tasks in data mining and has also been studied extensively in statistics, machine learning, expert systems, and different application areas on different domains over decades. Decision tree is one of the popular and practical classification approaches in data mining. It is also widely used in several research areas. Tree growing methods used to construct the decision tree may vary the performance of this classifier. Tree based classification algorithms are separated based on their attribute selection measure method. Therefore, this paper presents the comparative analysis of different tree based algorithms such as CART, ID3, J48, Random Tree and PART. Macro average accuracy, precision, recall, and F-measure are used for performance comparisons of these algorithms by using WEKA tool.
Keywords: CART, ID3, PART, Random Tree, C4.5
I. INTRODUCTION
he tendency in recent decades to computerize the process of disease treatment ensures a more rapid accumulation of medical information. Information technologies are actively used in the sector of healthcare. National electronic health records systems and medical imaging archives are implemented all over the world. Health care institutions implement and deploy hospital information systems (HIS), radiological picture reviewing and archiving systems (PACS), laboratory information systems (LIS), and others. Compared to other science and engineering disciplines, data mining (DM) is in its infancy. Over the past decade, the application of DM in biomedicine has also been actively investigated. Data mining is mainly used for the specific set of six activities namely Classification, Estimation, Prediction, Affinity grouping or Association rules, Clustering, Description and Visualization. The first three tasks- classification, estimation and prediction are all examples of the directed data mining or supervised learning [11]. Classification is one of the fundamental tasks in data mining and has also been studied extensively in statistics, machine learning and expert systems over decades. It has been successfully applied to a wide range of application areas, such as scientific experiments, medical diagnosis, weather prediction, credit approval, customer segmentation, target marketing and fraud detection. The input for classification is a set of training records (training instances), where each record has several attributes. Attributes with discrete domains are referred to as categorical, while those with continuous domains are referred to as numerical. There is one distinguished attribute called the class label. In general, given a database of records, each with a class label, a classifier generates a concise meaningful description for each class in terms of the attributes. The model is then used to predict class labels of unknown objects.
Decision Tree (DT) is a popular supervised classification scheme that generates a tree and a set of rules from a given training data set, representing models of different classes. It is widely used in different research fields. DT is a flow chart like tree structure in which each internal node represents a test of attributes, each branch represents the result of a test, and a leaf node represents a class label of class distribution. The topmost node on the tree is the root node. By traversing each leaf of the tree starting from the node, it can easily derive rules corresponding to the tree. It can be noted that many different leaves of a tree can refer to the same category label, but each leaf refers to a different rule. Decision tree classifiers are widely used in the diagnosis of breast tumors such as ultrasound images, ovarian cancer and heart sound diagnosis. These classifiers play a vital role in the field of medical diagnostics to diagnose patient problems. In this system, the decision tree algorithm is implemented on a health related data set [3][4]. Several research have been developed the decision tree classifiers using various tree growing or node selection methods for tree construction process. The well-known decision tree classifiers are Iterative Dichotomiser3 (ID3), C4.5, and Classification and Regression Tree (CART).
In this study, six medical datasets obtained from the UCI machine learning database are applied to analyze the performance of tree growing methods in decision tree classifier.
II. RELATEDWORK
ISSN 2250-3153
J.Ross Quilan during 1980s. The expansion of this algorithm as concept learning systems was described by Hunt et al. A successor of ID3 (C4.5) was presented by J. R. Quinlan. It can support both nominal and numerical attributes to build a decision tree. In 1984, a group of machine learning researchers presented Classification and Regression Tree (CART) in 1984 [6]. They described the generation of binary decision trees. ID3 and CART were invented independently of one another at around the same time. However these algorithms follow a similar approach for learning decision trees from training tuples. ID3, C4.5 and CART are constructed in a top-down recursive divide-and-conquer manner. Most algorithms for decision tree induction also follow such a top-down approach, which starts with a training set of tuples and their associated class labels. The training set is recursively partitioned into smaller subsets as the tree is being built [8]. Roy et al. proposed the correlation ratio based decision tree model (CRDT) based on healthcare datasets. They compared the results of CRDT model with ID3 model and described that CRDT model outperformed the ID3 model [14].
III. METHODOLOGY
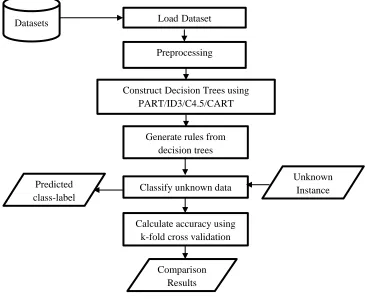
[image:2.612.120.487.359.658.2]A decision tree method is powerful for classification and prediction. It is used for facilitate the decision making process in sequential decision problems. It is a graphical model which is used to describe decisions and their outcomes those are possible. A decision tree classifies various items of data by applying a series of questions those are all about the features associated with data items [8]. Every node of the decision tree contains a question and every internal node for every possible answer of its question point to one child node. Every time it receives an answer, a follow-up question is asked until it gets the conclusion about the record’s class label. Decision tree is a hierarchical structure which contains nodes and directed edges. Every decision tree algorithm has its advantages and disadvantages. Therefore, it is difficult to find out that which algorithm is best among the algorithms. To construct a decision tree, these algorithms use a greedy strategy, in which they make series of locally optimum decisions. These decisions are about the selection of the attribute that can be used for partitioning the data. The various decision tree approaches are classification tree, regression tree and survival tree. ID3, C4.5 and CART are constructed in a top-down recursive divide-and-conquer manner. Most algorithms for decision tree induction also follow such a top-down approach, which starts with a training set of tuples and their associated class labels. The training set is recursively partitioned into smaller subsets as the tree is being built [5]. The system flow of the proposed methodology is described in Figure 1.
Figure 1 Architecture of the System
Firstly, load data from the database and then discretize the data by using equal width binning method. Secondly, the preprocessed data are classified by tree based classifiers such as Classification and Regression Tree (CART), Random Tree (RT), PART, Iterative Dichotomiser (ID3) and C4.5. And then generate rules from decision trees. According to the generated decision rules, classify new input and display the classified result. Then, the accuracy of the classifier is measured with k-fold cross validation. For k-fold cross validation, accept k-value from the user and splits the dataset into kth sets. Each set into kth sets is used as testing data while the rest are
LoadDataset
Preprocessing
Classify unknown data Generate rules from
decision trees
ConstructDecision Trees using PART/ID3/C4.5/CART
Calculate accuracy using k-fold cross validation Datasets
Unknown Instance Predicted
class-label
ISSN 2250-3153
for training until the kth loop classification process is finished. It records all the correct and incorrect classification results in each loop and computes the classification accuracy. And then, display the accuracy result. The best classifier is known by comparing the accuracy results of these classifiers.
A. ID3 Algorithm
ID3 uses Information Gain as its attribute selection measure. Information Gain is a measuring the expected reduction in Entropy. To minimize the decision tree depth, it is needed to select the optimal attribute for splitting the tree node. The attribute with the highest Information Gain is chosen as the splitting attribute ID3 Algorithm for node.
𝐺𝐺𝐺𝐺𝐺𝐺𝐺𝐺(𝑆𝑆,𝐴𝐴) =𝐸𝐸𝐺𝐺𝐸𝐸𝐸𝐸𝐸𝐸𝐸𝐸𝐸𝐸(𝑆𝑆)− � ||𝑆𝑆𝑣𝑣𝑆𝑆||𝐸𝐸𝐺𝐺𝐸𝐸𝐸𝐸𝐸𝐸𝐸𝐸𝐸𝐸(𝑆𝑆𝑣𝑣)
𝑣𝑣∈𝑉𝑉𝑉𝑉𝑉𝑉𝑉𝑉𝑉𝑉𝑉𝑉(𝐴𝐴)
Where Values (A) is the set of all possible values for attribute A, and Sv is the subset of S for which attribute A has value v (i.e., Sv= {s€S|A(s)=v}). Information Gain can be used to rank attributes and to build decision trees where at each node is located the attribute with greatest gain among the attributes not yet considered in the path from the root. ID3 is harder to use on continuous data. If the values of any given attribute are continuous, then there are many more places to split the data on this attribute, and searching for the best value to split by can be time consuming [16].
B. C4.5 Algorithm
This algorithm is an extension to ID3 developed by Quinlan Ross [6, 10, 17]. It is also based on Hunt’s algorithm.C4.5 handles both categorical and continuous attributes to build a decision tree. In order to handle continuous attributes, C4.5 splits the attribute values into two partitions based on the selected threshold such that all the values above the threshold as one child and the remaining as another child. It also handles missing attribute values. C4.5 uses Gain Ratio as an attribute selection measure to build a decision tree. It removes the biasness of Information Gain when there are many outcome values of an attribute [3]. It applies a kind of normalization to Information Gain using a “split information” value.
The information-gain criterion unfortunately has a serious deficiency in that there is a strong bias in favour of tests with a lot of outcomes. A remedy comes in the form of a proper normalization. In analogy with the definition of the entropy of a set, an additional parameter is introduced for each test x that splits a given set T into subsets.
Where SplitInfo is:
𝑆𝑆𝐸𝐸𝑆𝑆𝐺𝐺𝐸𝐸𝑆𝑆𝐺𝐺𝑆𝑆𝐸𝐸(𝐴𝐴,𝑆𝑆) =− � �𝐒𝐒𝐣𝐣�
|𝐒𝐒|
𝒗𝒗
𝒋𝒋=𝟏𝟏 ∗log2 �𝐒𝐒𝐣𝐣�
|𝐒𝐒|
This represents the potential information generated by dividing set S into n subsets Sj. Now, Gain ratio, is defined as follows:
𝐺𝐺𝐺𝐺𝐺𝐺𝐺𝐺𝐺𝐺𝐺𝐺𝐸𝐸𝐺𝐺𝐸𝐸(𝐴𝐴,𝑆𝑆) =𝑆𝑆𝑆𝑆𝑉𝑉𝐺𝐺𝑆𝑆𝑆𝑆𝐺𝐺𝑆𝑆𝑆𝑆𝐺𝐺𝑉𝑉𝐺𝐺𝐺𝐺(𝐴𝐴,(𝑆𝑆𝐴𝐴),𝑆𝑆)
This new gain measure expresses the proportion of information generated by the split that appears useful in classification. The gain-ratio criterion selects a test that maximizes this ratio. This criterion is robust and typically gives a consistently better choice of a test than the previous
C. CART Algorithm
CART is a classification and regression tree algorithm [8]. Like C4.5, it can be seen as classification tree but it can be applied on regression problems with numerical response variables. It uses a generalization of the binomial variance called the Gini index. It first grows an overly large tree and then prunes it to a smaller size to minimize an estimate of the misclassification error. The selection of which input variable to use and the specific split or cut-point is chosen using a greedy algorithm to minimize a cost function. Tree construction ends using a predefined stopping criterion, such as a minimum number of training instances assigned to each leaf node of the tree. For classification the Gini index function is used which provides an indication of how “pure” the leaf nodes are (how mixed the training data assigned to each node is).
𝐺𝐺𝐺𝐺𝐺𝐺𝐺𝐺=𝑠𝑠𝑠𝑠𝑠𝑠(𝐸𝐸𝑝𝑝 ∗(1− 𝐸𝐸𝑝𝑝))
Where G is the Gini index over all classes, pk are the proportion of training instances with class k in the rectangle of interest. For a binary classification problem, this can be re-written as:
𝐺𝐺𝐺𝐺𝐺𝐺𝐺𝐺= 2∗ 𝐸𝐸1∗ 𝐸𝐸2
The Gini index calculation for each node is weighted by the total number of instances in the parent node. The Gini score for a chosen split point in a binary classification problem is therefore calculated as follows:
𝐺𝐺𝐺𝐺𝐺𝐺𝐺𝐺= ((1 – (𝑔𝑔1_1^2 + 𝑔𝑔1_2^2)) ∗ (𝐺𝐺𝑔𝑔1/𝐺𝐺)) + ((1 – (𝑔𝑔2_1^2 + 𝑔𝑔2_2^2)) ∗ (𝐺𝐺𝑔𝑔2/𝐺𝐺)
ISSN 2250-3153
D. PART Algorithm
PART is a rule based learner. It combines the divide and conquers strategy with separate and conquers strategy of rule based learning. This algorithm produces sets of rules called decision lists “which are planned set of rules”. A new test data is compared to each rule in the list and the data item is assigned the class value of the first matching rule. PART builds a partial C4.5 decision tree in each iteration step and makes the “best” leaf to create a rule [3].
E. Random Tree
Random Tree is a supervised machine learning classifier. It is an ensemble learning algorithm like Bagging and Random Forest [7]. It also generates lots of individual learners. It applies the idea of bagging algorithm to construct a random set of data as a decision tree. In general, every node in the tree is split using the best split based on all features variables. Random Tree classifier can deal with both classification and regression applications. It behaves like a forest with a set of trees. In classification, each tree in the forest classifies the input examples. And it provides the output class label for examples based on the majority votes of label from the results of each trees like Random Forest. For regression analysis, Random Tree classifier produces its prediction for response variable based on the average of the results of each trees in the forest.
In Random Trees, each decision trees with every single leaf holds a linear model which is optimized for the local subspace by this leaf. Tree diversity is created by two ways of randomization to improve the performance of each decision trees. First the training data is sampled with replacement for each tree like in Bagging. Secondly, when growing a tree, the best split is computed on a random subset of all attributes which is done at every node. Random trees uses this produce for split selection and thus induce reasonably balanced trees where one global setting for the ridge value works across all leaves, thus simplifying the optimization procedure. [1][2][12][13][15].
IV. EXPERIMENTSETTING
This work used Weka data mining tool to conduct the experiment. We compared the classification performance of the tree based models such as ID3, C 4.5, CART, PART and Random Tree. In this paper, we applied six different medical datasets for analysis of various decision tree algorithms. The detailed description of datasets is shown in Table 1. These datasets are obtained from UCI machine learning repository. We applied 10-fold cross validation as the test mode to record classification accuracy. This approach is suitable to avoid biased results and provide robustness to the classification. Also, the parameters of a classification algorithm are chosen to their default values.
Table1. Information of Six Medical Datasets
Dataset Number of Instances Number of Attributes Number of Classes
Indian Liver Patients Dataset 583 11 2
Mammography Masses Dataset 961 6 2
Pima Indian Diabetes Dataset 768 9 2
Breast Cancer Dataset 699 11 2
Hepatitis Dataset 155 20 2
Diabetic Retinopathy 1151 20 2
The experimental results of the different methods based on Macro Average Precision (F), Recall (R) and F-measure (F). Table-2 summarizes the classification accuracy in percentage of all the classifiers across the datasets.
Table2. Classification Performance of Tree Based Algorithms
Dataset Random Tree CART C4.5 PART ID3
P R F P R F P R F P R F P R F
Indian Liver Patients 0.89 0.68 0.75 0.68 0.61 0.69 0.93 0.93 0.93 0.96 0.96 0.96 0.93 0.93 0.93 Mammography Masses 0.79 0.79 0.79 0.85 0.85 0.85 0.83 0.83 0.83 0.83 0.83 0.83 0.82 0.82 0.82 Pima Indian Diabetes 0.70 0.70 0.70 0.74 0.74 0.74 0.87 0.87 0.87 0.89 0.89 0.89 0.69 0.69 0.69 Breast Cancer 0.94 0.94 0.94 0.94 0.94 0.94 0.95 0.953 0.95 0.94 0.941 0.94 0.96 0.96 0.96 Hepatitis Dataset 0.79 0.79 0.79 0.81 0.81 0.75 0.78 0.80 0.79 0.77 0.79 0.78 0.8 0.79 0.79 Diabetic Retinopathy 0.61 0.61 0.61 0.65 0.65 0.65 0.67 0.68 0.68 0.68 0.65 0.64 0.61 0.61 0.61
ISSN 2250-3153
V. CONCLUSION
This system focused on the comparison of five different tree based classification algorithms on six datasets pertaining to medical domain. The continuous attributes of all datasets are discretized by using equal width binning method. This system also studies the tree growing methods of decision tree classification algorithms such as Gini Index, Information Gain and Gain Ratio based Decision Trees. It compared the classification performance of classifier models on health care data. According to the experimental results, PART can perform slightly better than the C 4.5 methods for three datasets and C 4.5 is better than PART on two datasets. It is found that the classification performance of the classifiers across the dataset is not very uniform. The performance of Random Tree is worst. Based on the results, Gain Ratio is the most useful tree growing method used in decision tree construction and helps the user in order to classify new medical data more exactly.
REFERENCES
[1] A. K. Mishra and B. K.i Ratha, “Study of Random Tree and Random Forest Data Mining Algorithms for Microarray Data Analysis”, International Journal on Advanced Electrical and Computer Engineering (IJAECE), 3(4), 2016, pp. 5-7.
[2] A. K. Samal, S. K. Pani and J. Pramanik, “Comparative Study of J48, AD Tree, REP Tree and BF Tree Data Mining Algorithms through Colon Tumour Dataset”, International Journal for Scientific Research and Development, 4(3), 2016.
[3] B. Pfahringer, “Random model trees: an e_ective and scalable regression method” University of Waikato, New Zealand, http://www.cs.waikato.ac.nz/~bernhard [4] C. Kingsford, S.L. Salzberg, What are decision trees?. Nature biotechnology, 26(9), 2008, p.1011.
[5] E. Frank, Ian H. Witten, “Generating Accurate Rule Sets Without Global Optimization”. In: Fifteenth International Conference on Machine Learning, 1998,pp. 144-151.
[6] J. Han, M. Kamber, and J. Pei, Data mining concepts and techniques third edition, 2012. Waltham: Elsevier. [7] L. Breiman, "Random forests." Machine learning 45, no. 1 ,2001, pp. 5-32.
[8] L. Brieman, J. Friedman , R. Olshen, C. Stone, Classification and regression trees. Belmont (CA): Wadsworth. Google Scholar. 1984.
[9] L. Rokach, and O. Maimon, , Top-down induction of decision trees classifiers-a survey. IEEE Transactions on Systems, Man, and Cybernetics, Part C (Applications and Reviews), 35(4), 2005, pp.476-487.
[10] J. Ross Quinlan, C4.5: Programs for Machine Learning. San Mateo, CA, USA: Morgan Kaufmann Publishers; 1993. [11] R. Jain, Introduction to data mining techniques, 2015. Available on www. iasri. res. in.
[12] S. Kalmegh, “Analysis of WEKA Data Mining Algorithm REPTree, Simple Cart and RandomTree for Classification of Indian News”, IJISET - International Journal of Innovative Science, Engineering & Technology, 2(2), 2015, pp.438-446.
[13] S. R. Kalmegh, “Comparative analysis of weka data mining algorithm randomforest, randomtree and ladtree for classification of indigenous news data”. International Journal of Emerging Technology and Advanced Engineering, 5(1), 2015, pp.507-517.
[14] S. Roy, S. Mondal, A. Ekbal, M.S. Desarkar, CRDT: Correlation Ratio Based Decision Tree Model for Healthcare Data Mining. In Bioinformatics and Bioengineering (BIBE), 2016 IEEE 16th International Conference on, IEEE, 2016, pp. 36-43.
[15] S. S. Shajahaan, S. Shanthi, and V. ManoChitra, Application of Data Mining techniques to model breast cancer data. International Journal of Emerging Technology and Advanced Engineering, 3(11), 2013, pp.362-369.
[16] W. Peng, J. Chen, H. Zhou, An Implementation of ID3: Decision Tree Learning Algorithm, Project of Comp 9417: Machine Learning University of New South Wales, School of Computer Science & Engineering, Sydney, NSW 2032, and Australia.