Georgia State University
ScholarWorks @ Georgia State University
Public Health Theses School of Public Health
Fall 12-21-2018
Assessing Patterns in Sexually Transmitted Disease
from Hospital Discharges in Chile: 2001-2010
Oluwadamilola Ode-Martins
Follow this and additional works at:https://scholarworks.gsu.edu/iph_theses
This Thesis is brought to you for free and open access by the School of Public Health at ScholarWorks @ Georgia State University. It has been accepted for inclusion in Public Health Theses by an authorized administrator of ScholarWorks @ Georgia State University. For more information, please contact
Recommended Citation
Ode-Martins, Oluwadamilola, "Assessing Patterns in Sexually Transmitted Disease from Hospital Discharges in Chile: 2001-2010." Thesis, Georgia State University, 2018.
i
Title: Assessing Patterns in Sexually Transmitted Disease from Hospital Discharges in Chile: 2001-2010
By
Oluwadamilola Ode-Martins December 5, 2018
ABSTRACT
Background: Sexually transmitted diseases (STDs) and HIV are still a significant public health burden globally. According to the World Health Organization (WHO), globally there are more than 1 million cases of sexually transmitted diseases and HIV infections acquired on a daily basis. In 2016, there was an estimated 97,000 new HIV infections that occurred in Latin
America. There is little to no information regarding the trends over time of sexually transmitted diseases and HIV infections in multiple Latin American countries, especially Chile which is considered a developing country.
Objective: The purpose of this study is to determine the patterns of sexually transmitted diseases and HIV using hospital discharges from 2001 to 2010 across all regions of Chile. We seek to 1) assess the pattern in hospital discharges due to STDs across all regions, 2) examine the
association between the outcome (STDs) and predictor variables (age, gender, region) separately 3) examine the association between the outcome (STDs) and predictor variables (age, gender, region) controlling for region.
Methods: Data for this study was derived from the Chilean Department of Health Statistics and Information (DEIS). Using SAS Software (SAS 9.4, Cary NC), descriptive analyses were performed to determine the frequency distribution of the demographic data. Bivariate and multivariate logistic regression analysis were performed to examine the association between the outcome (STDs) and the predictor variables (Age, Gender and Region).
Results: The number of females with STDs were 50883 (79%) and males 13836 (22%). 54% of the STD cases arose from patients aged between 25-44 years, followed by patients aged 45-64 years which accounted for 22% of the STD cases. The region with the highest number of STD cases is Santiago accounting for 39% of the total number of cases. Pelvic inflammatory disease (PID), which only affects women, accounted for 66% (43085) of the STD cases among females. When compared to other STDs, the prevalence of PID occurred more in females than in males. For HIV, the results revealed that the odds of female patients being diagnosed with HIV were (AOR 0.02, 95% CI:0.02-0.09) when compared to male patients. For chlamydia, the odds of a female patient being diagnosed was (AOR 1.03 95% CI 0.85-1.25) when compared to male patients. The adjusted odds of females having syphilis is 0.31, (95% CI: 0.28-0.34) times less than the odds of males having syphilis. Therefore, there was no statistically significant difference between males and females for the outcomes of HIV, chlamydia and syphilis.
Conclusion: This study shows us an overall decrease in STD diagnoses from private hospital discharges. In the year 2002, there was a slight increase, and then it decreased and plateaued until 2010. Patients aged 25-44 years had the highest cases of all STDs followed by patients aged 5-24 year which is consistent with major studies. There was no statistically significant
ii
Assessing Patterns in Sexually Transmitted Diseases from Hospital
Discharges in Chile: 2001-2010
By
Oluwadamilola Ode-Martins
BSc., Arizona State University
Thesis Submitted to the Graduate Faculty of Georgia State University in Partial Fulfillment
of the Requirements for the Degree
MASTER OF PUBLIC HEALTH
Under the Direction of
Gerardo Chowell, Ph.D., Louis Egide, PhD.
Atlanta, Georgia
iii
Approval Page
Assessing Patterns in Sexually Transmitted Disease from Hospital Discharges in Chile: 2001-2010
By Oluwadamilola Ode-Martins
Approved:
Dr. Gerardo Chowell
Committee Chair
Dr. Louis Egide Committee Member
iv
Acknowledgment
I would also like to first and foremost thank God for seeing me through this past year. I would like to thank the members of my thesis committee, Dr. Gerardo Chowell and Dr. Louis Egide for their mentorship, patience, and support throughout this project.
I am thankful to Dr. Gerardo Chowell for giving me the opportunity to work as a Graduate Teaching Assistant in his Infectious Diseases Epidemiology Dynamics class. I am extremely grateful to Dr. Egide for giving me the opportunity to work as an intern for my practicum and guiding me thoroughly throughout this thesis project. I am immensely grateful to Emmanuel Brown for his SAS help during this project.
Last, but not the least, I would like to thank my family for their prayers and support.
v
Author’s Statement
In presenting this thesis as a partial fulfillment of the requirements for an advanced degree from Georgia State University, I agree that the Library of the University shall make it available for inspection and circulation in accordance with its regulations governing materials of this type. I agree that permission to quote from, to copy from, or to publish this thesis may be granted by the
vi
Table of Contents
Acknowledgements ... iv
List of Tables and Figures ... vii
List of Abbreviations ... viii
Introduction ...9
1.1. Background ...9
1.2. Purpose of Study ...10
Review of Literature ...11
2.1. Summary of HIV and STDs in Latin America and Caribbean Countries ...11
2.2. Patterns of HIV and STDs in Other Countries ...11
Methods and Procedures ...13
3.1. Data Source and Data Collection ...13
3.2. Statistical Analysis ...13
Results ...17
4.1. Descriptive Analysis ...17
4.2. Logistic Regression ...17
Discussion and Conclusion ...26
5.1. Discussion ...26
5.2. Limitations and Strengths of Study ...27
5.3. Conclusions ...28
vii List of Tables
Table 1. List of Sexually Transmitted Diseases and ICD-10 code
Table 2. Pattern of STDs from Hospital Discharges
Table 3. Descriptive Summary of Hospital Discharge Data, 2001-2010
Table 4. Bivariate and Multivariate Logistic Regression of Outcome Variables by Gender and Age using Hospital Discharge Data.
Table 5. STD Hospital Discharge Cases by year N= 64719.
List of Figures
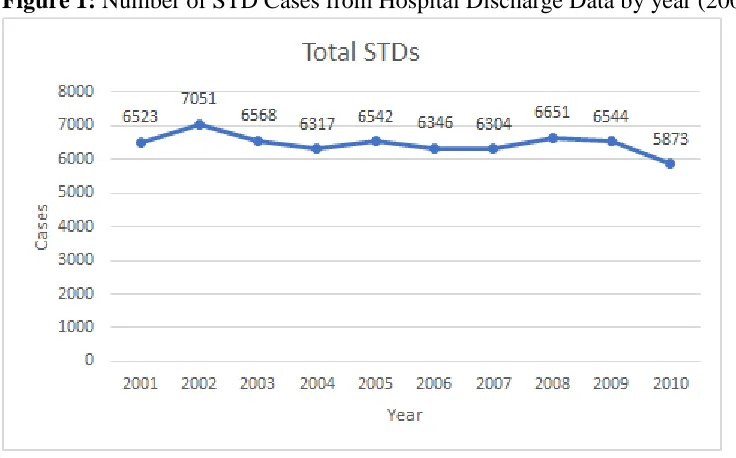
Figure 1. Number ofSTD Cases from Hospital Discharge Data by year (2001-2010).
Figure 2. Graph of Major STD Cases from Hospital Discharge Data by year (2001-2010).
viii
List of Abbreviations
HIV: Human immunodeficiency virus
STD/STI: Sexually transmitted disease/infection MSM: Men who have sex with men
HPV: Human papillomavirus PID: Pelvic inflammatory disease WHO: World health organization
9 CHAPTER I Introduction
1.1 Background
Sexually transmitted diseases (STDs) and HIV are still a major public health burden globally. According to the World Health Organization (WHO), globally there are more than 1 million sexually transmitted diseases and HIV infections acquired on a daily basis (CDC, 2016). In 1999, WHO estimated 340 million new cases of curable sexually transmitted diseases
globally; 79 million in Africa,191 million in Asia,14 million in North America and 38 million new cases in Latin America and the Caribbean (WHO HIV/AID, 2001). In a 2015 report, there was an estimate of 2 million HIV infections that occurred in Latin America, based on data from the Joint United Nations Program on HIV/AIDs (UNAIDS) (PAHO/WHO, 2017).
Generally, across most high-income countries, the rates of sexually transmitted diseases have declined dramatically, due to changes in socioeconomic status, risk behaviors,
implementation of prevention methods among others (Elliott et al., 2002). The morbidity and mortality of sexually transmitted diseases and HIV infections are still high in low and middle-income countries, which is partly due to lack of diagnostic tests, lack of testing centers, limited surveillance systems and inadequate sexual education. According to Gerbase et al. (1999), Latin America and the Caribbean have a high prevalence of sexually transmitted disease. Latin
America is the third most affected region of HIV and STDs after Africa and Asia. The pattern of STDs has been altered due to the change in social behavior, so information on the prevalence and incidence of STDs is important to monitor and manage an epidemic. In addition to causing acute morbidity, the other outcomes of sexually transmitted diseases include cervical cancer, male and female infertility, congenital syphilis, low birth weight and ectopic pregnancies among others (WHO/UNAIDS., 1999). Delays in diagnosis and treatment of STDs cause these acute complications and irreparable sequelae, and the recipients of these complications are usually women and children (Gerbase, Toscano, Silvia Titan, González-Salvatierra, & Zacarías, 1999).
There is little to no information regarding the temporal variations of sexually transmitted diseases and HIV infections in multiple Latin American countries, especially Chile which is considered a developing country. Data on STDs in Latin America and the Caribbean are limited due to the passive STD surveillance systems; the estimates of STDs reported depend on patient-seeking behaviors, quality of reporting and intensity of diagnosis (Gerbase et al., 1999). Due to the asymptomatic mechanism of some STDs, only a small number of symptomatic patients seek health care (Gerbase et al., 1999). In cases where symptoms occur, social stigma is associated with these diseases and this may lead to affected individuals seeking treatment outside of established healthcare systems or not seeking treatment at all (CDC, 2008). For some that seek treatment, the private health sectors are used rather than public health sectors to avoid
stigmatization and judgement. (CDC, 2008).
10
has shown improvement, sexually transmitted diseases have not been given top priority in the health-care system.
According to recent Chilean news reports, there has been an increase in HIV infections in the past five years, but there is limited information analyzing the trend of the most common sexually transmitted diseases in previous years. Information on the prevalence, incidence, and mortality of diseases are gotten either from surveillance reports and epidemiological studies (Gerbase et al., 1999). For this project, I will be collecting data from hospital discharges due to STDs as a form of surveillance reporting. According to the CDC, the list of the common STDs includes Bacterial Vaginosis, Chlamydia, Gonorrhea, Hepatitis, Herpes, HIV/AIDS, Human Papillomavirus Infection (HPV), Pelvic Inflammatory Disease (PID), Syphilis, Trichomoniasis, and other STDs such as Chancroid and Lymphogranuloma Venereum (LGV) (CDC, 2016).
1.2 Purpose of Study
The purpose of this study is to observe the patterns of sexually transmitted diseases and HIV using hospital discharges from 2001 to 2010 across all regions of Chile.
A. To determine the patterns in hospital discharges due to STDs across all regions, B. To examine the association between the STDs, gender and age through bivariate
analyses
C. To examine the association between STDs, gender, age and region through a multivariate analysis.
11 CHAPTER II LITERATURE REVIEW
2.1 Summary of HIV and STDs in Latin America and Caribbean Countries
The cases of sexually transmitted disease vary across age, gender and regions of a
country. Urban regions with a high population density are associated with a higher prevalence of sexually transmitted diseases, and the incidence rates of STDs are usually higher in youths and young adults between the ages of 15-49 years old. According to the 2015 data from the Joint United Nations Program on HIV/AIDS (UNAIDS), among the 2 million people infected with HIV in Latin America and the Caribbean, more than 98% were aged 15 and above
(PAHO/WHO, 2017). The prevalence of HIV infection ranges from 0.4 to 0.6% and has continued to be constant over the past 10 years. “The epidemic mainly affects men, represent 68% of the people with HIV” (PAHO/WHO, 2017). For curable sexually transmitted diseases, there are an estimated 64 million new cases annually among people aged 15 to 49 years. The key populations that are usually affected by sexually transmitted diseases are sex workers, men who have sex with men (MSM), and transgender women.
2.2 Patterns of HIV and STDs in Other Countries
In this review of the literature, we will be reporting on the patterns of STD cases from hospital discharges in different countries. For the purpose of this literature, terms such as
“diseases” and “infection” are used interchangeably. An article by Grover and Rajagopal (2009), focuses on the trend of STIs in a Bangalore tertiary care hospital over a 33-year period. The retrospective study analyzed the records of male soldiers who were diagnosed with a sexually transmitted disease from January 1974 to December 2006. The results revealed the most common STI to be chancroid which had 1684 (37.2%) cases out of 4532 observations. Syphilis was next with 737 cases (16.3%) followed by lymphogranuloma venereum (LGV) with 632 (13.9%) cases. The most common age group which supports other literature was between 21-30 years (Grover & Rajagopal, 2009). The results of the trend showed an overall decline in STD cases, especially for major STDs.
In an article by Chen et al. (2000), the time trend of sexually transmitted diseases in China was analyzed from 1989 to 1998 using a chi-squared test and a nonlinear regression model. The results of that study revealed that STD incidence increased drastically in both men and women. There was a nonlinear growth trend for all STDs except gonorrhea, and the incidence increased in females 4.20 times than that in males.
In another retrospective study by Gullette et al. (2009), the factors associated with sexually transmitted diseases were analyzed using logistic regression, multiple linear regression, and a chi-squared test. This study was seeking to answer the various question using the three different analysis; the logistic regression was applied for cases where the outcome was dichotomous, multiple linear regression was applied where the dependent variable was continuous, and the chi-squared test was applied to test for homogeneity.
12
predictor variable analysis, it was reported that more men used more condoms than women and among those who had an STI, more men reported having more sexual partners than women (Gullette et al., 2009). The chi-squared analysis was performed to observe if men and women who have STIs have new or more sexual partners than those who do not and the results revealed that the men reported having more sexual partners than women, but there were no significant differences between men and women who had prior sexual infections.
Generally, the themes of these articles reveal that men had a higher incidence of some STDs and HIV than women which is consistent with other research and the most common age group distribution with the highest STD and HIV cases are observed in people aged 21 years and above. All these highlighted studies display the prevalence of STDs and HIV and the key
13 CHAPTER III
METHODS
3.1 Data Collection and Data Sources
For this study, secondary analyses were run using data derived from the Chilean
Department of Health Statistics and Information (DEIS, 2018). This is the national database that collects information regarding hospital records from public and private health sectors.
Demographic information and daily discharges due to sexually transmitted diseases were obtained from the private health sector records from 2001 to 2010. The demographic data
collected included age, gender, ethnicity. Hospital data included the length of stay in the hospital, ICD-10 code diagnosis, date of patient hospital discharge, and the region of residence for the patients. Infections with any common STD was defined according to the International
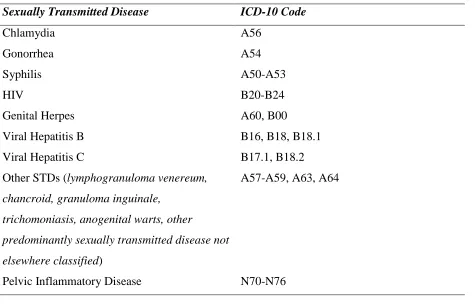
Classification of Disease (ICD-10). The descriptive list of the STDs chosen for this study is listed in Table 1.
3.2 Statistical Analysis
Between 2001 to 2010, a total of 64,719 patients from private hospitals records were diagnosed with an STD, the baseline number of patients from the hospital records from 2001 to 2010 was 15,983,971, female patients accounted for 61% while male patients accounted for 39%. Eighteen patients were excluded due to missing values. SAS Software (SAS 9.4, Cary NC) was used to clean, recode variables and perform statistical analyses. Descriptive analyses were performed to observe the frequency distribution of the demographic data. New variables were created to sum the number patients discharged due to each sexually transmitted disease. The region of residence was re-coded from numeric to character variables. An alpha level of 0.05 was set as a level of significance for all analyses. The variables analyzed in the study were the region of residence for the patients, gender, age, date of patient hospital discharge and length of stay in the hospital.
14
Table 1: List of Sexually Transmitted Diseases and ICD-10 code
Sexually Transmitted Disease ICD-10 Code
Chlamydia A56
Gonorrhea A54
Syphilis A50-A53
HIV B20-B24
Genital Herpes A60, B00
Viral Hepatitis B B16, B18, B18.1
Viral Hepatitis C B17.1, B18.2
Other STDs (lymphogranuloma venereum,
chancroid, granuloma inguinale,
trichomoniasis, anogenital warts, other
predominantly sexually transmitted disease not
elsewhere classified)
A57-A59, A63, A64
15 CHAPTER IV
RESULTS
4.1 Descriptive Statistics
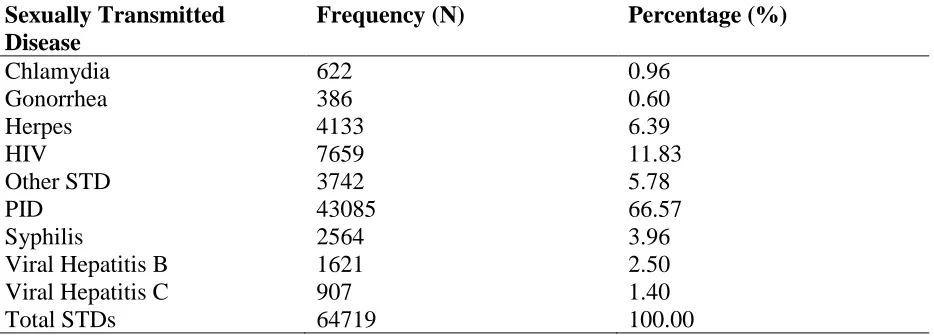
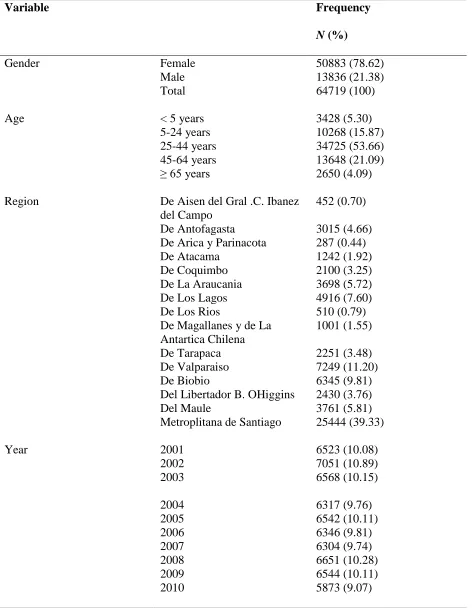
The descriptive analyses were reported as frequency and percentage in Table 2. A total number of 64719 patients were discharged from private hospitals due to a sexually transmitted disease. Of those, 64719 patients with STD cases, 79% (50833) were females and 22% (13836) were males. 54% of the STD cases arose from patients aged between 25-44 years, followed by patients aged 45-64 years which accounted for 22% of the STD cases. The region with the highest number of STD cases is Santiago accounting for 39% of the case. Pelvic inflammatory disease (PID), which only affects women, accounted for 85% (43085) of the STD cases among females. In 2002, there was an increase in the number of STD diagnoses compared to other years. PID, HIV, herpes and other STDs accounted for the majority of STD cases. Except for chlamydia, gonorrhea, and herpes, males had a higher number of STD cases. For Syphilis, males accounted for 58% of the cases. Males accounted for 84%, 58% and 72% of cases for HIV, Other STD, and Viral Hepatitis B respectively.
4.2 Logistic Regression
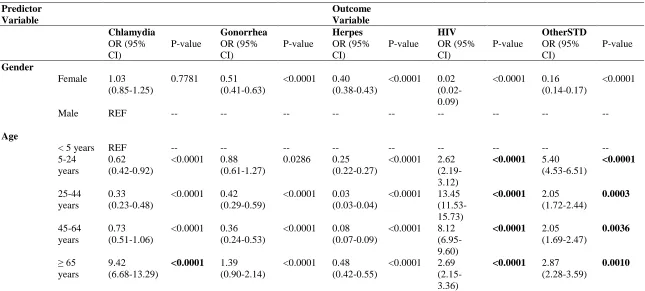
The bivariate and multivariate logistic regression analyses were reported as unadjusted odds ratio and adjusted odds ratio respectively, and 95% confidence interval (CI) in Table 4 and 5. The bivariate analyses was performed to determine the associations between the outcome variable (STDs) and the predictor variable (gender and age) separately. The multivariate analyses performed to determine the relationship between the outcome variable (STDs) and predictor variable (age, gender and region), controlling for region. Males were chosen as the reference group for the analyses, denoted as REF in Table 4. For HIV outcomes, the results revealed that the odds of female patients being diagnosed with HIV were (AOR 0.02, 95% CI:0.021-0.024) when compared to male patients, adjusting for age and region. For the outcome of chlamydia, the odds of a female patient being diagnosed was (AOR 1.03, 95% CI 0.85, 1.25) when compared to male patients. For syphilis, the odds of a female patient being diagnosed with syphilis was (AOR 0.31, 95% CI: 0.28-0.34). The odds of being diagnosed with herpes was lower for female
patients (AOR 0.36, 95% CI: 0.34-0.39) compared to males, however the results were not statistically significant. The second analyses were the association between all STDs and age groups.
The age group with the highest number of STD cases were 25-44-year olds 53.7% (34725). For HIV outcomes, the adjusted odds of 25-44-year-old patients being diagnosed with HIV was 11.93 times the odds of patients under 5 being diagnosed with HIV. For chlamydia, the adjusted odds of patients aged ≥ 65 years being diagnosed with chlamydia was 7.15 times the odds of patients under 5 having chlamydia. Patients aged ≥ 65 years had an increased odds (AOR 288.12) of being diagnosed with viral hepatitis c when compared to patients under 5. For PID, which affects only women, 25-44-year-old patients had an increased odds (AOR 579.7) of being diagnosed with PID when compared to patients under 5. The results from the association
16
Table 2: Pattern of STDs from Hospital Discharges (N=64719).
Sexually Transmitted Disease
Frequency (N) Percentage (%)
Chlamydia 622 0.96
Gonorrhea 386 0.60
Herpes 4133 6.39
HIV 7659 11.83
Other STD 3742 5.78
PID 43085 66.57
Syphilis 2564 3.96
Viral Hepatitis B 1621 2.50
Viral Hepatitis C 907 1.40
Total STDs 64719 100.00
17
Table 3: Descriptive Statistics of Hospital Discharge Data, 2001-2010.
Variable Frequency
N (%)
Gender Female 50883 (78.62)
Male 13836 (21.38)
Total 64719 (100)
Age < 5 years 3428 (5.30)
5-24 years 10268 (15.87)
25-44 years 34725 (53.66)
45-64 years 13648 (21.09)
≥ 65 years 2650 (4.09)
Region De Aisen del Gral .C. Ibanez
del Campo
452 (0.70)
De Antofagasta 3015 (4.66) De Arica y Parinacota 287 (0.44) De Atacama 1242 (1.92) De Coquimbo 2100 (3.25)
De La Araucania 3698 (5.72) De Los Lagos 4916 (7.60)
De Los Rios 510 (0.79) De Magallanes y de La
Antartica Chilena
1001 (1.55)
De Tarapaca 2251 (3.48) De Valparaiso 7249 (11.20) De Biobio 6345 (9.81) Del Libertador B. OHiggins 2430 (3.76)
Del Maule 3761 (5.81) Metroplitana de Santiago 25444 (39.33)
Year 2001 6523 (10.08) 2002 7051 (10.89) 2003
6568 (10.15)
18
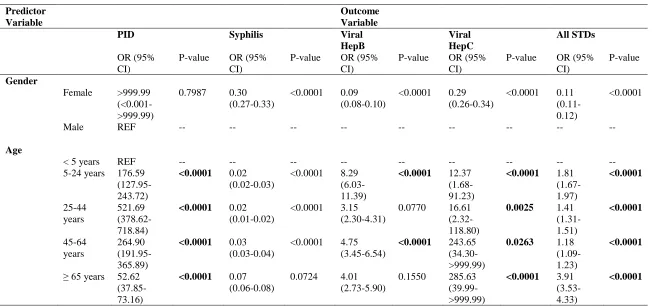
Table 4: Bivariate Logistic Regression of Outcome Variables by Gender and Age using Hospital Discharge Data. N= 64719
*OR= odds ratio; CI= confidence interval. Bold indicates statistically significant at p-value <0.05.
Predictor Variable
Outcome Variable
Chlamydia Gonorrhea Herpes HIV OtherSTD
OR (95% CI)
P-value OR (95% CI)
P-value OR (95% CI)
P-value OR (95% CI)
P-value OR (95% CI)
P-value
Gender
Female 1.03 (0.85-1.25)
0.7781 0.51 (0.41-0.63)
<0.0001 0.40 (0.38-0.43)
<0.0001 0.02 (0.02-0.09)
<0.0001 0.16 (0.14-0.17)
<0.0001
Male REF -- -- -- -- -- -- -- -- --
Age
< 5 years REF -- -- -- -- -- -- -- -- --
5-24 years
0.62 (0.42-0.92)
<0.0001 0.88 (0.61-1.27)
0.0286 0.25 (0.22-0.27)
<0.0001 2.62 (2.19-3.12)
<0.0001 5.40
(4.53-6.51) <0.0001 25-44 years 0.33 (0.23-0.48)
<0.0001 0.42 (0.29-0.59)
<0.0001 0.03 (0.03-0.04)
<0.0001 13.45 (11.53-15.73)
<0.0001 2.05
(1.72-2.44) 0.0003 45-64 years 0.73 (0.51-1.06)
<0.0001 0.36 (0.24-0.53)
<0.0001 0.08 (0.07-0.09)
<0.0001 8.12 (6.95-9.60)
<0.0001 2.05
(1.69-2.47) 0.0036 ≥ 65 years 9.42 (6.68-13.29)
<0.0001 1.39
(0.90-2.14)
<0.0001 0.48 (0.42-0.55)
<0.0001 2.69 (2.15-3.36)
<0.0001 2.87
(2.28-3.59)
19
Table 4 Cont’d: Bivariate Logistic Regression of Outcome Variables by Gender and Age using Hospital Discharge Data.
*OR= odds ratio; CI= confidence interval. Bold indicates statistically significant at p-value <0.05.
Predictor Variable
Outcome Variable
PID Syphilis Viral
HepB Viral HepC All STDs OR (95% CI)
P-value OR (95% CI)
P-value OR (95% CI)
P-value OR (95% CI)
P-value OR (95% CI)
P-value
Gender
Female >999.99 (<0.001->999.99)
0.7987 0.30 (0.27-0.33)
<0.0001 0.09 (0.08-0.10)
<0.0001 0.29 (0.26-0.34)
<0.0001 0.11 (0.11-0.12)
<0.0001
Male REF -- -- -- -- -- -- -- -- --
Age
< 5 years REF -- -- -- -- -- -- -- -- --
5-24 years 176.59 (127.95-243.72)
<0.0001 0.02
(0.02-0.03)
<0.0001 8.29 (6.03-11.39)
<0.0001 12.37
(1.68-91.23)
<0.0001 1.81
(1.67-1.97) <0.0001 25-44 years 521.69 (378.62-718.84)
<0.0001 0.02
(0.01-0.02)
<0.0001 3.15 (2.30-4.31)
0.0770 16.61 (2.32-118.80)
0.0025 1.41
(1.31-1.51) <0.0001 45-64 years 264.90 (191.95-365.89)
<0.0001 0.03
(0.03-0.04)
<0.0001 4.75 (3.45-6.54)
<0.0001 243.65
(34.30->999.99)
0.0263 1.18
(1.09-1.23)
<0.0001
≥ 65 years 52.62 (37.85-73.16)
<0.0001 0.07
(0.06-0.08)
0.0724 4.01 (2.73-5.90)
0.1550 285.63 (39.99->999.99)
<0.0001 3.91
(3.53-4.33)
20
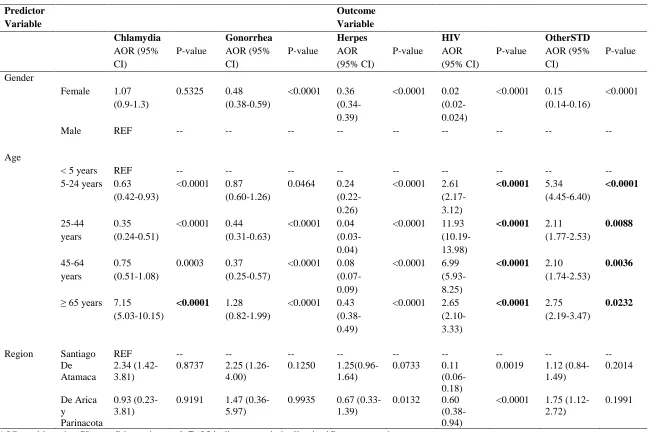
Table 5: Multivariate Logistic Regression of Outcome Variables by Gender, Age and Region.
*OR= odds ratio; CI= confidence interval. Bold indicates statistically significant at p-value <0.05.
Predictor Variable
Outcome Variable
Chlamydia Gonorrhea Herpes HIV OtherSTD
AOR (95% CI)
P-value AOR (95% CI)
P-value AOR (95% CI)
P-value AOR (95% CI)
P-value AOR (95% CI)
P-value
Gender
Female 1.07 (0.9-1.3)
0.5325 0.48 (0.38-0.59)
<0.0001 0.36 (0.34-0.39)
<0.0001 0.02 (0.02-0.024)
<0.0001 0.15 (0.14-0.16)
<0.0001
Male REF -- -- -- -- -- -- -- -- --
Age
< 5 years REF -- -- -- -- -- -- -- -- --
5-24 years 0.63 (0.42-0.93)
<0.0001 0.87 (0.60-1.26)
0.0464 0.24 (0.22-0.26)
<0.0001 2.61 (2.17-3.12)
<0.0001 5.34
(4.45-6.40) <0.0001 25-44 years 0.35 (0.24-0.51)
<0.0001 0.44 (0.31-0.63)
<0.0001 0.04 (0.03-0.04)
<0.0001 11.93 (10.19-13.98)
<0.0001 2.11
(1.77-2.53) 0.0088 45-64 years 0.75 (0.51-1.08)
0.0003 0.37 (0.25-0.57)
<0.0001 0.08 (0.07-0.09)
<0.0001 6.99 (5.93-8.25)
<0.0001 2.10
(1.74-2.53)
0.0036
≥ 65 years 7.15 (5.03-10.15)
<0.0001 1.28
(0.82-1.99)
<0.0001 0.43 (0.38-0.49)
<0.0001 2.65 (2.10-3.33)
<0.0001 2.75
(2.19-3.47)
0.0232
Region Santiago REF -- -- -- -- -- -- -- -- --
De Atamaca
2.34 (1.42-3.81)
0.8737 2.25 (1.26-4.00)
0.1250 1.25(0.96-1.64)
0.0733 0.11 (0.06- 0.18)
0.0019 1.12 (0.84-1.49) 0.2014 De Arica y Parinacota 0.93 (0.23-3.81)
0.9191 1.47 (0.36-5.97)
0.9935 0.67 (0.33-1.39)
0.0132 0.60 (0.38-0.94)
<0.0001 1.75 (1.12-2.72)
21
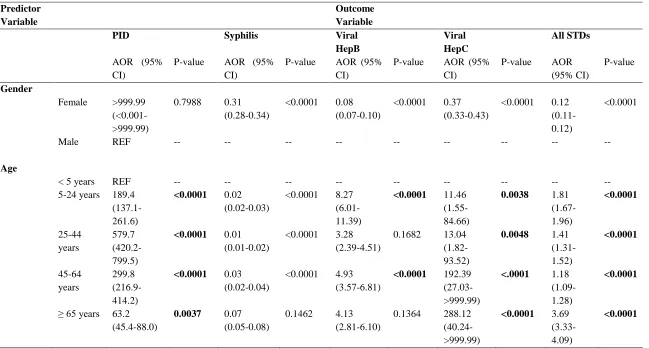
Table 5 Cont’d: Multivariate Logistic Regression of Outcome Variables by Gender, Age and Region.
*OR= odds ratio; CI= confidence interval. Bold indicates statistically significant at p-value <0.05.
Predictor Variable
Outcome Variable
PID Syphilis Viral
HepB
Viral HepC
All STDs
AOR (95% CI)
P-value AOR (95% CI)
P-value AOR (95% CI)
P-value AOR (95% CI)
P-value AOR (95% CI)
P-value
Gender
Female >999.99 (<0.001->999.99)
0.7988 0.31 (0.28-0.34)
<0.0001 0.08 (0.07-0.10)
<0.0001 0.37 (0.33-0.43)
<0.0001 0.12 (0.11-0.12)
<0.0001
Male REF -- -- -- -- -- -- -- -- --
Age
< 5 years REF -- -- -- -- -- -- -- -- --
5-24 years 189.4 (137.1-261.6)
<0.0001 0.02
(0.02-0.03)
<0.0001 8.27 (6.01-11.39)
<0.0001 11.46
(1.55-84.66)
0.0038 1.81
(1.67-1.96) <0.0001 25-44 years 579.7 (420.2-799.5)
<0.0001 0.01
(0.01-0.02)
<0.0001 3.28 (2.39-4.51)
0.1682 13.04 (1.82-93.52)
0.0048 1.41
(1.31-1.52) <0.0001 45-64 years 299.8 (216.9-414.2)
<0.0001 0.03
(0.02-0.04)
<0.0001 4.93 (3.57-6.81)
<0.0001 192.39
(27.03->999.99)
<.0001 1.18
(1.09-1.28)
<0.0001
≥ 65 years 63.2 (45.4-88.0)
0.0037 0.07
(0.05-0.08)
0.1462 4.13 (2.81-6.10)
0.1364 288.12 (40.24->999.99)
<0.0001 3.69
(3.33-4.09)
22
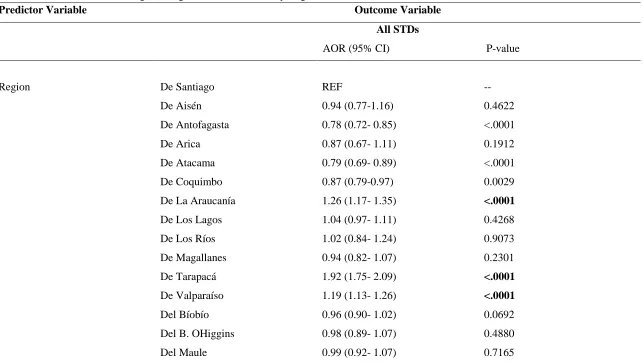
Table 5 Cont’d: Multivariate Logistic Regression of All STDs by Region
Predictor Variable Outcome Variable
All STDs
AOR (95% CI) P-value
Region De Santiago REF
--De Aisén 0.94 (0.77-1.16) 0.4622
De Antofagasta 0.78 (0.72- 0.85) <.0001
De Arica 0.87 (0.67- 1.11) 0.1912
De Atacama 0.79 (0.69- 0.89) <.0001
De Coquimbo 0.87 (0.79-0.97) 0.0029
De La Araucanía 1.26 (1.17- 1.35) <.0001
De Los Lagos 1.04 (0.97- 1.11) 0.4268
De Los Ríos 1.02 (0.84- 1.24) 0.9073
De Magallanes 0.94 (0.82- 1.07) 0.2301
De Tarapacá 1.92 (1.75- 2.09) <.0001
De Valparaíso 1.19 (1.13- 1.26) <.0001
Del Bíobío 0.96 (0.90- 1.02) 0.0692
Del B. OHiggins 0.98 (0.89- 1.07) 0.4880
Del Maule 0.99 (0.92- 1.07) 0.7165
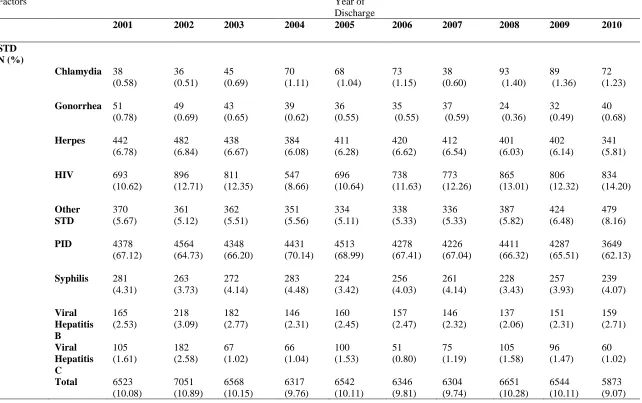
23 Table 6: STD Hospital Discharge Cases by year (N= 64719).
Factors Year of
Discharge
2001 2002 2003 2004 2005 2006 2007 2008 2009 2010
STD N (%)
Chlamydia 38
(0.58) 36 (0.51) 45 (0.69) 70 (1.11) 68 (1.04) 73 (1.15) 38 (0.60) 93 (1.40) 89 (1.36) 72 (1.23)
Gonorrhea 51
(0.78) 49 (0.69) 43 (0.65) 39 (0.62) 36 (0.55) 35 (0.55) 37 (0.59) 24 (0.36) 32 (0.49) 40 (0.68)
Herpes 442
(6.78) 482 (6.84) 438 (6.67) 384 (6.08) 411 (6.28) 420 (6.62) 412 (6.54) 401 (6.03) 402 (6.14) 341 (5.81)
HIV 693
(10.62) 896 (12.71) 811 (12.35) 547 (8.66) 696 (10.64) 738 (11.63) 773 (12.26) 865 (13.01) 806 (12.32) 834 (14.20) Other STD 370 (5.67) 361 (5.12) 362 (5.51) 351 (5.56) 334 (5.11) 338 (5.33) 336 (5.33) 387 (5.82) 424 (6.48) 479 (8.16)
PID 4378 (67.12) 4564 (64.73) 4348 (66.20) 4431 (70.14) 4513 (68.99) 4278 (67.41) 4226 (67.04) 4411 (66.32) 4287 (65.51) 3649 (62.13)
Syphilis 281
(4.31) 263 (3.73) 272 (4.14) 283 (4.48) 224 (3.42) 256 (4.03) 261 (4.14) 228 (3.43) 257 (3.93) 239 (4.07) Viral Hepatitis B 165 (2.53) 218 (3.09) 182 (2.77) 146 (2.31) 160 (2.45) 157 (2.47) 146 (2.32) 137 (2.06) 151 (2.31) 159 (2.71) Viral Hepatitis C 105 (1.61) 182 (2.58) 67 (1.02) 66 (1.04) 100 (1.53) 51 (0.80) 75 (1.19) 105 (1.58) 96 (1.47) 60 (1.02)
Total 6523
24
[image:25.612.71.439.95.324.2]Figure 1: Number of STD Cases from Hospital Discharge Data by year (2001-2010).
26 CHAPTER V
DISCUSSION AND CONCLUSION
Pelvic Inflammatory Disease (PID) was found to be the most common sexually transmitted disease among women based on the hospital discharge data. The diagnosis of PID accounted for 43,085 (66.57%) of the STDs that were reported by private hospitals from 2001-2010. PID is an infection of the upper reproductive tract of a female (Das, Ronda, & Trent, 2016). Neisseria gonorrhoeae and Chlamydia trachomatis among others are usually associated in the cases of PID (Das et al., 2016). PID mainly affects women of fertile ages between 15 and 49 years (De la Torre, 1980). According to Das et al., an article estimated that one in five PID cases develop in women younger than 19 years (Das et al., 2016). In another study, when compared to other younger age groups, adolescents and young women who were aged between 17-21 years were twice as likely to be diagnosed with PID (Goyal et al., 2013). The results of this study revealed that PID diagnosis among 25-44 years old women was the highest when compared to other age groups. Females aged 25-44 years were 579.7 (95% CI, 420.2-799.5) times more likely to be diagnosed with PID when compared to females under 5 years. The results from this study are consistent with the results from other studies regarding the population
affected. Females aged 5-24 years had an adjusted odds of 189 (95% CI, 137.1-261.6) when compared to females under 5 years. Patients under five were chosen as the reference group as they are usually not sexually active and have a lower risk of getting an STD.
The second most common diagnosis of STDs was HIV which accounted for 11.83%. Based on the results of this study, we observed that males were associated with an increased odds of being diagnosed with HIV when compared to females (0.02 95% CI: 0.02-0.09 p-value = <0.0001). Females have a 50 lower odds of being diagnosed with HIV when compared to males. Studies have shown that the vital population affected by HIV in Latin America countries include: men who have sex with men (MSM), female sex workers and intravenous drug users (IDU) (Miller, Buckingham, Sanchez-Dominguez, Morales-Miranda, & Paz-Bailey, 2013). Though information about the patient’s sexual orientation was not included in the dataset, our results are however consistent with other studies regarding the vital population most affected by HIV. Generally, the HIV epidemic in Latin America has an estimated population prevalence of 0.5% (95% CI: 0.4-0.6) (Miller et al., 2013). The age group most affected by HIV diagnosis were 25-44 years old, accounting for 66% (5050) of all HIV diagnosis. Patients who were aged 25-25-44 years were 11.93 (95% CI: 10.19-13.98) times more likely to be diagnosed when compared to the reference group. Majority of the diagnosis were from Santiago, the capital of Chile.
27
Other STDs which includes lymphogranuloma venereum, chancroid, granuloma inguinale, trichomoniasis, anogenital warts, other predominantly sexually transmitted disease not elsewhere classified accounted for 6% of the total STD cases. 25-44-year-old patients had the highest number of cases among all age groups and accounted for 43%, followed by patients aged 5-24 years, accounting for 30%.
The odds of being diagnosed with chlamydia in females was 1.03 times more than being diagnosed in males. Females are at a higher risk of having complications due to untreated chlamydia.
The hospital cases for syphilis accounted for 4% of the total STDs. The adjusted odds of females being diagnosed with syphilis was 0.30 (95% CI: 0.28-0.34). An interesting observation was that patients less than five years old accounted for 63% (1577) among all age groups. Patients who were aged between 25-44 years had decreased odds of being diagnosed with syphilis 0.01 (95% CI: 0.01-0.02) compared to patients less than 5 years. The cause of the high number of syphilis among this age group could be due to congenital syphilis. The prevalence of congenital syphilis has been increasing globally, in part this is due to inadequate antenatal care services and subpar STD control programs (Saloojee, 2004). In Latin America and Africa, it is estimated that 2 to 15% of all pregnancies occur in women with untreated syphilis (CDC, 2008). Women who are infected with syphilis are 12 times more likely to have adverse pregnancy outcomes than women without syphilis. Among infants exposed to syphilis, it is estimated that about 25-75% will have congenital syphilis (Phiske, 2014).
The incidence of STDs varies by geographic location. Santiago was the region that had the highest number of STD cases accounting for 39.3%. Santiago is the capital and the largest city in Chile, which contributes to the high frequency of STD cases; there was an increase in population in 2002 and then continued to grow slowly over the next years (“Santiago Population 2018 (Demographics, Maps, Graphs),” 2018). Due to the change in socioeconomic and cultural environment, there has been an increase in the migration of people from rural areas to urban areas which have had an impact in the increase of sexually transmitted diseases and HIV prevalence in the urban areas of countries (Chen, 2000).
Limitations and Strengths
One limitation of this study was that there was limited literature on sexually transmitted diseases in Chile and other Latin American countries. Some of the literature found were written in Spanish, with no option of translating to English. Another limitation was related to the access of articles; most studies in Chile that involved sexually transmitted diseases were not available to the public. Another limitation of this study was the dataset itself; the hospital discharge dataset had no information on the income, education and sexual orientation of the patients. This information would have been beneficial in observing the key populations affected by the most common STDs. The rate of disease couldn’t be included due the fact that the hospital records were from private health sectors, so it would not be representative of the general population. The last limitation is that the dataset was obtained from private hospitals rather than public hospitals, which would not give us access to a diverse demographic and socioeconomic profile of the population.
28
Implications of Findings
The implication of this study is that interventions can be set in place to prevent the potential rise of STDs in Chile. An example of an intervention can be promoting safe sex practices among young adults, building more STD testing clinics in the metropolitan areas of Chile. This will aid in the improvement of Chile’s surveillance systems.
Conclusion
29 References
1. Alonso, F. T., & Marincovich, B. (2008). Late Diagnosis of HIV Infection in Santiago, Chile. Characteristics and Risk Factors in Men. International Journal of Infectious Diseases, 12, e157. doi:10.1016/j.ijid.2008.05.389
2. Aurelio Salvo, L. (2011). Infecciones de transmisión sexual (ITS) en chile. Revista Médica Clínica Las Condes, 22(6), 813-824. doi:10.1016/S0716-8640(11)70494-1 3. AVERT. (2015). HIV and AIDS in Latin America the Caribbean regional overview.
AVERT.
4. CDC. CDC - STD Diseases & Related Conditions. Retrieved from https://www.cdc.gov/std/general/default.htm
5. CDC and World Bank. (2008). Sexually Transmitted Infections In Developing Countries Current concepts and strategies on improving STI prevention, treatment, and control. Retrieved from World Bank:
6. CDC Travelers' Health. Sexually Transmitted Diseases - Chapter 3 - 2018 Yellow Book | Travelers' Health | CDC.
7. Chen, X., Gong, X., Liang, G., & Zhang, G. (2000). epidemiologic Trends of Sexually Transmitted Diseases in China. Sexually Transmitted Diseases, 27(3), 138–142. 8. Das, B. B., Ronda, J., & Trent, M. (2016). Pelvic inflammatory disease: improving
awareness, prevention, and treatment. Infection and Drug Resistance, 9, 191-197. doi:10.2147/IDR.S91260
9. De la Torre, L. A. (1980). Problems and proposals for the surveillance and control of sexually transmitted diseases associated with pelvic inflammatory disease in South America. American Journal of Obstetrics & Gynecology, 138(7), 1078-1081. doi:10.1016/0002-9378(80)91111-4
10.Elliott, L. J., Blanchard, J. F., Beaudoin, C. M., Green, C. G., Nowicki, D. L., Matusko, P., & Moses, S. (2002). Geographical variations in the epidemiology of bacterial sexually transmitted infections in Manitoba, Canada. Sex Transm Infect, 78 Suppl 1, i139-144. 11.Gerbase, A. C., Toscano, C., Silvia Titan, P. C., González-Salvatierra, R., & Zacarías, F.
(1999). Sexually transmitted diseases in Latin America and the Caribbean. Revista Panamericana de Salud Pública.
12.Goyal, M., Hersh, A., Luan, X., Localio, R., Trent, M., & Zaoutis, T. (2013). National Trends in Pelvic Inflammatory Disease among Adolescents in the Emergency
Department. The Journal of adolescent health : official publication of the Society for Adolescent Medicine, 53(2), 249-252. doi:10.1016/j.jadohealth.2013.03.016
13.Grover, S., & Rajagopal, R. (2009). Trends of Sexually Transmitted Infections : A 33 Year Experience. Medical Journal, Armed Forces India, 65(3), 235-236.
doi:10.1016/S0377-1237(09)80011-7
14.Gullette, D. L., Rooker, J. L., & Kennedy, R. L. (2009). Factors Associated With Sexually Transmitted Infections in Men and Women. Journal of community health nursing, 26(3), 121-130. doi:10.1080/07370010903034425
15.JAIDS Journal of Acquired Immune Deficiency Syndromes. HIV-1, Sexually
30
16.Joint United Nations Programme on, H. A. (2010). Global report: UNAIDS report on the global aids epidemic : 2010. Geneva: UNAIDS.
17.Krieger, N., Waterman, P. D., Chen, J. T., Soobader, M.-J., & Subramanian, S. V. (2003). Monitoring Socioeconomic Inequalities in Sexually Transmitted Infections, Tuberculosis, and Violence: Geocoding and Choice of Area-Based Socioeconomic Measures—The Public Health Disparities Geocoding Project (US). Public Health Reports, 118(3), 240-260. doi:10.1093/phr/118.3.240
18.Looker, K. J., Garnett, G. P., & Schmid, G. P. (2008). An estimate of the global
prevalence and incidence of herpes simplex virus type 2 infection. Bulletin of the World Health Organization, 86(10), 805-812. doi:10.2471/BLT.07.046128
19.Miller, W. M., Buckingham, L., Sanchez-Dominguez, M. S., Morales-Miranda, S., & Paz-Bailey, G. (2013). Systematic review of HIV prevalence studies among key
populations in Latin America and the Caribbean. Salud Publica Mex, 55 Suppl 1, S65-78. 20.Missoni, E., & Solimano, G. (2010). Towards Universal Health Coverage: the Chilean
experience. Retrieved from World Health Organization:
http://www.who.int/healthsystems/topics/financing/healthreport/4Chile.pdf 21.Pan American Health Organization.(2007). Chile - Health in the Americas 2007 -
Volume II.Retrieved from Pan American Health Organization:
https://www.paho.org/hia2007/archivosvol2/paisesing/Chile%20English.pdf
22.World Health Organization & HIV/AIDS., J. U. N. P. o. (1999). Sexually Transmitted Diseases: Policies and Principles for Prevention and Care: WHO/UNAIDS.
23.Santiago Population 2018 (Demographics, Maps, Graphs). (n.d.).
24. Retrieved September 22, 2018, from http://worldpopulationreview.com/world-cities/santiago-population/
25.Sexually Transmitted Diseases (STDs). (2016, November 20, 2017). Diseases & Related Conditions. Retrieved from https://www.cdc.gov/std/general/default.htm
26.Sexually transmitted infections (STIs). (2016). Facts Sheet. Retrieved from
http://www.who.int/news-room/fact-sheets/detail/sexually-transmitted-infections-(stis) 27.sexually transmitted infections. Retrieved from
https://www.paho.org/salud-en-las-americas-2017/?tag=sexually-transmitted-infections 28.files/111/salud-en-las-americas-2017.html