EVOLUTION OF SHOCK TOWER DESIGNUSING REVERSE
ENGINEERING TECHNOLOGY
Rajesh L.
1and Krishnamoorthy A.
21
Sathyabhama Institute of Science and Technology Chennai, India
2Department of Mechanical Engineering, Sathyabhama Institute of Science and Technology Chennai, India
E-Mail: [email protected]
ABSTRACT
Shock tower is an important automotive suspension components to absorb the shock loading condition by withstand its structure between the strut bars, where the spring and shock absorber are combined in one suspension unit which also replaces the upper control arm, the entire vertical suspension load is transmitted to the top of the vehicle's strut tower, where the spring and shock absorber may share the load separately. Therefore, in industries the finite element analysis of shock tower components is carried by several road load condition to obtain better result in durability fatigue analysis. So the principle of the project is evolving shock tower design using the reverse engineering processes. This evolution of design will provide comparatively better result matches with actual condition. The processes involve in project are transformation of fine mesh from standard tessellation language (STL) file which is scanned from the competitor model and need to pass away the static analysis for given yield condition of the material and to carry the fatigue test for several load condition to obtain better quality than the scanned model. Moreover, the Main objective of the project is to evolve a design without any specific consideration and standard as it is going to evolve from reverse engineering based object so it must be satisfy the actual automotive consideration.
Keywords: shock tower, reverse engineering, static analysis, fatigue analysis, finite element analysis.
INTRODUCTION
The primary goal of the shock tower is to with stand its structure during loading condition of the suspension strut bars. Shock tower also considered as suspension auxiliary which used provide extra stiffness to unibody structure of strut towers. So there two types shock tower used in automobile structure is unibody shock tower and body on frame shock tower.
Unibody shock tower is considered as uniform thickness throughout the structure and it is mainly used in low loaded vehicles shown in Figure-1.
Body on frame shock tower is considered as This type of shock tower were made up of casting processes a thick gauge steel frame provides the foundation for holding other parts. These types of construction are commonly used in large trucks and SUVs as shown in Figure-2.
Figure-1. Unibody shock tower.
Figure-2. Body on frame shock tower.
Literature survey on shock tower design
Cajuhi.A, et al., [1] investigated the nonlinear considerations in shock tower durability analysis. During usual vehicle life, the shock absorber towers might be submitted to high road impact loads. After durability tests plastic deformation was observed in the front shock towers, close to the shock absorber bolts attachment neighborhood. Excessive deformation in that area can cause deviation in the suspension system geometry that could drive the shock absorbers to malfunction. Although the real life load is very intense, it acts during a very short period of time requiring more than a material nonlinear or a large displacements analysis to have the proper strain distribution. The solution method consists on a local non-linear finite element analysis using incremental loads to simulate the plastic deformation measured in tested vehicles and a finite element fatigue life analysis using a full trimmed body vehicle model subjected to the full test road impact loads.
engineering (CAE), together with CAD (computer aided design) and CAM (computer aided manufacturing), is an effective tool to shorten the product development cycle, to decrease the cost, and to improve the product quality of full vehicle development programs. Faster computers, cost effective hardware, and advanced software technology have accelerated CAE technology to the point that a new approach to simulating proving ground test conditions has been developed and implemented for full vehicle development programs. This paper discusses this new and integrated approach, called virtual proving ground (VPG), and includes studies of road load generation, durability, vehicle crashworthiness, occupant safety, and noise/vibration/harshness (NHV). Full vehicle test conditions are analyzed using the real-time, dynamic, non-linear, analysis code, LS/DYNA3D and the results are processed using the general purpose pre- and postprocessor, ETA/FEMB, which is included in the software package known as the ETA/virtual proving ground (VPG).The VPG approach is implemented into a full vehicle development program as part of the commonly used four phase engineering procedure to predict a vehicle test performance six months before the actual prototype is ready to be tested on a proving ground.
Schifko. M, et al., [3] investigated the automatic cad data preparation for CAE. Simulations need high quality mesh representations as input which is often manually prepared. The fully automatic mesh preprocessor software MERGE avoids this time consuming task. The software CAD or STL data as input, repairs invalid meshes and merges the input objects together. Small gaps between the input objects are automatically closed. The output surface mesh can be supplied in two different flavors, either as a mesh that minimizes the number of elements or as a mesh consisting of high quality triangles, ready for 3D meshing. A closed and connected surface mesh of an entire car body can be prepared overnight in a fully automatic manner.
Stampouli. M, et al., [4] investigated the work flow management of an automotive simulation scenario, the growing complexity of simulation and analysis for new products has created new challenges in improving CAE productivity and effectiveness. The information required for down-streaming CAE processes is often unavailable, untraceable, outdated or susceptive to human errors and the information of previous best practices is not usually captured as applicable knowledge for future use. Additionally, the CAE cycle is a collaborative process involving not only data but also human and non-human resources, rendering a solution with a holistic approach essential. This work describes how these challenges are addressed by the Simulation Process, Data and Resources Management (SPDRM) system. A real-case industry scenario is used to demonstrate how CAE data and activities can be associated with the available resources, while defining and handling workflows in a common environment. This scenario discusses a CAE analysis process, validated by a renowned automotive OEM. The process workflow consists of the simulation setup, the post-processing of results and the reporting phase. During
the process, data and meta-data are streamed to the right resources, whilst a workflow process network and its progress are visually available. As resulted by the deployment of the automotive simulation scenario and validated by the OEM industry, the proposed framework proves to have a positive effect, on the development of a methodological referential, and on the implementation of a collaborative platform for multi-users and multi engineering tasks in CAE workflow processes. Moreover, the importance of introducing an integrated tool that addresses the CAE management problems and improves the sharing of knowledge is highlighted.
Objectives
In this case, we need to evolve a new design of shock tower for the development study of a vehicle so there is some complication in producing the new design. This complexity factors that incudes cost, Strength, Stiffness or rigidity, testing and verification, analysis iteration levels, Stress distribution and time consumption for new design processes.
So these were the major problem facing on creation of new design of complicated structure of Shock tower, this also requires lot of experimental study and design ethics to create a model data, and there is also facing some issues to manage the part structure in neighbor components, so we facing the compliancy to recreate the parts structure which lies near the shock tower components. Due to this recreation of design of the neighbor components of shock tower, lot of new design processes evolved for this system.
To overcome the complication of the new design processes of shock tower we following the Reverse Engineering processes. In this processes we capturing the 3D scanned STL model of the shock tower from competitor vehicle and then STL mesh is converted to the refined mesh to obtain quality criteria of static analysis. And several load cases are predefined to obtain results to satisfy the static and fatigue analysis condition.
The main objective of reverse engineering processes is creating the new design of shock tower need to be evolved with some extra features than the competitor product design.
The aim of the project is to evolve a design of shock tower using reverse engineering processes instead of new design process (forward engineering) so it can able to reduces the complication faced during the evaluation of new design processes corresponding with satisfactory result and better feedback.
Due to this processes we can simulate the better result than the competitor product by taking the competitor product as base design
PROCESSES METHODOLOGY
Processes flow
Figure-3. Process methodology.
Reverse engineering
Reverse engineering processes is applied to the competition shock tower model to scan the model using 3D scanner and to generate the STL (Standard Tessellation Language) file with the help of Ansav1624 software we can view the structure of the parts as shown in Figure-4.
Figure-4. STL view of shock tower.
Discretization
To overcome the defects of STL files such as irregular Tria mesh and irregular scanning pattern it is necessary to follow the processes, as output of STL file is an orientation of cloud structure so it is difficult to segregate the part or to view its function so it is important to run part segregation processes.
Some of the mesh defects are shown in Figure-5.
Figure-5. Irregular Tria mesh structure.
In this processes the mesh are locally reconstructed to the given standard parameter.
Table-1. Quality parameter of FE element.
The process is often carried out by FEM software like ANSA v 1624 using coordinate data generated from the subdomains of STL file.
The part mesh after refinement is shown in Figure-6 in this process parts are segregated with different property and clear part structure as per the vehicle classification.
Figure-6. Refinement of mesh.
Material property selection
After completion of the mesh model of shock tower, it is necessary to define the material property to the shock tower part.
To decrease the iteration level of analysis it is necessary to select the material property that contains lower yield point.
In this case Material grade of MS264-030SK HR is defined as a shock tower material as it has lower yield value as compare to other material property.
The yield value of the material MS264-030SK HR is 233MPA, Young’s Modulus value is 208000MPA, Density is 7.84e-9 Tone/mm3, Poisons ratio is 0.3.
The yield stress table and stress strain curve of material MS264-030SK HRis discussed in Table-2.
Table-2. Material yield and corresponding stress relation.
S. No Stress Strain
Figure-7. Material yield stress and corresponding strain curve.
Identification of yield load
In static analysis, the load is assigned is fixed it can’t be increased or decreased so it is necessary to assign the load which can make a failure to the given structure.
Therefore, the load definition should be such a way, which can able to generate the yield stress to the material on given static run.
To identify the load we undergo the Gravity run processes.
Gravity run is an processes were vehicle coordinates are fixed at a region and the gravity masses are increase by 1G, 2G etc.
vehicle this reaction force is taken as the input load to the static analysis.
Where 2G is equals to 2 times gravity load 9810N that is 19620 N. The following Figure-8 shows the 2G gravity run result.
Figure-8. Gravity run result.
As per the output reaction force exerted as 5959N so we can round that value and we can assign load as 5000N to the shock tower Strut region.
Load definition for static analysis
As we obtained load of 5000N as reaction force of gravity run this is considered as a tolerable value of input to static run system.
This 5000N is given as a z direction load to the given shock tower system. The load is given as a point load which acts both z and - z directions to the center of the Rigid Body (RB3) coupler this may distribute reaction as surface load to the surface attached to the RB3 coupler as shown in the Figure-9.
The adjacent parts of shock tower are connected through the Spot welds.
After assign of initial load condition the boundaries are constrained by fixing the boundary edge constraints as shown in Figure-9.
Figure-9. Surface load distribution.
Figure-10. Boundary constraints.
Load definition for fatigue analysis
In Fatigue condition, road conditions are taken as an input loads so we need to fix no of cycles required to precede this test.
As per our assumption we take the road load of car which going to travel 150000miles or approximately equals to 241401Km which can convert to cycle as 450 Cycles.
As 450 cycle of road load equals to car travelling to 24140Km or 150000miles.
As per NCODE solver assumption 150000miles road load of cars requires 450 cycles in fatigue test, so we fixing no of cycles required proceeding in NCODE software is 450 cycles.
Each single cycle consist following road load which described in Table-3.
Table-3. Road load per cycle for fatigue analysis.
Types of load Load per cycle
Put Hole road load 20000times
Gravel road loads 50000times
Smooth faced roads 15000times
Design modification
First iteration design modification
As per the first iteration, the maximum stress exerted up to 254 MPA, which discussed shown Figure-13, but comparing to the yield chart of the material Table-2, 233MPA is yield stress starting point where deformation starts at this point. So the design is considered as a failure model so it is necessary to proceed with an second iteration.
To proceed with second iteration it is necessary to proceed with design modification processes so we decreasing the mouth height of shock tower upto 6mm so it become wider as comparing to base so it distribute the stress equally.
The first iteration of design modification is shown below Figure-11.
Figure-11. First design modification.
Second design modification
As comparing result of second iteration the value exerted is 191MPA shown in Figure-14 which is most near to yield stress of material 233MPA so it is also comparatively unsatisfied result so it’s necessary to proceed with another design modification.
In this this design modification, most stresses exerted areas are captured with stamp and bead futures. As comparing result of iteration 1 and 2 of static analysis shown in Figures 13 and 14 we can identify the stress distribution area and we can proceed further design change.
As per stress-Area relationship, stress is inversely proportional to area so by increasing the surface area where maximum stress is identified these can able to decrease the stress distribution to the part. The following Figure-12 we discuss about the second design modification of the parts.
Figure-12. Second design modification.
RESULT AND DISCUSSIONS
First iteration of static analysis
After defining the load and welds, files are converted to .inp file, which is going to take as an input to solve file in abaqus.
Then. inp file is run through the Abaqus solver as this file comment.
Begin abaqus- i File name
After the completion of the run, solution is extracted in the format of .odbfile, this can be viewed through Postprocessor solver Hyperview as shown in Figure-13.
Figure-13. First iteration result.
Figure-14. First iteration result.
Second iteration of static analysis
After first design modifications as shown in Figure-11, define the load and welds, then files are needed to convert to .inpfile which is going to take as an input to solve file in abaqus.
Then .inp file is run through the Abaqus solver as this file comment.
Begin abaqus- i File name
After the completion of the run solution is extracted in the format of .odb file, this can be viewed through solver of Hyperview as shown in Figure-15 Maximum stress exerts upto 191MPA.
Figure-15. Second iteration result.
Third iteration of static analysis
After second design modifications as shown in Figure-12 define the load and welds, then files are needed to convert to .inp file which is going to take as an input to solve file in abaqus.
Then .inp file is run through the Abaqus solver as this file comment.
Begin abaqus- i File name
After the completion of the run solution is extracted in the format of .odb file, this can be viewed through solver of Hyperview as shown in Figure-16 Maximum stress exerts upto 183MPA
Fatigue analysis results
After assigning of road load condition discussed in Ttable-3, the model is solved in NCODE solver for 450 cycles.
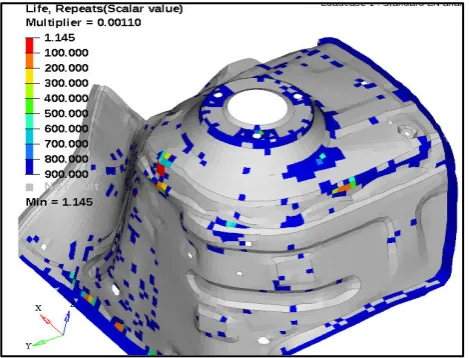
[image:8.595.52.287.186.365.2]Then the life percentage of result is evaluated through the Hyper view viewer as shown in Figures 17 and 18.
Figure-17. Fatigue analysis for base design.
Figure-18. Fatigue analysis for final design.
As comparing with result, base design part elements fail upto percentage value of 1.14%. As comparing with result of final design part elements fail upto percentage value of 15.273%.
Table Comparison of results
Table-4. Comparison of static analysis result.
Iteration of model Stress distribution Mass of the part Surface area Static
iteration 1 254 MPA 2.75kg 175921mm 2
Static
iteration 2 191 MPA 2.729kg
174274 mm2 Static
iteration 3 183MPA 2.731kg
174519 mm2
As comparing the result of static analysis final design which analysed in third iteration has the better stress distribution value of 183MPA so this design evolved from reverse engineering as result exerted than the base model.
Table-5. Comparison of fatigue analysis.
Iteration of the model Life percentage
Base Model Fatigue 1.14%
Final Model Fatigue 15.273
SUMMARY AND CONCLUSIONS
Shock Tower design have been successfully evolved from reverse engineering processes, with better surface and well stress distributed quality as compare to the base design. Final shock tower design has comparatively less in surface area than the base STL model. The final surface area of the model is 174519mm2 is less than base design model, which has surface area of 175921mm2.
Even final design of shock tower masses reduced upto 440grams as compare to the base shock tower mass. Due to this mass reduction, the fatigue life of final design not affected. As compared fatigue result, final model fatigue life fails in 15.34% as it is comparatively high life percentage than the base model fatigue life of 1.14%.
On comparing the result of Static analysis, the final model behaves better yield stress value of 183mpa compare to the base model stress of 254mpa for the given material property.
Through this result we can conclude that shock tower model design evolved from the reverse engineering processes has most better feature attributes than the new design processes or forward engineering process. Moreover, this reduces the complicity facing in creation of new design and product planning processes.
REFERENCES
[1] Cajuhi A., Kaeya J. and Cunha C. 2002. Nonlinear Considerations in Shock Tower Durability Analysis. SAE Technical Paper 2002-01-3483.
[2] Tang A. and Gangal M. 1996. Implementation of CAE in Full Vehicle Development. SAE Technical Paper 962555.
[3] Schifko M., Kornberger B., Fellhofer D. and Steiner, H. 2015. Automatic CAD Data Preparation for CAE. SAE Technical Paper 2015-01-1333.
[image:8.595.52.285.391.558.2][5] Colli N. 2006. Reverse Engineering at Fiat Automóveis do Brasil. SAE Technical Paper 2006-01-2573.
[6] doRego A., Lopes A. and Lazzaretti R. 2006. Reverse Engineering for Powertrain Aftermarket. SAE Technical Paper 2006-01-2684.
[7] Main F. and Kloss D. 1963. Structural Testing as Related to Fatigue in Determining Allowable Static Stresses. SAE Technical Paper 630329.