ISSN: 1992-8645 www.jatit.org E-ISSN: 1817-3195
DESIGN AND CONSTRUCTION OF CONTROL SYSTEM
SEPIC CONVERTER FOR SOLAR PANEL
BASED ON FUZZY LOGIC
1A. H. LOKA, 2T. HARDIANTO, 3B. S. KALOKO
1
Asstt Laboratory of Control System, Faculty of Engineering, University of Jember, Indonesia
2,3
Department of Electrical Engineering, Faculty of Engineering, University of Jember, Indonesia
E-mail: [email protected], [email protected], [email protected]
ABSTRACT
Within renewable energy field, solar panel that principled at photovoltaic effect has been used as alternative energy. MPPT method is using to obtain maximum output power from solar panel if loads are fluctuate. MPPT that implemented use fuzzy logic in function to regulate on/off time of MOSFET in SEPIC
converter by generating PWM signals. The results of testing provide load power at irradiance 1000 W/m2,
800 W/m2, 600 W/m2, and 400 W/m2 when using MPPT is close on power value of MPP better than
direct-coupled method. Average value of power ratio with MPPT based on fuzzy logic is 70.833 % whereas direct-coupled is only 29.312 %.
Keywords: Solar Panel, Fuzzy Logic, MPPT, SEPIC converter, Simulink
1. INTRODUCTION
Energy is the driving component in a variety of human activities, in particular electrical energy that can not be separated from everyday life and is followed by a rising demand. Until now, the conventional electrical energy generation still uses fuel that is limited to that of fossil fuels. However, because of the nature of non-renewable, fossil fuels can not continue to be expected to continue meeting the needs of fuel electrical energy.
From some of the existing renewable energy, sunlight or solar proven to be the right choice in electric energy generation because it can be directly converted into electricity using solar panels. The sunlight has the advantages of guaranteed resources and environmentally friendly. Photovoltaic panels are metal plates that can generate electricity when exposed to light (photons). The greater the intensity of the light incident on the photovoltaic, the greater current will be generated [1]. Photovoltaic (PV) energy has attracted more attention in the last few years as it meets the requirements of being
environmentally compatible and resource
conserving [2].
There are some weakness of electricity generating by solar panel. Because of irradiation and temperature on panel surface, the output becomes not constant. In the other side, coupling
with variety load makes the power which supplied to load is hard to reach its maximum power.
Because of that, need to design a system that can track and optimize the power output of a solar panel. To achieve this, used the Maximum Power Point Tracking (MPPT) method that duty cycle controlled DC-DC converter. Maximum Power Point Tracking (MPPT) is a basic technique used to find the maximum power point of the solar panel for a constant output [3]. Composed of two main parts namely the MPPT system used to determine the point of maximum power and a DC-DC converter manifold SEPIC converter to convert electrical energy generated by solar panels into a voltage level that corresponds to the load. SEPIC converter is controlled by PWM signal with MPPT method until maximum power of solar panel reached. SEPIC converter chosen because it has several advantages such as reducing input current ripple better than the conventional boost converter [4].
2. LITERATUR REVIEW
ISSN: 1992-8645 www.jatit.org E-ISSN: 1817-3195 technology which able becoming alternative
solution from fossil as energy sources. When renewable energy as a sources combine with power electronics and control system, it can create a more efficient and effective system. Renewable energy has some benefit than fossil such as the source is free and dramatically renewable.
2.1 Solar Cell
Solar cell is composed of a very small piece of silicon coated with special chemicals. In general, solar cell has a minimum thickness of 0.3 mm made from slices of semiconductor materials with positive and negative poles. Each solar cells usually produce voltage of 0.5 V. Solar cell is an active element (semi conductor) which utilizes the photovoltaic effect to convert solar energy into electrical energy [5].
Solar panel power ratio is the ratio between output power and load with maximum power nameplate, is calculated by dividing power that generated by solar panel with the maximum power
nameplate. Nameplate maximum power is
maximum power that should come out in certain light intensity conditions. The value of this parameter ranges from 0 % to 100%. The higher the ratio, the better power and efficient performance of the solar panels.
2.2 SEPIC Converter
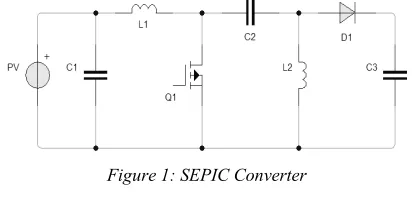
[image:2.612.91.298.545.647.2]Power electronic circuit that is used to convert the DC voltage level to a different DC voltage level called the DC-DC converter. SEPIC (Single-Ended Primary Inductance Converter-) is used as an option if desired combination of buck and boost voltage without the reversal process. Here is a figure of SEPIC converter.
Figure 1: SEPIC Converter
2.3 MPPT
Maximum Power Point Tracking (MPPT) is an electronic system that can be used to control a solar panel system that can operate at maximum power. MPPT is an electronic control which is concentrated at the point of voltage and current characteristics of the points on the solar panel,
indeed not a mechanical system. Whereas a methode without MPPT is popularly called direct-coupled.
There are many factors that affect the performance of solar panel when operating them such as effect of temperature and light intensity. MPPT system allows varying conditions that can be tracked maximum power at a certain time and moment.
2.4 Fuzzy Logic
Fuzzy logic has not a continuous value as boolean logic. Fuzzy expressed in degrees of a membership and degree of truth. Therefore, something can be said to be partly right and partly wrong at the same time [6].
2.5 PWM
In a short explanation, PWM is a technique for generating a pulse signal. In general, PWM signal has the amplitude and frequency of regular basis, but has a pulse width that varies. The pulse width is proportional to the original signal that is not modulated. It can be said that the PWM signal has a fixed frequency but varying duty cycle (between 0% to 100%).
2.6 Simulink Matlab
The programming language Matlab is primarily used in high-level programming language based on the matrix is often used for numerical computation techniques, which are used to solve problems involving mathematical operations element, matrix, optimization, approximation etc. Simulink can be used as a means of modeling, simulating, and analyzing of dynamical systems using graphical user interface (GUI).
3. RESEARCH METHODOLOGY
ISSN: 1992-8645 www.jatit.org E-ISSN: 1817-3195 Table 1: SRM-0100 Specification
Model SRM-0100
Maximum Power (P. Max) 100 Watt Peak
Type Cell Monocrystalline
Voltage at P. Max (Vmp) 19.6 V
Current at P. Max (Imp) 5.1 A
Short Circuit Current (Isc) 5.51 A Open Circuit Voltage (Voc) 24.0 V
Maximum System Voltage 1000 Vdc
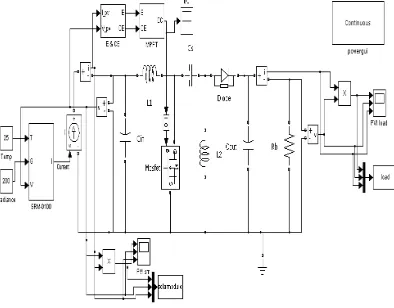
[image:3.612.314.523.265.362.2]In this study, SEPIC converter control using fuzzy logic is simulated using the features in matlab simulink R2009a. In simulink already contained components required to support the MPPT system testing. This system consists of a solar panel, a DC-DC converter circuit manifold SEPIC converter, fuzzy toolbox, and a resistor as load.
Figure 2: Diagram Block
There are many parameters that influence the selection of the size of inductors and capacitors that used in the design. Here are the parameters of this converter.
Vin : 10–20 V
Io : 5 A
fsw : 14 KHz
Duty Cycle : 75.3 % and 60.4 %
L : 89.642 μH
C : 1000 μF
[image:3.612.103.301.293.380.2]Here is a figure of membership function used as input variables of fuzzy logic.
Figure 3: Plot MF Error Variable
Membership function for Change Error variable also has five membership. The plot of membership function for Change Error variable is shown by figure 4.
Figure 4: Plot MF Change Error Variable
As for the output variable called variable duty cycle has the following membership function. This variable has seven membership function separated by different value for duty cycle range.
Figure 5: Plot MF Duty Cycle Variable
[image:3.612.311.525.410.508.2]Then the fuzzy rules that applied is adjusted to table 2 below.
Table 2: Fuzzy Logic Rule
Error Change Error
NB NK N PK PB
NB SK K K SSK SK
NK K M M K K
N SK K M B SB
PK B SB B M K
PB SSB SSB SSB K M
[image:3.612.319.516.545.699.2]Overall, circuit simulation control system SEPIC converter based on fuzzy logic is shown in figure 6.
[image:3.612.90.304.559.664.2]ISSN: 1992-8645 www.jatit.org E-ISSN: 1817-3195
4. RESULTS AND DISCUSSION
Analysis of the parameters consists of load voltage, load current, load power, input voltage, input current, input power, and efficiency. Testing is done when whole system of solar modules using a system based on fuzzy logic and MPPT solar module without using MPPT system or direct-coupled tested. The data will be used as the test data consists of parameters such as irradiance and module temperature in table 3 below.
Table 3: Data of Irradiance and Temp Test Plans No. Irradiance (W/m2)
Modul Temp (° C)
1. 200 25
2. 400 25
3. 600 25
4. 800 25
5. 1000 25
Figure 7 below show influence of module temperature to V-I curve.
Figure 7: Temp Influence to V-I Curve
[image:4.612.91.294.222.488.2]While influence of solar module temperature to V-P curve characteristic is shown by figure 8.
Figure 8: Temp Influence to V-P Curve
While looking at curve characterystic in figure 7, modul temperature influences voltage and current that supplied by solar panel. Isc current at
temperature 25° C is lower than 50° C and 75° C. But, Voc voltage at temp 25° C is higher than the other temperatures. The higher solar modul temperature, the lower Voc voltage, yet the higher Isc current.
Because of solar modul temperature infuences, each temperature has different power point. In figure 8, the highest power is gotten at 25° C and
the lowest is at 75° C. Here is a characteristic curve
[image:4.612.326.511.228.386.2]effect of irradiance on the current and voltage solar module type SRM-0100.
Figure 9: Curve Characteristic of V-I
[image:4.612.320.508.447.600.2]When formed into a curve, the effect of irradiance on the power output of solar modules SRM-0100 as shown in figure 10 below.
Figure 10: Curve Characteristic of V-P
[image:4.612.99.289.524.685.2]ISSN: 1992-8645 www.jatit.org E-ISSN: 1817-3195
Table 4: Maximum Power of Solar Module SRM-0100 Irradiance
(W/m2)
Temp (° C)
Vmpp (V)
Impp (A)
Pmpp (W)
200 25 18.470 0.989 18.267
400 25 19.136 2.025 38.750
600 25 19.441 3.062 59.528
800 25 19.608 4.097 80.334
1000 25 19.691 5.134 101.094
Every rising of irradiance, solar modul power is
also different. Irradiance 200 W/m2 has lower
power than 400 W/m2 at value 18.267 W compared
to 38.750 W. For this irradiance influence, the higher irradiance, the higher power output from solar modul which able to supplied to load.
4.1 Results of SEPIC Converter Testing
Testing of SEPIC Converter is done by getting some values of each components. Duty Cycle and
load that arranged are 50 % and 10 Ω. Diode
voltage converter circuit is in a maximum-value at 0.8 V.
When seconds of the beginning of the simulation begins, the inductor current L1 rises from 0 A to 7.969 A. Then after a while began to stabilize at the current maximum value of 3.339 A and a minimum of 0.530 A. Inductor L1 had voltage at range value 20.011 V until -19.758 V. Current on the inductor L2 is in between the value -3.29 A until -0.489 A, while the voltage of about 19.733 V until -20.036 V.
SEPIC converter said operating in CCM mode if the current through the inductor L1 does not fall on level 0 A. In case of the MOSFET off position, the current on the inductor L1 rises in a positive direction while the current in the inductor L2 on the contrary, rose in the negative direction. When the MOSFET is active, a negative value of L2 will increase the flow L1 inductor current. It aims to increase the current delivered to the load. Figure 12 show current of Inductor L2.
While voltage at Cout as value as voltage at load, voltage at Cin and Cs as value as input voltage from solar module. In this section, the value of the capacitors are 18.9335V, 20.1297V, and 20,12 V. In the other side, MOSFET had 6.665 A for current and 39.8778 for voltage.
[image:5.612.314.520.325.484.2]The test results of SEPIC converter circuit when described to be a curve can be seen in figure 11, which show the influence of the duty cycle of the output voltage to the load of 5 Ω and 10 Ω.
Figure 11: Comparison of SEPIC Converter Output With Duty Cycle
4.2 Solar Module With Direct-coupled Method
Here is a comparison of the power curve that can be supplied by the solar modules compared to the load on different irradiance.
Figure 12: Curve of Comparison Load Power With Load Resistance at Direct-Coupled Method
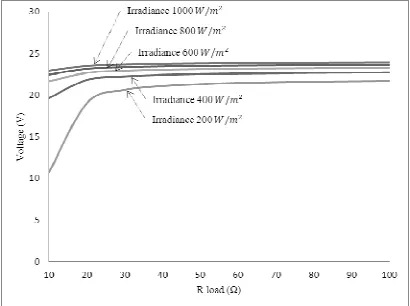
Comparison of load voltage with load resistance, shown by the curve in figure 13.
[image:5.612.315.520.546.699.2]ISSN: 1992-8645 www.jatit.org E-ISSN: 1817-3195 It is seen that the greater the resistance of the load,
the voltage supplied by the solar modules increases. Furthermore, the highest irradiance has the highest load voltage anyway.
Load current at each level of radiation are likely to continue to decline if the imposed loads that have greater resistance. The load current when using direct-coupled method is shown by figure 14.
Figure 14: Curve of Comparison Load Current With Load Resistance at Direct-Coupled Method
Each irradiance have various value of current, voltage and power too. Higher irradiance are having higher value of them. Power, voltage, and
current at irradiance 1000 W/m2 is higher than
irradiance 800 W/m2 when solar modul tested by
direct-coupled method. Load voltage are likely do not show any difference that visible clear. Commonly, the value of voltage and current depend on load resistance.
4.3 Solar Module With MPPT Method
Here is a comparison of the power curve that can be supplied by the solar modules compared to the load on different irradiance.
Figure 15: Curve of Comparison Load Power With Load Resistance at MPPT Method
Voltage more increase if there is an increase load resistance. If the resistance of load is greater, the voltage will be greater and closer to short circuit voltage value corresponding characteristic curve of solar cell in a certain irradiance.
Figure 16: Curve of Comparison Load Voltage With Load Resistance at MPPT Method
Different with the load voltage results got, load current for every raising of resistance is getting down. The value is lower in every irradiance. Flow of getting down if the load resistance is increase. This is in accordance with the characteristic curve of the solar cell due to load resistance coupled to the solar cell, the current generated would be closer to the short-circuit current of a solar cell.
Figure 17: Curve of Comparison Load Current With Load Resistance at MPPT Method
4.4 Comparison Results of Both Method
ISSN: 1992-8645 www.jatit.org E-ISSN: 1817-3195 modules is strongly influenced by the load
resistance.
Based on the test results of the two methods, the ratio of the voltage to the resistance can be seen in this following figure.
Figure 18: Curve of Comparison Load Voltage With Load Resistance at Both Method
Voltage during MPPT control system used tend to rise along with the increase in the value of the load resistance. This is because the control of the SEPIC converter which can regulate the voltage delivered to the load.
At the irradiance of 1000 W/m2, 800 W/m2 and
600 W/m2, MPPT method can produce a higher
current than the method without MPPT. Current flows on methods without MPPT range in value of 0.217 A to 2.245 A, while the methods of MPPT has a total range higher at 0.234 A to 2.992 A.
Figure 19: Curve of Comparison Load Current With Load Resistance at Both Method
Comparison of power results from both methods were tested shown in figure 20 below.
Figure 20: Curve of Comparison Load Power With Load Resistance at Both Method
4.5 Power Ratio
Power ratio is the ratio between the maximum power load power with corresponding nameplate solar modules. Power ratio can be divided into four grades according to irradiance which used for testing. The power ratio of the two methods used are shown in table 5 below.
Table 5: Power Ratio From Both Method
No. Irradiance (W/m2)
MPPT Method Power Ratio
(%)
Direct-coupled Method Power
Ratio(%)
1. 1000 86.519 15.920
2. 800 86.424 19.414
3. 600 84.802 24.996
4. 400 65.362 34.730
5. 200 31.059 51.502
MMPT method have larger power ratio than direct-coupled almost at all irradiance except 200
W/m2. Based on the above power ratio, the average
power ratio for both methods is as follows.
MPPT method : 70.833%
Direct-coupled method : 29.312%
The greater the value of the power ratio is the better. MPPT method can improve the ratio of power rather than using the direct method coupled. That is shown by average power ratio of MPPT method is higher with value 70.833 % compared with 29.312 % on direct-coupled method.
5. CONCLUSION
ISSN: 1992-8645 www.jatit.org E-ISSN: 1817-3195 at the maximum power point of the solar module
especially at irradiance 1000 W/m2, 800 W/m2, and
600 W/m2 better than direct-coupled method. Last
is the average ratio of power when the system is applied MPPT method based on fuzzy logic is 70.833 % whereas when using direct-coupled method has lower power ratio in the number of 29.312 %.
REFRENCES:
[1] B. P. J. Putra, Aulia Siti Aisjah, and Syamsul Arifin, “Rancang Bangun Maximum Power Point Tracking pada Panel Photovoltaic Berbasis Logika Fuzzy di Buoy Weather
Station”, Jurnal Teknik POMITS, Vol. 2, No. 2,
2013, pp. 1-6.
[2] R. E. Gouri, M. B. Brahim, and L. Hlou, "A Comparative Study of MPPT Thecnical Based
on Fuzzy Logic and Perturb Observe
Algorithms for Photovoltaic Systems", Journal
of Theoretical and Applied Information
Technology, Vol. 58, No. 2, December 20,
2013, pp. 336.
[3] D. Bawa, and C. Y. Patil, “Fuzzy Control Based
Solar Tracker using Arduino Uno”,
International Journal of Engineering and
Innovative Technology (IJEIT), Vol.2, 2013, pp.
179-182.
[4] M. R. Banaei, M.R. Shirinabady, and Mehdi Mirzaey, “MPPT Control of Photovoltaic Using SEPIC Converter to Reduce the Input Current
Ripples”, Journal of Engineering Research and
Applications, Vol. 4, No. 2, 2014, pp. 165-166.
[5] N. F. Ginting, "Studi Pengkajian Pembangkit Tenaga Listrik Mikro Dari Sel Surya Di Daerah Yang Tidak Dijangkau Distribusi PLN",
Sumatera Utara University, 2010.