RESEARCH ON OPEN-ARCHITECTURE INTEGRATED
EXPERIMENTAL PLATFORM WITH INTELLIGENT
MONITORING IN SUGAR BOILING PROCESS
1 YANMEI MENG, 2HAIFENG PANG, 3QI HE, 4HAIPING HE, 5XIAOCHUN WANG
1,2,3,4,5 College of Mechanical Engineering, Guangxi University, Nanning 530004, China
E-mail: [email protected], [email protected], [email protected], 4
[email protected], [email protected]
ABSTRACT
The sugar boiling process is the most important element and the crucial link to the sugar production. Considering the existing problems in technology and equipment, this paper studies an open-architecture integrated experimental platform, which provides monitoring in scientific study of sugar boiling process. It has open input/output interfaces and could simulate the real production of sugar boiling process, based on its modular and reconfigurable hardware. The scalable and component-based software could automatically adjust the control parameters such as temperature and pressure, using different algorithms and various control strategies, by a soft sensor method of supersaturation. It provides an optimized monitoring technology to the actual production. A national invention patent has been applied.
Keywords: Sugar Boiling, Open-Architecture, Integrated Experimental Platform
1. INTRODUCTION
The sugar boiling process is the most important element and the crucial link to the sugar production. In order to make exhalation crystal meet requirements, different parameters related to supersaturation, such as temperature, vacuum and feed rate are needed to control [1]-[3]. It is a complicated physical and chemical process with mass transfer and heat transfer. Moreover, the constant change of purity, concentration, and vacuum, cause different crystallization effects [4]-[5].
It contains lots of uncertainties in sugar boiling process because of the complex process, confounding factors, time-varying and nonlinear process. A precise mechanism model of boiling sugar process is difficult to build, due to large inertia, lag behind, and strong coupling [6]-[8]. The accurate key parameters are also hard to obtain through traditional measure methods, such as point measurement or off-line measurement. It needs long time, high cost, and difficult stationing to directly research on sugar boiling tank for production.
Thus, in this paper, an integrated experimental platform designed for research is needed, which could simulate the actual sugar boiling production environment [9]-[10]. The integrated experimental platform provides monitoring in scientific study of
sugar boiling process. Meanwhile, it can be used as a teaching platform for students major in control and sugar to carry out research-based teaching research.
The Section 2 describes overall structure of the integrated platform, Section 3 describes hardware design of the integrated platform, Section 4 presents development of monitoring and control software, and Part of experimental data, Section 5 gives a summary to the whole paper.
2. OVERALL STRUCTURE OF THE
INTEGRATED PLATFORM
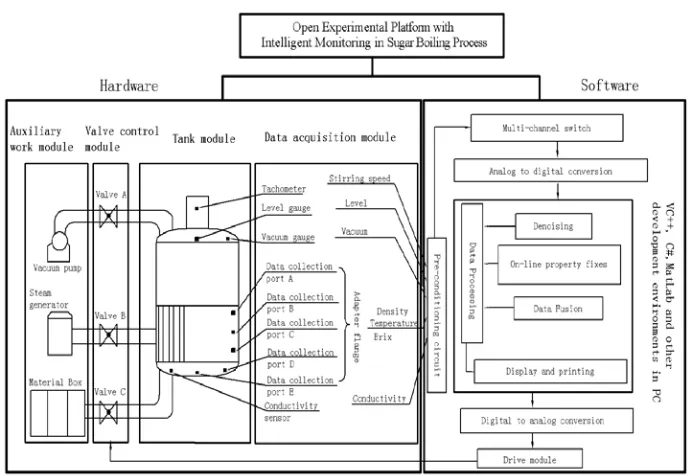
The platform is divided into two parts, hardware and software connected by Modbus and CANbus, as shown in Figure 1. Hardware includes auxiliary work modules, valve control module, tank module, and data acquisition module. Software includes real-time data acquisition component, supersaturation measurement component, and dynamic parameter optimization and control component.
3. HARDWARE DESIGN
3.1 Auxiliary Work Module.
pump, which is mainly used to supply heat and form a vacuum environment.
3.2 Valve Control Module.
Valve A controls vacuum in the tank. At the same time, valve B controls the gas regulator to adjust the temperature of syrup. Valve C controls material feed rate of three types, including water, syrup and seeds.
3.3 Tank MOdule.
[image:2.612.133.478.220.458.2]Tank module consists of a cylindrical tank, a forced circulation stirring institution, and a tubular heat exchanger. A stirring motor tachometer is set on the forced circulation stirring institution, which is connected with real-time data acquisition components via Modbus. The tubular heat exchange gets heat from the steam generator through a pipe, on which there is a valve regulating to control the gas temperature.
Figure 1:Overall Structure Of The Integrated Platform
3.4 Data Acquisition Module.
Data acquisition modules can be divided into three parts: three data collection ports on the side used to capture the syrup mixture density and temperature data on vertical direction; a tank vacuum gauge, a tachometer and a level gauge located in the top; two data collection ports and a conductivity sensor in the bottom is used to capture data on horizontal direction. All these measuring instruments are connected with real-time data acquisition components via Modbus.
3.5 Modular Design.
Date from data acquisition module is converted to digital signal through pre-conditioning circuit, multi-channel switch and A/D conversion. Then it is shown in the host computer and is used for data processing. After that, the processed signal is converted to analog signal through the driver module to adjust the valve control module. All the hardware interfaces are standard flange interface and modular designed. With an adapter flange, it
can connect different instruments such as thermometers, density meter, hammer meter, and conductivity sensor. This platform could compare the distribution of temperature difference, density difference and other important parameters, using the same kinds of measuring instruments located in different places; on the contrary, it also could show the impact of different parameters in the same process, using different measuring instruments.
4. DEVELOPMENT OF MONITORING AND
CONTROL SOFTWARE
computer could be connected to a remote monitoring computer in network through OPC interface to improve administrator’s work efficiency.
4.2 Supersaturation Measurement Component. Supersaturation measurement is divided into principal component of extraction module, offline modules, online modules, interface management module, data sharing unit module and the external interface module, as shown in Fig.3.
Development environment
(VC++,
C#,MatLab,etc)
Acquisition module
Protocol conversion module
Control module D a ta a c q u is it io n in te r fa c e C o n d u c ti v it y s e n si n g C o n d u c ti v it y L iq u id l e v e l U lt r a so n ic l e v e l se n so r V a c u u m p r e ss u r e se n so r V a c u u m D e n si ty T e m p e r a tu r e V a lv e V a lv e o p e n in g S te a m g e n e r a to r S ti r i n st it u ti o n s P r e ss u r e M o to r s p e e d D a ta a c q u is it io n in te r fa c e M o to r s p e e d V a c u u m v a lv e S ti r i n st it u ti o n s S te a m g e n e r a to r V a lv e O p e n in g V a c u u m P r e ss u r e a n d te m p e r a tu r e Modbus bus CAN bus
Measurement object Controlled object
[image:3.612.187.425.184.430.2]CAN interfaces OPC interfaces drivers OPC interfaces Remote monitoring computer Remote client Net PC
Figure 2: Monitoring and Control System
External interface module receives data from real-time data acquisition component and stores it in data sharing unit module. Principal component of extraction module analyses this data, using partial least squares method to extract the principal component and eliminate the non-linear and
noise-related between auxiliary variables, in order to improve the accuracy of soft-sensor. Off-line module selects appropriate kernel function parameters and the penalty factor parameters to construct off-line model.
Soft Sensor Components of Supersaturation
O f f -l i n e p a r a m e t e r o p t i m i z a t i o n O f f -l i n e t r a i n i n g O f f -l i n e m o d e l i n g O f f -l i n e s o f t s e n s o r Offline module P a r a m e t e r s o n -l i n e o p t i m i z a t i o n O n l i n e T r a i n i n g O n -l i n e m o d e l i n g O n l i n e s o f t S e n s o r
Online Module Interface
management module Data sharing unit module Yes No Text Information Display Dynamic Image Display
Output management module Parameter management module
Off-line parameter optimization parameters Data sharing unit settings Online measurement settings Principal components of data
extraction module On-line parameter optimization parameters External interface module Data normalization parameters settings
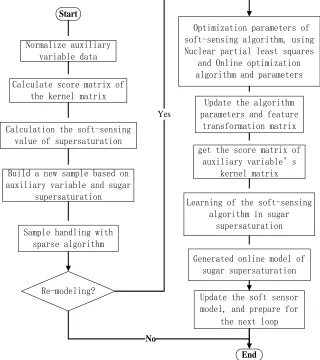
[image:3.612.128.492.546.711.2]The flowchart of supersaturation soft-sensing algorithm is shown in Fig. 4. According to the data of syrup conductivity, syrup density, syrup temperature, vacuum, vapor pressure and bowl level, soft measurement is calculated based on kernel partial least squares method. Online modeling is based on offline modeling, and it’s not a fixed model, but a changing model with online
learning and updating, on condition that whether exists linear correlation between auxiliary variables and sample dictionary in the high-dimensional feature space after normalization. If no, keep going; if yes, do local fine-tuning, and update feature transformation matrix to accurately extract the auxiliary variables in the next time.
Learning of the soft-sensing algorithm in sugar
supersaturation
Generated online model of sugar supersaturation
Update the soft sensor model, and prepare for
the next loop
End Start
Yes
Sample handling with sparse algorithm
Re-modeling?
Calculate score matrix of the kernel matrix
No
Normalize auxiliary variable data
Calculation the soft-sensing value of supersaturation
Optimization parameters of soft-sensing algorithm, using Nuclear partial least squares
and Online optimization algorithm and parameters
Update the algorithm parameters and feature
transformation matrix
get the score matrix of auxiliary variable’s
kernel matrix Build a new sample based on
[image:4.612.146.466.231.591.2]auxiliary variable and sugar supersaturation
Figure 4: Flowchart of Supersaturation Soft-Sensing Algorithm
4.3 Dynamic parameter Optimization and Control component.
As shown in Fig. 5, check if the parameters which expressed by nonlinear equations are in fault-tolerant feasible region and meet constraints of physical laws. And then do decomposition of variables and lower-dimensional optimization, select the best one with optima Robustness. After
that, output optimal control parameters to output module. Meanwhile, update the initial model.
Predictive value of supersaturation
Other state parameters
Initial model of the control system
Nonlinear equations Constraints of
physical laws Fault-tolerant control
feasible region
Algorithm convergence
Operational feasibility Update Model
Decomposition variables
Lower-dimensional optimization
Robust optimal screening Denoising
[image:5.612.98.517.66.333.2]Output optimal control parameters
Figure 5: Dynamic Parameter Optimization and Control
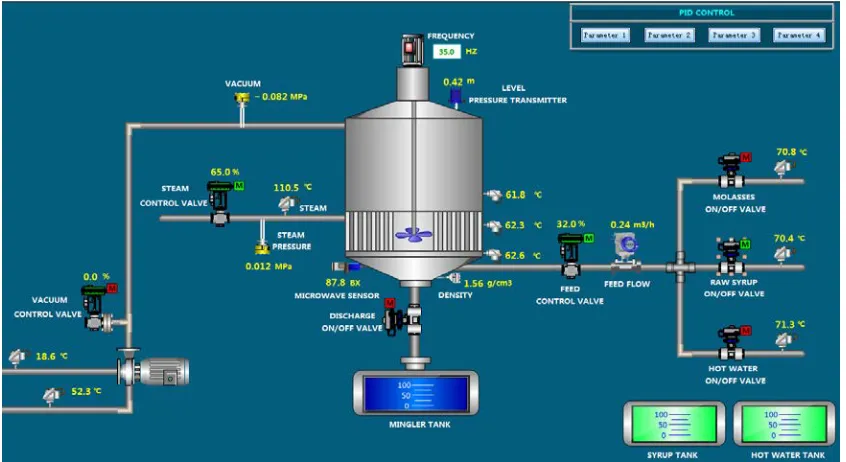
4.4 System Operating Interface.
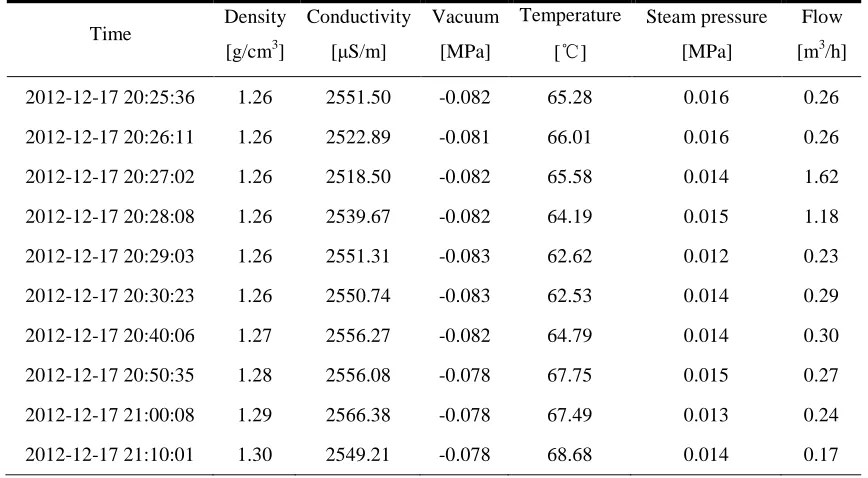
As shown in Fig.6, the monitoring software of the host computer can vividly show the experimental platform online running state through the colorful pictures. Click on the monitoring interface related button, it can set the corresponding control parameters, and realize real time or remote on-line monitoring in the sugar boiling real-time dynamic process. Table 1 shows a part of experimental data of the experimental platform.
5. SUMMARY
This paper studies an open-architecture integrated experimental platform, which provides monitoring in scientific study of sugar boiling process. Meanwhile, it can be used as a teaching platform for students major in control and sugar to carry out research-based teaching research.
[image:5.612.96.519.487.718.2]Table 1: Part of Experimental Data of the Experimental Platform
Time Density
[g/cm3]
Conductivity
[μS/m]
Vacuum
[MPa]
Temperature
[℃]
Steam pressure
[MPa]
Flow
[m3/h]
2012-12-17 20:25:36 1.26 2551.50 -0.082 65.28 0.016 0.26
2012-12-17 20:26:11 1.26 2522.89 -0.081 66.01 0.016 0.26
2012-12-17 20:27:02 1.26 2518.50 -0.082 65.58 0.014 1.62
2012-12-17 20:28:08 1.26 2539.67 -0.082 64.19 0.015 1.18
2012-12-17 20:29:03 1.26 2551.31 -0.083 62.62 0.012 0.23
2012-12-17 20:30:23 1.26 2550.74 -0.083 62.53 0.014 0.29
2012-12-17 20:40:06 1.27 2556.27 -0.082 64.79 0.014 0.30
2012-12-17 20:50:35 1.28 2556.08 -0.078 67.75 0.015 0.27
2012-12-17 21:00:08 1.29 2566.38 -0.078 67.49 0.013 0.24
2012-12-17 21:10:01 1.30 2549.21 -0.078 68.68 0.014 0.17
ACKNOWLEDGEMENT
Research supported by the National Natural Science foundation Project (number: 51065004) and the Guangxi Natural Science Foundation of China (number: 2011GXNSFA018168).
REFERENCES:
[1] Y.M. Meng, J.J. Su, Y. Luo, B.Q. Huang and C.S. Zhang, “Research on Parameter Automatism Measuring System in Refining Sugar Process”, Machinery & Electronics, Vol. 12, 2008, pp. 28-30.
[2] L.H. Huang, Y.M. Meng, and G.M. Li, “Design of Radio Frequency On-line Sensor for Measuring Syrup Concentration”, Process
Automation Instrumentation, Vol. 10,
2009,pp.66-68.
[3] Y.Z. Chen, W.M. Ni, and X.F. Ren, “Research and Development of the Artificial Intelligence on the Sugar Boiling Automatic Control”,
Industrial Measurement, Vol. 6, 2003.
[4] J.J. Yang, X.Y. He, and C.H. Xu, “Hybrid Modeling of a Sugar Boling Process”, Techniques of Automation and Applications, Vol. 6, 2003.
[5] H. Nong, “The Applications of Automatic Sugar-Boiling Controlling System”, Enterprise
Science and Technology & Development, Vol.
20, 2010.
[6] J.J. Yang, C.H. Xu, and H.L. Yi, “Dynamic Matrix Control of Cane Sugar Crystallization Process”, Computer Measurement & Control, Vol. 1, 2006.
[7] S.Q. Hu, and P.W. Xu, “The Application of Microcomputer Fuzzy Control in the Process of Boiling Sugar”, Control & Automation, Vol. 1, 1997.
[8] Z.H. Tang, S.J. Yan, Y.M. Meng, and B.Q. Huang, “Design and Realization of Database for Sugar Boiling Parameter Based on Labview and LabSQL”, Machinery & Electronics, Vol. 6, 2008.
[9] J.J. Liu, and J.W. Jiao, “The Application of Forced Circulation and Automatic Boiling Sugar Device”, China Beet & Sugar, Vol. 3, 2008.
[10] V. VS, S. RWH, P. CC, “Solution of a class of multistage dynamic optimization problems. 1. Problems without path constraints”, Ind Eng
Chem Res, Vol. 33, 1994, pp.2111-2122.