POVERTY, POPULATION,
DEVELOPMENT IN HISTORICAL
PERSPECTIVE
Chilosi, Alberto
Department of Economics, University of Pisa
8 February 2008
Online at
https://mpra.ub.uni-muenchen.de/9542/
A
LBERTOC
HILOSIDipartimento di Scienze economiche,
sede di Scienze Politiche - via Serafini, 3 - 56126 PISA (ITALY) E-Mail: [email protected]
The rich nation is the novelty, and the development that makes entire nations rich is itself the pivotal development of modern history
(Asa Briggs, British historian, 1963)
ABSTRACT
The object of the paper is to place the present issues of world poverty, development, demographic change into proper historical perspective, considering the specificities of present times concerning economic and demographic developments, as well as the international relations associated with them. Some speculations concerning possible long run developments conclude the paper.
INTRODUCTION
globally thanks to the atomic bomb. Gradually the bomb has been spreading from the superpowers to regional actors. The almost inevitable spreading of the atomic bomb makes localized conflicts less probable, but also increases the probability of an atomic conflict eventually erupting, with disastrous consequences both on economic progress and on demography.
In the post-war period a broad consensus, perhaps unique in history, prevailed in the international community that wars of conquest were unlawful and that borders should not be changed by violent means.The main challenge to the ensuing setup, analogously to the European setup arising from the Congress of Vienna, have been ethnically motivated liberation and independence wars, including those originating from the breakdown of multiethnic entities, such as notably those following the dissolution of former Yugoslavia.
POVERTY
Historically world population has been increasing at a very slow pace, amounting to near stagnation, held in check by high mortality rates, especially of child mortality. Per capita incomes have been mostly at what we would regard utter poverty levels, and whenever have increased they have done so at a very slow pace, amounting to some small fraction of one percent yearly. Following the industrial revolution things have started radically to change. But never have world population and world income increased so tumultuously as after the Second World War; indeed, the explosion both in wealth and population in the post-war period has been an historical unicum. Scientifically speaking, taking into consideration the history of mankind, the anomaly to be explained is not backwardness and poverty, but development and wealth.
As we shall better see in what follows the brakes to population growth that in the previous epochs constrained the growth of world population, and which started to slacken with the Industrial Revolution have apparently been swept away by the progressive lengthening in life expectancy leading to unprecedented demographic growth, which has been accompanied by unprecedented economic growth.
Still, a large part of humanity lives in appalling poverty conditions. Indeed,
There has never been such a high number of poor people in the world
If conventionally (very conventionally, indeed) we define, following the World Bank, as (absolute)1 poverty a daily consumption of less that two dollars,2 in 2001 their number was estimated as 2.7 billion,3 more than the
1
Relative poverty depends on distribution. Then there is subjective poverty that depends on habits and aspirations. We shall be
concerned only cursory with these issues.
2
Or rather 2.15 dollars a day at 1993 purchasing power (somewhat less than 800 dollars a year), while 1.08 dollars of 1993
purchasing power a day (somewhat less than 400 dollars a year), according to World Bank definition, characterize extreme
poverty. In the text we use the colloquially usual distinction of 1 and 2 dollars a day. (For the definition of the international
poverty line see World Bank (2005), table 2.5, “Poverty”, http://devdata.worldbank.org/wdi2005/Table2_5.htm#definition.)
3
Source: Word Bank (2005), table 2.5 “Poverty”, at http://devdata.worldbank.org/wdi2005/Table2_5.htm. It should be noted that
there has been actually a decrease (estimated to about 400 million) in the number of the extreme poor (less than 1$ a day) during
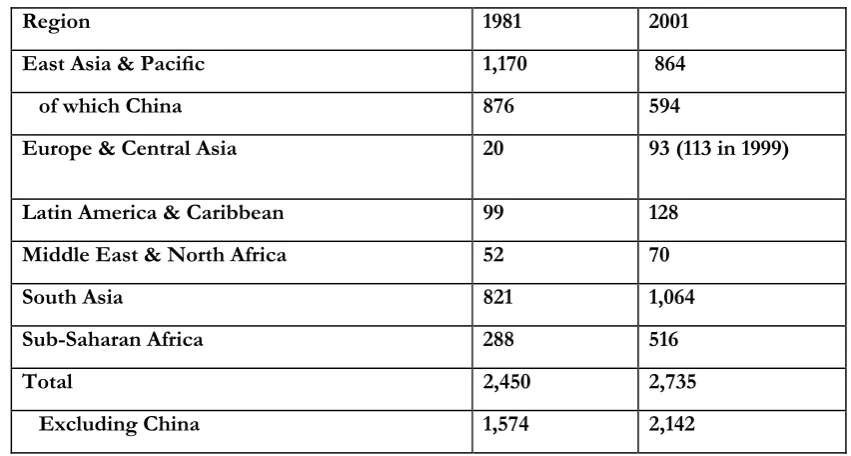
entire world population in 1950.4 The number of extreme poor consuming less than one dollar a day in 2001 is reported to have been close to 1.1 billion, about the same as the entire world population in 1820 (which may be conventionally taken as the year of the coming of age of the Industrial Revolution in the UK and of its spreading outside the UK); the number of the extreme poor in previous years is estimated to have been even higher, about 1.6 billion around 1980 (before the recent tumultuous growth of the economy of China). Most of them are concentrated in third world countries, but a few millions are living in (and a number of them leaving from) Eastern Europe and Central Asia (the so called transition countries).5 See the data in the following tables:6
Table 17
Number of people living with less than 2$ a day
Region 1981 2001
East Asia & Pacific 1,170 864
of which China 876 594
Europe & Central Asia 20 93 (113 in 1999)
Latin America & Caribbean 99 128
Middle East & North Africa 52 70
South Asia 821 1,064
Sub-Saharan Africa 288 516
Total 2,450 2,735
Excluding China 1,574 2,142
world poverty estimates and some updating, see Chen and Ravaillon (2004) and (2007) and Ravaillon, Chen and Sangraula (2007).
Taking into account the overall number of the world poor, one can appreciate the enormous migration potential into the more
prosperous (or even the less poor; for the extent of South-South migrations see for instance Hujo and Piper, 2007) countries in a
shrinking world, with potential far-reaching social and political consequences (for more on this point see Chilosi, 2002). Countries
of emigration to richer countries can at the same time become countries of immigration from poorer ones, such as notably in the
case of Eastern Europe as a whole.
4 See Table 1.
5 The above date refer to Europe and Central Asia, but the poor in the area are essentially concentrated in the transition countries
of Eastern Europe (including south-eastern Europe) and former Soviet Union.
6
The figures are expressed in millions, the data are extracted from World Bank, 2005, table 2.5.
7
Table 28
Number of people living with less than 1$ a day
Region 1981 2001
East Asia & Pacific 796 271
China 634 212
Europe & Central Asia 3 17(30 in 1999) Latin America & Caribbean 36 50
Middle East & North Africa 9 7
South Asia 475 431
Sub-Saharan Africa 164 313
Total 1,482 1,089
Excluding China 848 877
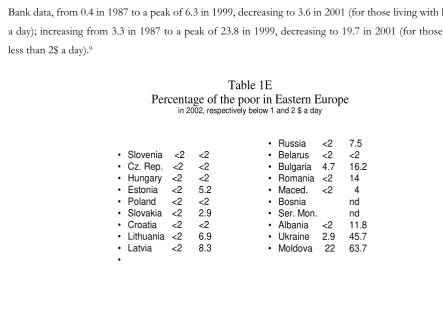
It is notable that the number of the poor in transition countries as a whole has reached a peak in 1999, just a visible sign of the hardships engendered by the transition process during the nineties, but since then has started to decrease. The same applies to the percentage of the poor in the population, increasing, according to World Bank data, from 0.4 in 1987 to a peak of 6.3 in 1999, decreasing to 3.6 in 2001 (for those living with less than 1$ a day); increasing from 3.3 in 1987 to a peak of 23.8 in 1999, decreasing to 19.7 in 2001 (for those living with less than 2$ a day).9
• Slovenia <2 <2 • Cz. Rep. <2 <2 • Hungary <2 <2 • Estonia <2 5.2 • Poland <2 <2 • Slovakia <2 2.9 • Croatia <2 <2 • Lithuania <2 6.9 • Latvia <2 8.3 •
• Russia <2 7.5 • Belarus <2 <2 • Bulgaria 4.7 16.2 • Romania <2 14 • Maced. <2 4 • Bosnia nd • Ser. Mon. nd • Albania <2 11.8 • Ukraine 2.9 45.7 • Moldova 22 63.7
Table 1E
Percentage of the poor in Eastern Europe
in 2002, respectively below 1 and 2 $ a day
8
Source: ibidem. 9
[image:5.595.47.491.395.705.2]The world poor as a percentage
On the whole the share of the poor in the human population has never been so low.10
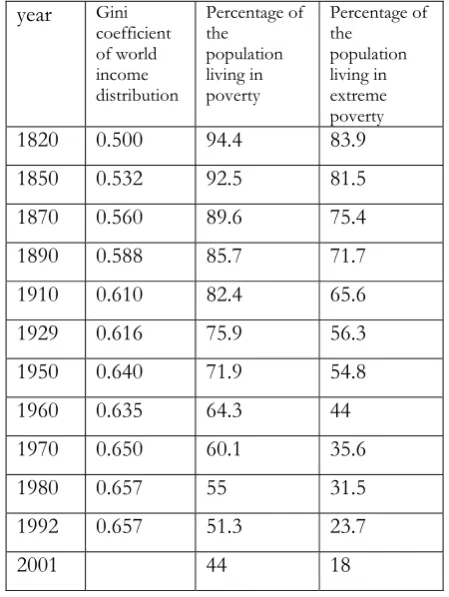
According to the historical estimates reported in Bourguignon and Morrison (2002, pp. 731-732), and taking into account the number of conventional poor people in 2001, estimated by the World Bank, as well as the estimate of the size of world population in 2001, reported in table 3, the share of world population living in poverty diminishes from 94,4% in 1820 to 44% in 2001, that of those living in extreme poverty from 83,9 in 1820 down to 18% in 2001. In the end, taking into account the fact that in the period the share of the poor has been greatly reduced the fundamental explanation (at least from a statistical viewpoint) of why there are so many poor people in the world is that there are so many people around. Human population has increased steadily and dramatically in the last two centuries, and in particular in the last few decades. Some relevant data are reported in table 3.
10 Of course this depends crucially on the definition of poor. Here we use the World Bank definition, whereby the poor are defined
in terms of absolute purchasing power. This may not well correspond to a subjective, socially and environmentally conditioned,
definition of poverty, in the sense of deprivation (see on this point in particular Kenny, 2006). This is perfectly true, but without a
common measure one could hardly make intertemporal comparisons. Of course, in making the latter one should ideally go into
detail as to the specific relevant circumstances of the various cases. Here it is enough to note that the trends in average incomes are
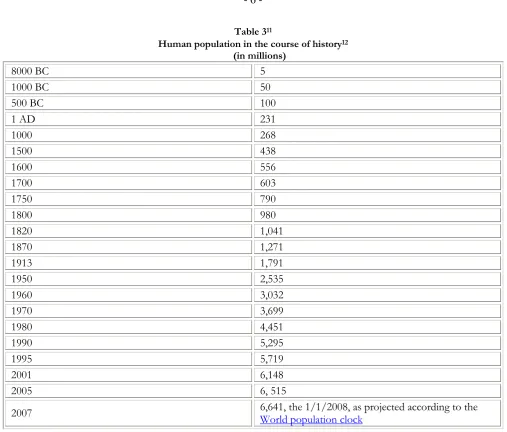
Table 311
Human population in the course of history12
(in millions)
8000 BC 5
1000 BC 50
500 BC 100
1 AD 231
1000 268
1500 438 1600 556 1700 603
1750 790
1800 980 1820 1,041 1870 1,271 1913 1,791 1950 2,535 1960 3,032 1970 3,699 1980 4,451 1990 5,295 1995 5,719 2001 6,148
2005 6, 515
2007 6,641, the 1/1/2008, as projected according to the World population clock
To grasp the extent of the dramatic acceleration of population growth in recent times one may notice that the increase in population in the ten years between 1995 and 2005 (796 million) is more or less the same as that in
11
The sources of the data are as follows: 8000 BC, Haub, 1995, p. 5, quoted in US Census Bureau (2007); 1000 and 500 BC,
McEvedy and Jones, 1978, pp. 342-351, quoted in US Census Bureau (2007); 1-1700 and 1820-1913, Maddison (2006), p. 636;
1750 and 1800, United Nations, 1999; 1950-2005, United Nations, 2006, with the exception of 2001, taken from US Census
Bureau 2007b. The data from 1800 in Europe and from 1900 in the other continents are regarded, by and large, to have a fair
degree of reliability. The data concerning the previous years are just estimates or even more or less wild guesses. They should be
considered to give an order of magnitude, rather than provide reliable data with any degree of precision (on this see Caldwell and
Schindlmayr, 2002). Indeed, this applies even more to the estimates concerning national income in the tables that follow.
12
Looking at the first lines of the table, comparing them with the last ones, one is forced to come to terms with the fact that the
momentous historical events of our distant past, recollected and magnified in history books, would have involved such
the 10,000 years or so from the start of the agricultural revolution to the dawn of the industrial revolution (for which we may take conventionally the year 1750).
If we concentrate our attention to Eastern Europe and former Soviet Union in the periodization of table 5 below, we can see that the highest rate of population growth in history has taken place in the years 1950-73, slightly less but still remarkable was the rate of growth of population in 1870-1913, while the low rates in the period 1914-1950 were certainly due to the impact of two world wars and their aftermath. The negative rate of growth in the latest period is in both cases a consequence of the social and economic disruptions following the fall of the communist regimes.
AN UNEQUAL WORLD
While a high proportion of world population still lives in poverty, world income and wealth are very unequally distributed. A recent research by Wider, the ONU economic research centre on poverty and development13 (Davis et alii, 2006a), shows the extent of world inequality in the distribution of personal wealth: 14
13
World Institute for Development Economics Research: http://www.wider.unu.edu.
14
Where personal wealth is defined as “the value of physical and financial assets less liabilities” (Davies et alii, 2006a, p. 1).The
data refer to the year 2000. Methodology: “average wealth level: based on household balance sheets and wealth survey data for 38
countries (56% of the world population and 80% of wealth) extended by regression methods to most other countries
region-income class averages imputed to remaining countries…distribution of wealth: based on distribution data for 20 countries wealth
concentration estimated from income distribution for most other countries region-income class averages imputed to remaining
countries” (Davies et alii, 2006b). The data considered refer to the year 2000, and are either measured in dollars terms at the
current exchange rates or in Purchasing Power Parity dollars (PPP$; this means that all values are converted in dollars using
exchange rates such that the purchasing power of the dollar will be more or less the same once transformed in the various world
currencies). It must be noted that passing from current dollars to PPP$ reduces somewhat world inequality, since the dollar
purchasing power is usually higher in poorer countries, but it does not alter substantially the global picture. It should be noted that
an inquiry such as the one referred to above is based on limited data and fraught with methodological difficulties; therefore one
should stress that, as is always the case with statistics, but much more in the present instance, data should be considered to give the
order of magnitude rather than be taken at face value. For a detailed explanation of the methods used in the inquiry one may refer
World average personal wealth= $ 21,000 (PPP$26,000)15 $144,000 in the USA16
$181,000 (PPP$ 125,000) in Japan $1,400 (PPP$ 8000) in Indonesia
$1,100 (PPP$ 6500) in India $98,000 (PPS$ 120,000) in Italy17
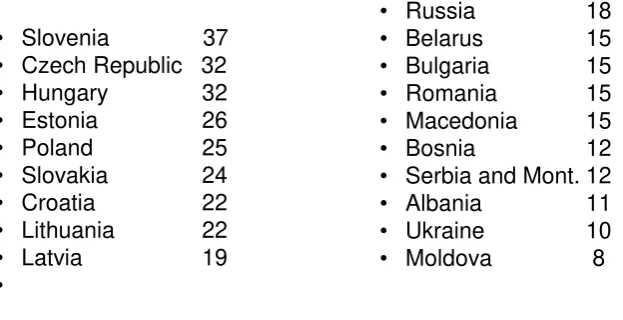
[image:9.595.131.443.335.495.2]East European countries find themselves, as expected, at intermediate values
Table 2E
Personal Wealth in Eastern European Countries
(thousands of PPP$)On average more or less the world average
The average value of personal wealth is about 4 times that of the poorer 64 countries and about one sixth of the per capita personal wealth of the 24 richer OECD countries
• Slovenia 37 • Czech Republic 32 • Hungary 32 • Estonia 26 • Poland 25 • Slovakia 24 • Croatia 22 • Lithuania 22 • Latvia 19 •
• Russia 18 • Belarus 15 • Bulgaria 15 • Romania 15 • Macedonia 15 • Bosnia 12 • Serbia and Mont. 12 • Albania 11 • Ukraine 10 • Moldova 8
The 24 richer OECD countries own 83% of world private wealth (64% at PPP$) with only 15% of world population, with a per capita wealth of $116,000 (114,000 at PPP$). The 64 poorest countries with 40% of world population own 2% of world personal wealth (8% at PPP$), with a per capita wealth of 1000$ (5000 at PPP$)18
15 Davies et alii, 2006a, Table 8.
16 Davies et alii, 2006a, Table 1, Appendix V. For the USA the PPP$ and $ values are obviously the same (no exchange rate is
involved).
17
Ibidem.
18
The Poor, the Rich, and the Superrich
It has been estimated that the 1% the of richest adults owned the 40% of overall private wealth in 2000 (32% in PPP$ terms)19; the richest 10%, the 85%; the poorest 50%, the 1% (4% in PPP$ terms).20
The Gini index of inequality of overall world wealth distribution (calculated using current exchange rates) is given as 89 (80 in PPP$ terms)21, the same as that of a group of 10, where 1 has 1000€ and 9 1€ each. 22
Income is distributed less unequally than wealth, but still in a markedly unequal way. According to most estimates reported in Milanovic (2006, p. 8) the Gini coefficient of world income distribution is around 65% in the contemporary world.23 To make a comparison, the Gini index of the distribution of family incomes of Italy is reported as 36, that of the USA 45, that of Sweden 25. The state where the Gini index appears to be highest, among those reported in CIA Worlfactbook is Namibia with 71, but probably only because in other, even more unequal, third world countries no statistical data allowing its calculationare available. 2425
19
“37% reside in the US, 27% in Japan” (Davies et alii, 2006b).
20
Davies et alii, 2006a, Table 10, and Table 11a.
21
Ibidem, Table 12. If the exchange rates are calculated according to Purchasing Power Parity the inequality is somewhat lower
since the purchasing power in the poorer countries is revalued, but the overall picture does not change.
22 Davies et alii, 2006b, p. 9.
23 The paper by Milanovic contains an interesting critical review of the different methodological approaches used to get those
values. From the historical viewpoint it is believed that in the past income differences inside nations were relatively more relevant
than nowadays in the determination of the global result. In the pre-industrial world more than half of global income inequality
could have been due to inequality in income distribution inside nations, while today the prevailing component, about 70%, is
deemed to be due to differences in average per-capita incomes between nations (Milanovic, 2006, p. 9). According to the data
reported in Bourguignon and Morrison (2002, p. 731) there has been an increase through time in the world Gini coefficient, from
0,50 in 1820 up to the present values (see table 4). On the other hand values for so far away periods seem to be rather speculative
estimates, even more daring than the speculative estimates needed to arrive at an aggregate measure for the contemporary world as
a whole.
24
Such as in particular Equatorial Guinea which, according to CIA (2007), has the “fourth highest per capita income in the world”
but where the great bulk of the population allegedly lives in desperate conditions with less than a dollar a day (cf. “Playboy waits
for his African throne “, Sunday Times, 3/9/2006, available at: http://www.timesonline.co.uk/tol/news/world/article626511.ece).
25
Table 4
Poverty and income distribution in recent world history26
year Gini coefficient of world income distribution
Percentage of the
population living in poverty
Percentage of the
population living in extreme poverty
1820 0.500 94.4 83.9 1850 0.532 92.5 81.5 1870 0.560 89.6 75.4 1890 0.588 85.7 71.7 1910 0.610 82.4 65.6 1929 0.616 75.9 56.3 1950 0.640 71.9 54.8 1960 0.635 64.3 44 1970 0.650 60.1 35.6
1980 0.657 55 31.5
1992 0.657 51.3 23.7
2001 44 18
What is the source of the present high inequalities
According to the previous table, while inequality, as measured by the Gini coefficient, has steadily increased since 1820, the proportion of paupers in the world has steadily decreased. Thus, seen in an historical context, present inequality appears not to depend on the paupers of the world being worse off, since an increasing proportion of the worse off are lifted from their state of absolute poverty, but on the fact that on the whole the lot of humans has dramatically, albeit unequally, improved (and this has contributed to enormously multiply their numbers). The rate of growth of world population has never been so high as after WWII (see Table 5). Among the regions of the world the highest growth rate has been that of Africa, the poorest region. This, together with the composite ethnic structure of the artificial political divisions left over from colonial times, replicated in the post-colonial state boundaries, and the low educational attainments, contributes to explain the tensions and bloody conflicts that engulf that unfortunate continent. As to the concretely implementable measures for bringing about a more equal distribution, which would not affect the unique engine of growth and welfare that has been running in the last sixty years of world history, there is no much clarity of thought. As
26
Data taken from Bourguignon and Morrison, p.731; the data of the last row are calculated from population data in table 3 and
usual is the case what appears at first sight is not what really is, if one looks rationally at the implications. For instance the various proposals for limiting the extent of the liberalization of the world market, such as advocated by the various anti-WTO movements, would probably hamper one of the main sources of growth and economic improvement of the enterprising poor, and an engine leading to increasing worldwide equality rather than inequality. As to transfers, it is hardly possible that transfers of the size to really bring about a significant reduction of world inequality in per capita income and wealth could be acceptable to the public opinions of better off countries. In general, the propensity to aid the poor people of the world is quite widespread, but with somebody else’s money.27 Moreover there is the issue of the lasting effects of the culture of dependency, and the old maxim that international aid amounts taking away from the poor of the giving countries in order to give to the rich of the receiving countries, which, in its apparent paradox, may capture a relevant aspect of international aid. As to changing the basis of the international economic order from free exchange and market to planned allocation and material barters, even aside the concrete issue of its (in)feasibility, the Comecon experience of planned material exchanges is not really enticing. To some extent distribution is internationally as well as inside nations a consequence of the institutions that regulate and affect production and exchange. The institutions that may favour high levels of productivity and growth have some distributional consequences that only partially can be mitigated without affecting economic outcomes.
27
Such as in the movement for international debt remission, where the proponents do not appreciate that the only radical way to
suppress debt is to suppress credit, while insolvency makes international debt more risky, and therefore more onerous, and this not
necessarily is in the interest of poorer countries. None of the vocal members of the debt remission campaign seems to have started
an international voluntary subscription for paying off poorer countries’ debt by reimbursing the creditors, thus presumably
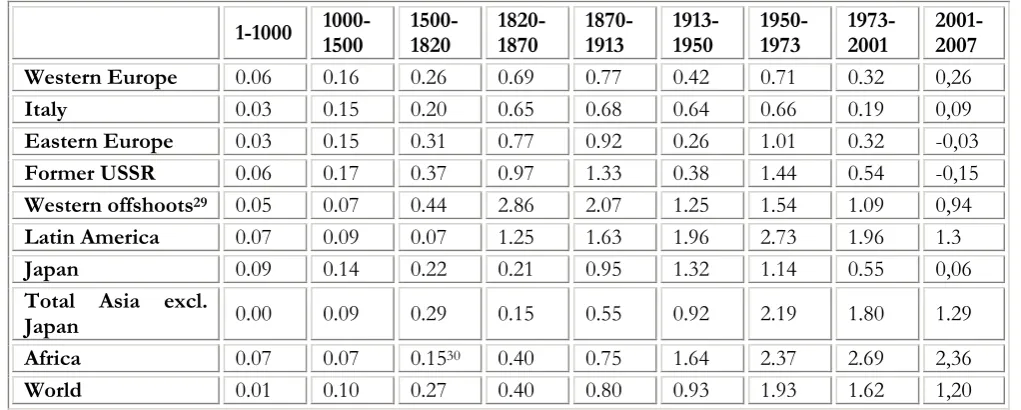
Table 5
Yearly average rates of population growth 1-200728 (in percentages)
1-1000
1000-1500 1500-1820 1820-1870 1870-1913 1913-1950 1950-1973 1973-2001 2001-2007
Western Europe 0.06 0.16 0.26 0.69 0.77 0.42 0.71 0.32 0,26
Italy 0.03 0.15 0.20 0.65 0.68 0.64 0.66 0.19 0,09
Eastern Europe 0.03 0.15 0.31 0.77 0.92 0.26 1.01 0.32 -0,03
Former USSR 0.06 0.17 0.37 0.97 1.33 0.38 1.44 0.54 -0,15
Western offshoots29 0.05 0.07 0.44 2.86 2.07 1.25 1.54 1.09 0,94
Latin America 0.07 0.09 0.07 1.25 1.63 1.96 2.73 1.96 1.3
Japan 0.09 0.14 0.22 0.21 0.95 1.32 1.14 0.55 0,06
Total Asia excl.
Japan 0.00 0.09 0.29 0.15 0.55 0.92 2.19 1.80 1.29
Africa 0.07 0.07 0.1530 0.40 0.75 1.64 2.37 2.69 2,36
World 0.01 0.10 0.27 0.40 0.80 0.93 1.93 1.62 1,20
The population explosion
In a secular (or rather millennial) perspective, before the Industrial Revolution population growth was held in check by high mortality rates, accompanied by high birth rates.31 Still, following the improvement of agricultural
28
Source of the data of the last column: U.S. Census Bureau, International Data Base, at
http://www.census.gov/cgi-bin/ipc/agggen; the remaining data are taken from Maddison (2006), p. 637.
29
USA, Canada, New Zealand, Australia.
30
One may puzzled by the acceleration of the demographic development of Africa in a period of massive slave transatlantic trade.
The answer seems to lie in the fact that “although some areas of Africa were depleted by slave raiding, on balance the African
population grew after the establishment of the transatlantic slave trade because of new food crops introduced from the New World,
particularly manioc, corn (maize), and possibly peanuts” (Hellie, 2007).
31
The source of high mortality rates in a classical Malthusian perspective could have been the limitation in the amount of available
agricultural resources, either continuously, leading to poor nutrition (and therefore to higher morbidity and premature deaths), or
episodically, through famines. But there were also other forces at play. First of all very high rates of child mortality, either through
systematic infanticide (itself probably a function of available resources), especially of females, or as a consequences of neglect and
of poor living, childbearing and childrearing conditions. Second, possible neglect of the elders, the disabled and the infirm. Third
the spread of epidemic diseases (which was favoured by overcrowding and poor living conditions in the cities of agricultural
societies). Then, endemic warfare, between tribes, nations or individuals, leading to direct deaths, as well as to misdirection and
destruction of the resources otherwise available for survival. According to Ember (1978) about 60% of the societies of hunter
gatherers of which there is documentation were recorded to be at war at least once every two years. As to pre-industrial
civilizations it is enough to recall world and European history (for instance, considering European history immediately preceding
the Industrial Revolution, in the 16th century 95% of the time there were wars involving the major European powers, 94% in the
17th and 78% in the 18th century; cf. Eloranta, 2005). For the issue of population control in pre-industrial societies, with a survey
technology in particular, there was some population growth at a very slow pace, slightly accelerating in time, as shown in table 5. 32 Later on, with the spread of the Industrial Revolution the decrease in mortality rates led to a much faster population growth, while the demographic consequences of two world wars and related upheavals in some areas is shown in a temporary decrease in growth rates. The post World War II period has seen an unprecedented population explosion, with some signs of abating however following increasing living standards and progresses in the technology of birth control, spreading from the more advanced countries to the lesser developed areas of the world.
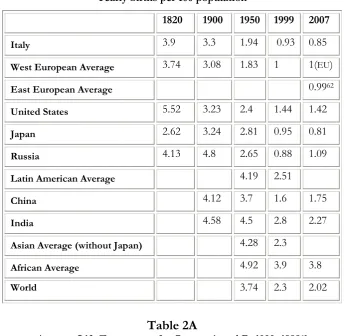
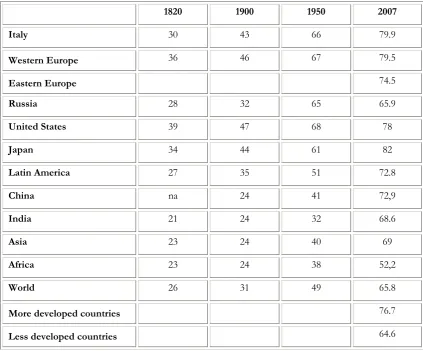
What have been the causes of the post World War II world population explosion? Essentially the reduction in mortality rates and the increase in life expectancy (see the tables in the Statistical Appendix at the end). The birth rate has on the whole decreased in the post-war period, but the increase in life expectancy has been stronger; in the world as a whole 17 years between 1950 to 1999, more or less the same as in the first half of the twentieth century, three times more than the increase of life expectancy in the crucial eighty years of the spread of the industrial revolution, from 1820 to 1900. One may also note that all the areas of the world have partaken in the great advance of life expectancy,33 while the present inequality in average life expectancy between the different areas (about 50% between the highest, Western Europe, and the lowest, Africa), is much lower than that in wealth or income (see the Statistical Appendix).34 (With respect to some other life statistics however the picture is more extreme.) One of the reasons of the population explosion in the post WWII period lies in the impact of the “green” revolution in third world countries such as Mexico and India and the strong growth of agricultural production, as well as the improvements in transportation.35 Moreover there was no major demographic catastrophe, of the kind that in the old times were blocking demographic advance in a secular perspective.36 For some relevant demographic data we may refer to the statistical appendix at the end.
32 The relation between population growth and agricultural technology was stressed by Boserup (1965) even if in Boserup’s work
the causal relation was supposed to act in the contrary sense than the one implied above; the crucial element being the density of
population affecting the length of fallows. However this could be the case if a complete blueprint of alternative agricultural
techniques were to exist at any given time, not if alternative agricultural techniques had to be discovered, or rediscovered, in a
lengthy historical process. For a critical assessment of Boserup’s work, see Federico (2001).
33
Cf. tables 4 and 5.
34
Moreover, “differences in lifetime survival rates between rich and poor countries and between rich and poor individuals within
countries were much higher two centuries ago than they are now” (Milanovic et alii, 2007, p. 29).
35
With the “green revolution” modern agricultural techniques and high productivity seeds were imported from the developed
world to developing countries through organized efforts spurred first by the Rockefeller Foundation (in Mexico since 1944) to
which the Ford Foundation later joined forces. “Across the world agricultural production, including meat production, doubled
between 1820 and 1920, doubled again between 1920 and 1950, again between 1950 and 1965, yet again between 1965 and 1975,
and continues to grow exponentially” (Scully, 2002, p. 29).
36
Such as in the case of the Black Death. The only globally relevant demographic catastrophe in the after War II period could have
M
ADDISON’
S STATISTICAL SUMMING-
UP OF WORLD ECONOMIC GROWTHEven in the poorest of continents, this means Africa, per capita income has strongly increased since when the present mode of production that followed the industrial revolution has spread to the whole world (see Table 6). This has taken place notwithstanding the rapid population growth, which in the post World War II years has become the highest in the world (2.69% yearly in the period 1973-2001, somewhat decreased to 2,36% in the last six years; see Table 5).
According to Maddison’s statistical account (somewhat daring, owing to the length of the historical period covered), per capita income has decreased in Western Europe during the first 1000 years of our era, from 450PP$ to 400 (where 400 stays for the physical subsistence level), reaching a nadir around 600 AD, and then starting a very slow recovery.37 In that period the rest of the world fared somewhat better, per capita incomes being throughout the period somewhat higher in Africa (430 at 1AD, 425 at 1000AD), and in Asia (450 in both years), while the remaining areas were still at low subsistence level (400). 500 years later the world as a whole had made some modest progress (from 436 to 566). Italy was by far the richest country with 1100PPP$, but was stagnating until the Industrial Revolution (1820). What were to become the Western Offshoots were the poorest at 400, Africa had somewhat declined at 414, stagnating until the colonial conquests of the nineteenth century, China had progressed from 450 to 600, staying at that level until 1820 and declining afterwards, down to 439 in 1950, Japan also progressed reaching 737 in 1820. At the threshold of the Industrial Revolution, in 1700, the richest world country were the Netherlands with 2130, Western Europe was somewhat lower than 1000PPP$ on average.38
Mao’s Great Leap Forward: “a dip in the growth rate from 1959-1960… was due to the Great Leap Forward in China. During that
time, both natural disasters and decreased agricultural output in the wake of massive social reorganization caused China's death
rate to rise sharply and its fertility rate to fall by almost half” (US Census Bureau, 18/7/2007; the dip could be graphically seen in
the sudden fall in the line of the population growth rate reported in the site of the World Population Clock,
http://www.census.gov/ipc/www/idb/worldpopinfo.html). According to Yao (1999) the demographic deficit in the three years
1959-61 was somewhat higher than 49 million, of which about 18.5 million extra deaths and the rest lost births. Not a big
difference anyway to the size of world population at the time, of about 3 billion. For other estimates one could refer to the
literature quoted by Yao, in particular Peng Xizhe (1987).
37
The data for the year 1 in Western Europe and Asia are considered implausibly low by Federico (2002, p. 115).
38
Table 6
World Per Capita GDP, Regional Averages, 1-2001 AD39 (1990 international Geary-Khamis dollars)40
1 1000 1500 1600 1700 1820 1870 1913 1950 1973 2001
Western Europe 450 400 771 890 998 1 204 1 960 3 458 4 579 11,416 19,256
Eastern Europe 400 400 496 548 606 683 937 1 695 2 111 4 988 6 027
Former USSR 400 400 499 552 610 688 943 1 488 2 841 6 059 4 626
Western Offshoots 400 400 400 400 476 1 202 2 419 5 233 9 268 16,179 26,943
Latin America 400 400 416 438 527 692 681 1 481 2 506 4 504 5 811
Japan 400 425 500 520 570 669 737 1 387 1 921 11,434 20,683
Asia (excl. Japan) 450 450 572 575 571 577 550 658 634 1 226 3 256
Africa 430 425 414 422 421 420 500 637 894 1 410 1 489
World 445 436 566 595 615 667 875 1 525 2 111 4 091 6 049
Economic growth has been accompanied, wherever data are available, by a great reduction, in many cases almost a halving, since 1870, of labour time (Maddison, 2006, p. 347). And hence by an enormous growth of hourly labour productivity (p. 351). Notwithstanding the reduction in labour time production per worker has greatly increased (about ten times since 1870 in Western Europe; Maddison, 2006, p. 349).
39
Maddison, p. 642.
40
For the definition of Geary-Khamis dollars cf. United Nations, 1992. Perusing the above data it results obvious that at the time
Marx was writing Das Kapital no amount of redistribution could have ever brought about the dramatic improvement in the living
standards of the masses that technical progress and development (“the development of productive forces”) would have brought
about in less than a life-span. Thus Marx was right in downplaying the issue of distribution as such (cf. Marx, 1875). Distribution
may be important in the short-run for allowing some of the worse-off to improve their lot. In the long run it is more important for
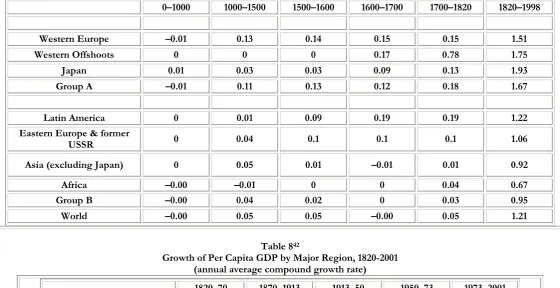
Table 741
Growth of Per Capita GDP by Major Regions, 0–1998 (annual average compound growth rate)
0–1000 1000–1500 1500–1600 1600–1700 1700–1820 1820–1998
Western Europe –0.01 0.13 0.14 0.15 0.15 1.51
Western Offshoots 0 0 0 0.17 0.78 1.75
Japan 0.01 0.03 0.03 0.09 0.13 1.93
Group A –0.01 0.11 0.13 0.12 0.18 1.67
Latin America 0 0.01 0.09 0.19 0.19 1.22
Eastern Europe & former
USSR 0 0.04 0.1 0.1 0.1 1.06
Asia (excluding Japan) 0 0.05 0.01 –0.01 0.01 0.92
Africa –0.00 –0.01 0 0 0.04 0.67
Group B –0.00 0.04 0.02 0 0.03 0.95
[image:17.595.38.561.393.568.2]World –0.00 0.05 0.05 –0.00 0.05 1.21
Table 842
Growth of Per Capita GDP by Major Region, 1820-2001 (annual average compound growth rate)
1820–70 1870–1913 1913–50 1950–73 1973–2001
Western Europe 0.98 1.33 0.76 4.05 1.88
Eastern Europe 0.63 1.39 0.60 3.81 0.68
Former USSR 0.63 1.06 1.76 3.35 -0.96
Western Offshoots 1.41 1.810 01.56 2.45 1.84
Japan 0.19 1.48 0.88 8.06 2.14
Latin America -0.03 1.82 1.43 2.58 1.84
Asia (excluding Japan) -0.10 0.42 -0.10 2.91 3.55
Africa 0.35 0.57 0.92 2 0.19
World 0.54 1.30 0.88 2.92 1.41
41
Sources: Maddison (2006, pp. 30; 643).
42
T
HE VERY LONG PERSPECTIVE OF THE WORLD ECONOMIC HISTORY ACCORDING TO THEM
ALTHUSIAN VIEWPOINTFig. 1 The Malthusian trap (“world economic history in one picture” ), according to Gregory Clark43
A possible interpretation of available historical evidence is the Malthusian one. Up to the dawn of industrial revolution the great majority of humans was on the brink of physical survival. In a very long perspective there was by and large a Malthusian equilibrium between population and resources, with a very weak long run growth, amounting to near stagnation, of world population.44 In the light of this interpretation distribution of income and wealth in the long run affects the size of the population (because it uses up resources that could allow a larger population to subsist), not the living standards of the masses. The existence of privileged strata, which in the short run at least are somewhat out of the Malthusian trap, can affect the well being of the poor through the externalities they generate. These could be negative (envy and the sense of relative deprivation) or positive (the hope, however slim, to be able to raise among the privileged, some identification with their interest and life experience).45 Their relative impact may depend, among others, on the degree of mobility in the society concerned. Religion could surrogate mobility in this world with a belief in mobility in the afterworld. Even in
43
Fig. 1.1 in Clark (2007).
44
For a recent book representing this point of view see Clark (2007).
45
According to Kenny (2006), and the empirical enquires reported by him, economic and social inequalities can have a powerful
negative effect on subjective measures of poverty and deprivation, so their impact in the past, when they were associated with even
greater differences in status and rights than in the present, could have been even more devastating than nowadays. Kenny also
underlines the negative impact of increasing expectations and new consumer goods on welfare or happiness. But happiness is a
rather subjective matter, as is well expressed by the Italian poet Metastasio: “Se a ciascun l'interno affanno si leggesse in fronte
scritto, quanti mai, che invidia fanno, ci farebbero pietà!” As economists, we may content ourselves with per capita incomes, but
the slave society of ancient Rome slaves had some degree of hope to be liberated and even to become affluent or, in Christian times, to earn after death, alike their rich masters, and ever more than they, the Kingdom of Heaven. Moreover the existence of some strata that were able to enjoy a surplus over subsistence could have been an engine (however very inefficient) of progress in living patterns, and an instrument for providing the resources for some to devote themselves to art, technology and science, with eventual long run benefits to average living standards, as well as cultural benefits for mankind. Other utilizations of surplus were for collective purposes, such as building cathedrals or waging wars, the latter being in itself one of the principal instruments, through their disruptive consequences, of population control. The working of the limiting factors on the growth of population could have affected economic progress negatively, pushing living standards down; however greater population density would have lead to more advanced production techniques and modes of organization, in particular through the division of labour and increasing returns to scale.46 Moreover, even if the Malthusian trap had worked in the very long-run, in the shorter run there may have been long periods when population growth was compatible with some improvements in living standards. Thus in the shorter run how wealth (land ownership in past agricultural societies in particular) was distributed could have made to a great deal of difference for the well being of the bulk of the population.
H
ISTORY AND THE PROBLEM OF UNDERDEVELOPMENTFrom our historical excursus it appears that for almost the totality of human history poverty and starvation have been the rule, wealth and affluence a tiny exception in a sea of misery and precarious lives. So the real historical singularity that must be explained is not poverty and backwardness, but development and wealth. If the issue of relative poverty and underdevelopment arises from the economic development of the countries that have become well off rather than from some countries having made worse off in an absolute sense (“exploitation”) it is to the development of poorer countries that one should turn for getting rid of the issue, as well as for reducing, and one day perhaps eliminating, absolute poverty. In a number of countries, particularly in Asia, the take-off has succeeded, in others, particularly in Africa, seems to have failed.
46
The take off from the Malthusian Trap, the Industrial Revolution, Socialism and
Transition
The gigantic increase in population and wealth in the last two centuries, and the very rapid (historically speaking) decrease in the proportion of the poor have been the outcome of a mode of production characterized by the systematic application to production of scientific principles, and the systematic and organized pursuit of scientific and technological progress, dramatically improving the living prospects of billions of men and women. According to conventional wisdom its ultimate sources may be found in the Renaissance and the Enlightenment, tied together by the Reformation’s critical discussion of traditional received faith. Until the Soviet Revolution this mode took the organizational form and vehicle of transmission of the internal and international capitalist market.47 Real socialism can be seen just a specific variety of this mode of production whereby the fundamental aspects have been upheld through a sort of rough extension of the rational organizing principle to the whole of society. Eventually this daring experiment has encountered a bitter dead end, but in the process it has partaken both of the increase in population as of the increase in aggregate production. Its failure has been a comparative failure, but still its achievements in aggregate economic and life statistical terms may be seen as substantial in relation to pre-industrial epochs. If we are willing to indulge a little bit in counterfactuals, suppose that real socialism had prevailed throughout the world by way of revolution and/or military conquest, destroying the international market system in the process. Probably, after the initial disruptive consequences of the change of system, it would have continued the process of increasing world wealth and population. Would it have been enough to argue that no better system is possible and to ascribe to the very nature of real socialism the productive outcomes? In this respect two viewpoints seem to be equally objectionable: that a really existing, and therefore highly imperfect, system of production has to be rejected because it did not do enough and another abstractly implementable system (soviet-type socialism vs. capitalism) should do better; as well the opposite contention that no better (in our case capitalism vs. soviet-type socialism) system of organization is possible.48
47
This does not detract anything from the role performed by the state, but the basic principle of economic functioning was
voluntary exchange.
48
POST
-
WAR DEVELOPMENT AND THEM
ALTHUSIAN TRAPLooking at the overall historical picture, a most remarkable fact is that the world has never grown so fast, as to population and wealth, as in the post World War II period. The possible causes have already been mentioned: globalization (the great intensification of international trade and investment),49 technical progress (and the progress of medicine), originating in the European countries and Anglo-European offshoots; in particular progress in transportation and agriculture, and the absence of devastating conflicts at the global level (the world has been for fifty years on the brink of nuclear global disaster, but it didn’t fall into the precipice, yet).
Notwithstanding the above success, for the world as a whole the Malthusian trap is still lurking. But rather than decreasing agricultural returns, as in the classical explanation, it may be here relevant the pressure on scarce natural resources, and in particular the retroaction on development and living standards of the possible “tragedies of the commons”, including climate change.50 The industrial and demographic developments that have accompanied the actual relative prosperity have taken place at the cost of world’s commons, in particular at the cost of the decumulation in the span of two hundred years of huge reserves of fossil fuels accumulated by the leftovers of hundreds of million of years of life on earth. To this one may add the destruction of forests and pristine habitats, the pollution or air and water, and, last but not least, CO2 emissions. The plunder has mostly taken place to the advantage of industrialized countries, and of countries disposing of large reserves of raw materials (in particular hydrocarbons), appropriating the rents of their exploitation. On the other hand the balance for poorer and energy poor countries cannot be considered as negative, since in the process their average living standards (considering both per capita income and life statistics) have greatly improved all the same, as a consequence of the diffusion of the technological advances of the West, notwithstanding the colonial domination to which most of them had been subjected in the past. But if more and more countries successfully pursue the type of industrialization and economic development that has made rich the West and better off the emerging economies, the pressure on resources and the enhanced generation of externalities may exert a negative feedback elsewhere, especially on the living standards of the countries deprived of natural resources, with potential destabilizing consequences on the economy and the peace of the world.
Extrapolating historical experience, the way out the Malthusian trap could lie on the one hand in the enhancing of technological progress, and on the other in population containment, lessening the pressure on the resource base (including the world commons). Population containment could be the outcome of a voluntary process, either at the individual and family level, following the demographic pattern of reduction of natality
49 On the role of international trade and openness in conjuring development and economic progress see Dollar and Kray (2004)
and the literature referred there.
50
According to a plausible view,very specialized life stiles, such as in the contemporary world, increase population vulnerability
accompanying the development of the presently more developed countries, or it may be favoured by public policy; the possible alternatives are the usual ones that have constrained the development of population in history. Once demographic developments are considered an object of policy some delicate philosophical problems present themselves: Is it better in presence of limited resources to have many overlapping generations with short lives, or fewer generations with longer lives? How short or how long, and how many generations? How many people for each generation? Many people with low living standards, or few ones with higher living standards? And how low or how high?51
THE LIMITS TO POPULATION GROWTH
It is obvious that a demographic explosion such as that of the last decades cannot last forever. Carlo Cipolla (1962, p. 86) quotes “an exercise in astronomical arithmetics” by C.P. Putnam (the inventor of the first windmill generation turbine), according to which “if the [human] race had sprung from a couple living not long before agriculture was discovered—let us say 10,000 B.C.—and if its members had expanded at the rate of one per cent per year since then [which is lower than the present rate of growth of world population], the world population would form today a sphere of living flesh many thousand light years in diameter, and expanding with a radial velocity that, neglecting relativity, would be many times faster than light.”
NATALITY
,
MORTALITY,
AND CATASTROPHESA correction to the process of world overpopulation could be found in decreasing the birth rate, as a by-product of per capita income growth, and the extension of social security systems to the countries where the survival of the elderly is otherwise dependent on family ties, as well as of the improvement and diffusion of the technology of birth control. But the progress of medical technology leading to a progressive decrease in the mortality rate can have the contrary effect. The shape of a future long-run population equilibrium, absent a sudden demographic catastrophe, could entail a low mortality rate, a low birth rate, a long life span, and a marked increase in the average population age. Perhaps a senescent population will be less dynamic but wiser. While we can think of demographic policies affecting the size of a population at the country level (even if a country could represent an important part of the world population, such as China), it seems hardly possible that demographic policies could be devised and implemented at the world level (such as advocated notably by Julian Huxley52) in order to take into account the important externalities that individual decisions regarding
51
These dilemmas can be seen as brought to their extreme consequences in Asimov’s utopian world of the Foundation series (cf.
in particular Asimov, 1986). As an alternative model to the crammed world of Trantor, the capital of the Galactic Empire, where
40 billion humans live in artificial domes, we have the very sparsely populated Solaria, where the population is controlled by strict
demographic planning, with few (mutated) humans living very comfortably in very large estates worked by armies of robots.
52
Cf. Julian Huxley (1964). Fictionally, there is far-reaching demographic planning in Aldous Huxley’s dystopian novel Brave
procreation have for the world as a whole.53 In the past demographic control avoiding the operation of the Malthusian trap was ensured in many instances by custom, involving habits such as organized celibacy (as in monastic orders), repression of sexuality and late marriages (the way out praised by Malthus himself), systematic infanticide, or belligerent habits increasing adult mortality.54 Under conditions of progressively increasing life expectancy demographic control could assume the form of some limitation to the length of life, if not explicitly and legally binding as in the dystopian world of the 10-th Victim,55 in the more subtle form of denying life supporting medical treatment and, possibly, the economic means of survival, to the elderly.
Of the three factors that have historically contributed to held populations in check through recurrent catastrophes: epidemic diseases, famines, and war, the impact of epidemic diseases has been greatly reduced by the progresses of medicine, and even the definitive cure or prevention through vaccination of the AIDS epidemics appears only question of time. Of course the possibility of the surfacing of some new epidemic disease, such as aviary influenza, is always possible, but only with temporarily limited consequences, until, presumably, medical research comes to grip with it. Mass starvation as a consequence of famine has been largely overcome by progresses in transportation and agricultural technique. Even if at the moment tensions are re-surfacing on the international food market, following the ill-advised subsidization of fuel producing crops, another green revolution is in process through the development of OGMs, which, notwithstanding misgivings and preconceived hostilities, seems essentially a foregone development. All in all the potentially most destructive factor, besides some sudden environmental disaster, could be eventually war, as a consequence of the spreading of atomic technology, and international tensions building up in an increasingly overcrowded and shrinking world.56
WAR
,
PEACE,
AND GROWTHFollowing the tragedy of the two world wars the international community refuses the model of wars directed to the enlargement of national borders and the acquisition of new territories.57 In the post war period these have been very limited: Tibet’s conquest by Mao’s China, Timor-Leste’s conquest by Indonesia, Western Sahara’s
53
A rather provocative and thought provoking discussion of the externalities generated by individual population decisions and the
(un)suitability of a deliberate public policy aimed at affecting them is Friedman (1972).
54
For an account of various methods of population control in different historical and anthropological contexts, see Caldwell and
Caldwell (2003).
55
Petri (1965).
56
It is well known that overcrowding is a factor of aggressiveness in animal populations. Some tendencies of this sort could apply
to human populations as well, especially if overcrowding leads to tension building processes such as massive migration flows and
increasing pressure on natural resources and the environment.
57 Waging a war of aggression, in particular, has been made an international crime in the charter of the United Nations (art. 39). It
annexation by Morocco, Saddam Hussein’s expansionary wars aimed to acquire new territories, in Iran first, and through the annexation of Kuwait later, and the wars of Yugoslav succession, renovating the old bloody Balkan wars. On the other hand rather than, or perhaps more precisely, in addition to, traditional war dangers, other different menaces arise from the conflict between faiths and ethnicities, partly enhanced and conjured by the increased movement of people from the poorer and demographically faster growing countries of the South towards the more affluent and demographically more stagnant countries of the North. Migrations may lead to an increase in inequality in the latter, insofar as migrants are on the whole less skilled than the natives.58 Thus, enhanced migratory movements could increase the inequality inside countries in relation to the inequality between countries, reversing the previous historical trend in the opposite direction.
The Bomb and the economic consequences of war and peace
The spreading of nuclear armaments brings about a reduction in the propensity to armed regional conflicts. After that India and Pakistan have acquired nuclear status there have been moments of acute tension, but, unlike in the past, none of these tensions has led to open war. Since it has become a nuclear power, Arab countries have ceased to wage open war to Israel. At the same time, in case an open conflict between atomic powers were to erupt, the consequences could be disastrous, and not only for the countries concerned. In the past the natural productive foundations on which to re-start a growth process were largely unaffected by catastrophic events (such as after the black death), as the foundation of wealth and survival was agriculture. Thus a war of conquest had some rationality (as in the present world it could appear to someone a war for controlling territories endowed with natural resources, in particular hydrocarbons). To conquer and enslave rich countries with advanced economies would bring about no advantage but disaster: the prosperity of the advanced countries relies on very delicate social and economic mechanisms. If the balance is destroyed, so is prosperity. A much greater surplus could be enjoyed through voluntary exchange than through conquest and enslavement. The game humanity played in the past, when conquest, plunder, territorial expansion and domination, slavery, torture and mass killings were respectable endeavours and part of the rules of the game, and mass murderers acquired the status of national heroes, still remembered and glorified in monuments and history books, led on the whole to very poor results, as measured at least in terms of population and economic growth. As we have seen, until the modern era the progress of humanity, both in terms of population and of productive achievements, was so slow as to amount, in our present perception of time, more to stagnation than to growth, with long spans of regression. The first millennium of the vulgar era was for Europe a lost millennium: the decadence and fall of the Roman Empire and the dislocations following the barbaric invasions left Europe worse off economically in the year 1000, at the dawn of the new Christian nations, than at the time
but this did not hinder Nazi Germany and the Soviet Union attacking Poland in September 1939, thus starting the second world
war!
58
of the birth of Jesus Christ, with the bottom reached around 600. The real progress, meaning a substantial overcoming of the Malthusian trap (or anyway, whatever the interpretation, of the near stagnation in world population and economy), had to wait until the Industrial Revolution gradually expanded all over the world. But it has been the peace period after the Second World War (localized conflicts notwithstanding) that has led to the greatest acceleration in the speed of demographic and economic progress the world has ever known in its history. In the present world the victory in a nuclear war would be a Pyrrhic one, since conquered or defeated territory would stay contaminated and unproductive for the foreseeable future, 59 and the wealth of the defeated would be destroyed with their physical destruction, not to speak of the losses of the victor. Until now this entirely rational consideration (as well as the fear for the enormous losses of a nuclear war) has prevented wars between nuclear powers. But with the spreading of nuclear technology, together with irrationality and fanaticism, and the tensions originating from the possible increasing scarcity of basic resources, such as fossil fuels or water, how much will this interval of relative, and relatively affluent, tranquillity last? Carlo Cipolla’s words in the concluding page of his Economic History of World Population (1962, p. 133) still continue to be of great relevance, no less than at the time they were written:
“There is nothing more dangerous than technical knowledge when unaccompanied by respect for human life and human values. The introduction of modern techniques in environments that are still dominated by intolerance and aggressiveness is a most alarming development…Ethical progress has to accompany technical and economic development. While teaching techniques, we have to teach also respect for the dignity and worth and indeed the sanctity of human personality.”
But to teach how? The solution to invade “rogue” countries that house dangerous territorial expansion programmes, with the declared purpose of spreading democracy and human rights (conforming to the German and Japanese model of post-war occupation and re-education) does not seem any near to have attained the declared objective. Even more, it has apparently disturbed wasps’ nests of archaic barbarism. Moreover the credential of the West as a teacher of “respect of human life and human values” are rather poor. Only in the last 60 years or so of its very long history has the West unanimously repudiated the wars of conquest that in the past were one of the most popular endeavours of its nations and its rulers. The Fascist wars of the last century have been the continuation, to its extreme consequences, of a tradition of humanity by which war and conquest were a source of glory and pride. Now that the game with us is over we want to persuade the others to renounce to the game themselves. But the success of such an effort of persuasion and assimilation to recently embraced western values of peace and toleration (that has been apparently quite successful in the case of post-war Japan) is vital both for the rest of mankind and for the West alike, owing to the destructive power of modern nuclear warfare, and the fact that eventually the West will not be able anymore, in face of the growth of
59
the economic and military potential of the Rest (or rather of a subset of it, first of all China), to maintain its economic and military dominance.
DANGERS FOR THE FUTURE
But it will not necessarily succeed. Traditional power politics and dangerous breakmanship may resurface again in a world where the West will have lost its primacy. Possible factors leading to disaster could be, for instance, a revanchist imperially minded Russia, a paranoid future American president, misusing his control of nuclear warfare, an aggressive China willing to use its rapidly increasing military power to bully and submit her neighbours (first of all Taiwan) or even to reverse the unequal treaties with the czarist empire,60 and claim the immense natural resources of a sparsely populated Russian Asia, the irresponsible action of some rogue nuclear state. Sooner or later we may go back to normality, but with much enhanced capabilities for destruction. Our world has always been a very dangerous place, and eventually it will be quite unsuitable for human survival, and, more broadly, for animal survival, anyway. In the meantime, after the possible demise of mankind and before the end of the earth, the radioactive left-over of global nuclear warfare could, by favouring mutations, engender the creation of many other strange living species, and the human race may be recalled just as a particularly weird specimen, among the many bizarre animal species that have populated the earth, perhaps the only one so vain to harbour the very strange egocentric anthropocentric thought that the earth, and the whole universe, were created just for its own benefit.
REFERENCES
Asimov, Isaac, Foundation and Earth. London, Grafton Books, 1986.
Boeri, Tito, Gordon Hanson and Barry McCormick, Immigration Policy and the Welfare System. Oxford: Oxford Un. Press, 2002.
Boserup, Ester, The Conditions of Agricultural Growth: The Economics of Agrarian Change under Population Pressure. London, G. Allen and Unwin, 1965.
Bourguignon, Francois, and Christian Morrisson, “Inequality Among World Citizens: 1820-1992”. American Economic
Review, vol. 92, No.4(September 2002), pp. 727-744.
Briggs, Asa, “Technology and Economic Development”, in Briggs, Asa et alii (1963).
Briggs, Asa et al., Technology and Economic Development: A Scientific American Book. Penguin: Harmondsworth, 1963.
Caldwell, John C. and Bruce K. Caldwell, “Pretransitional Population Control and Equilibrium”. Population Studies, Vol. 57, No. 2, 2003, pp. 199-21.
Caldwell, John C. and Thomas Schindlmayr, “Historical Population Estimates: Unraveling the Consensus”. Population and
Development Review, Vol. 28, No. 2. (Jun., 2002), pp. 183-204.
Chen, Shaohua and Martin Ravaillon, “How Have the World's Poorest Fared Since the Early 1980s?", Word Bank
Research Observer, vol. 19, n° 2 (Fall 2004), accessed at http://iresearch.worldbank.org/PovcalNet/jsp/Introduction.jsp.
Chen, Shaohua and Martin Ravaillon, “Absolute Poverty Measures for the Developing World, 1981-2004”, World Bank, 2007, accessed at http://iresearch.worldbank.org/PovcalNet/jsp/Introduction.jsp
Chilosi, Alberto, “On the Economics and Politics of Unrestricted Immigration”, Political Quarterly, no. 4, vol. 73, 2002, pp. 431-436.
60
The Treaty of Aigun (1858) and Treaty of Peking (1860) leading to the cession to Russia of Outer Manchuria, the only
Chu, C. Y. Cyrus, Population Dynamics: A New Economic Approach. Oxford: Oxford University Press, 1998 Cipolla, Carlo, The Economic History of World Population. 6-th ed. Harmondsworth: Penguin Books, 1974 [1962]
CIA, World Factbook, 2007, available at: https://www.cia.gov/library/publications/download/download-2007/index.html
Clark, Gregory, A Farewell to Alms: A Brief Economic History of the World. Princeton: Princeton Un. Press, 2007
Davies, James, Susanna Sandström, Anthony Shorrocks and Edward Wolff, “The World Distribution of Household Wealth”, 5/12/2006a, http://www.weourselves.org/reports/wider-wdhw-report-5-12-2006.pdf.
Davies, James, Susanna Sandström, Anthony Shorrocks and Edward Wolff, “World Distribution of Household Wealth”, power point presentation, London, 5/12/2006b http://www.wider.unu.edu/research/2006-2007/2006-2007-1/wider-wdhw-launch-5-12-2006/wider-wdhw-powerpoint-presentation.pdf
Demsetz Harold, ‘Information and Efficiency---Another Viewpoint’, Journal of Law and Economics, 12, (1969), pp. 1--22, reprinted in H. Demsetz, The Organization of Economic Activity, Blackwell, Oxford, 1988, volume 2.
Dollar, David and Aart Kraay , “Trade, Growth, and Poverty”. The Economic Journal,vol. 114 (493), 2004, pp. F22-F49. Eloranta, Jari. "Military Spending Patterns in History". EH.Net Encyclopedia, edited by Robert Whaples, September 27,
2005. URL http://eh.net/encyclopedia/article/eloranta.military.
Ember, Carol R., “Myths about Hunter-Gatherers”. Ethnology, Vol. 17, No. 4. (Oct., 1978), pp. 439-448.
Federico, Giovanni, "Review of Ester Boserup, The Conditions of Agricultural Growth: The Economics of Agrarian Change under
Population Pressure." EH.Net Economic History Services, Apr 16 2001.URL: http://eh.net/bookreviews/library/federico.
Federico, Giovanni, “The World Economy 0–2000 AD: A Review Article”. European Review of Economic History, 6 (2002), pp. 111–120.
Friedman, David, “Laissez-Faire in Population: the Least Bad Solution”. An Occasional Paper of the Population Council., 1972. Available at http://daviddfriedman.com/Academic/Laissez-Faire_In_Popn/L_F_in_Population.html
Haslam, Jonathan, “Review: Soviet-German Relations and the Origins of the Second World War: The Jury Is Still Out”.
The Journal of Modern History, Vol. 69, No. 4. (Dec., 1997), pp. 785-797.
Haub, Carl, "How Many People Have Ever Lived on Earth?" Population Today, February, 1995.
Hellie, Richard, “Slavery”; Encyclopaedia Britannica’s Guide to Black History, 2007, accessed at http://www.britannica.com/blackhistory/article-9109538.
Hu, Timothy, “China marches forward”, Jane’s Security News, 19/4/2007, http://www.janes.com/security/international_security/news/jdw/jdw070419_1_n.shtml
Hujo, Katja and Nicola Piper, “South–South Migration: Challenges for Development and Social Policy”. Development, 2007, 50(4), pp. 19–25
Huxley, Julian, Evolutionary Humanism. New York: Prometheus Books, 1992 (originally published by Penguin Books, in 1964 with the title Essays of a Humanist).
Kenny, Charles, “Were People in the Past Poor and Miserable?”. KYKLOS, Vol. 59, 2006, no. 2, pp. 275–306. Maddison, Angus, The World Economy. Paris: OECD, 2006.
Marx, Karl, “Critique of the Gotha Programme”. Translation of the original German text in 1875. Available at: http://www.marxists.org/archive/marx/works/1875/gotha/
McEvedy, Colin and Richard Jones, Atlas of World Population History. New York: Penguin, 1978.
Milanovic, Branko, “Global Income Inequality: What It Is And Why It Matters?”, DESA Working Paper No. 26, August 2006, at http://www.un.org/esa/desa/papers/2006/wp26_2006.pdf.
Milanovic, Branko, Peter H. Lindert, and Jeffrey G. Williamson, “Measuring Ancient Inequality”. World Bank, October 2007. At http://siteresources.worldbank.org/INTDECINEQ/Resources/AncientInequality.pdf
Peng Xizhe, "Demographic Consequences of the Great Leap Forward in China's Provinces," Population and Development
Review 13, no. 4 (1987), 639-70
Petri,.Elio, The 10th Victim (original Italian title: La Decima Vittima), 1965 movie (based on Robert Sheckley’s 1953 short
story “The Seventh Victim”).
PRB (Population Reference Bureau), World Population Data Sheet2007; at http://www.prb.org/pdf07/07WPDS_Eng.pdf. Ravallion, Martin, Shaohua Chen and Prem Sangraula, “New Evidence on the Urbanization of Global Poverty”. World
Scully, Matthew. Dominion. New York:: St. Martin's Press, 2002.
United Nations, “The World at Six Billion”, 1999, at
http://www.un.org/esa/population/publications/sixbillion/sixbillion.htm.
United Nations, “World Population Prospects: The 2006 Revision Population Database”, 2006,
http://esa.un.org/unpp/p2k0data.asp
United Nations, “Annex II - Methods of Aggregation” Handbook of the International Comparison Programme. New York: ONU, 1992, accessed at http://unstats.un.org/unsd/methods/icp/ipc7_htm.htm
US Census Bureau, “Historical Estimates of World Population”, 13 July 2007, at
http://www.census.gov/ipc/www/worldhis.html.
US Census Bureau, “World Population Information”, 18 July 2007, at
http://www.census.gov/ipc/www/idb/worldpopinfo.html
WHO (World Health Organization), World Health Statistics, 2007. downloaded at http://www.who.int/entity/whosis/whostat2007.pdf
WHO, National Burden of Disease Studies: A Practical Guide. Geneva; WHO, 2001
World Bank,World Development Indicators, 2005.