Munich Personal RePEc Archive
Technology, Trade Specialization and
Development: Jumping to Technology
Development Era
Mellati, Ali
Gokhale Institute of Politics and Economics
October 2008
Online at
https://mpra.ub.uni-muenchen.de/26643/
For Presentation at The 7th APEF International Conference on
East and West Asia Trade and Economic Relations: Opportunities, Challenges and
Outcomes
University of Sistan and Baluchestan, Zahedan &
University of Isfahan, Isfahan Iran
Email : [email protected]
Website: www.gipe.ernet.in
Tel: +91 20 25654288/89 Fax: +91 20 25652579
Abstract
Developing countries often are characterized as producers and exporters of a few
types of natural resource based goods. Intuition dictates that these countries should
change their strategy from being merely merchandise producers to technology developers
in order to experience higher level of development. Hence, the study analyses the effect
of technology production and export specialization on the per capita income and growth
of some countries in West and East Asia and the Pacific and investigates their behavior in
this regard. Moreover, some recommendations are drawn for East- West Asian economic
relationships from these results.
Keywords: Technology, International Trade, Development, Comparative Advantage
Introduction
There is an emphasis on accumulated capital and physical investment for meeting
a higher level of productivity and economic growth in developing countries since two
hundred years ago. Fagerberg (2006) argues that “this perspective arguably reflects the
important role played by “mechanization” as a mean for productivity advance”. Solow
(1956) in his contribution to the theory of economic growth demonstrates that under
similar circumstances investment in poor countries would be more profitable than in the
richer one, therefore, former would be characterized by higher investment and faster
economic growth. But evidence does not support this tendency towards higher level of
growth (Fagerberg, 2006). Romer (1990) shows that difference in knowledge as a factor
can explain this gap.
On the other hand, some economists highlight the effect of international trade on
income and growth (e.g. Frankel & Romer, 1999 and Weinhold & Rauch, 1997). This
effect goes beyond a simple volume change because of better reallocation of resources
(Bauer, 2008), Learning effects and international knowledge and technology spillovers
(Castellani, 2001 and Keller, 1997 and Grossman & Helpman, 1994 and Young, 1991)
and specialization (Weinhold & Rauch, 1997).
Rosenberg (2004) argues that there are two ways of increasing the output of the
economy: first, increasing the number of inputs that apply in productive process and
second, thinking about new ways in which more output can be got from the same number
of inputs. As resources are scarce, later is likely to be more effective than the former. As
it is clear all roads directly or indirectly end to the knowledge and technology
we study about trade, comparative advantage is highlighted in most textbooks and
researches. These comparative advantages mostly are due to the production and export of
natural resources in developing countries. For instance, Mehrara and Rostami (2006) find
out Iran has comparative advantage on goods which are based on its static advantages
like handicrafts, textile, garments, natural resources and agriculture. Mahdavi and
Malekshahi (2004) indicate that Iran has comparative advantage on petrochemical
productions which is because of its crude oil resources. Thus, these countries stuck in a
vicious circle; export of goods which are produced due to static comparative advantages
and using the gains for importing the capital goods and technology. Therefore,
developing countries become merchandise producers instead of being technology
developers. This cause they get away of knowledge and specialization which is needed
for competition in international markets and consequently higher level of income and
economic growth. Hence, their lower level of productivity and growth will not improve
except they change their strategy from being a merchandise producer to technology
developer and rely on dynamic comparative advantage i.e. comparative advantages that
develop over time through R&D and learning process.
Therefore, this hypothesis is examined that when countries can meet higher level
of productivity and growth that they can be specialized in export of capital goods and
technology instead of exploiting their natural endowments. Export of technology can be
interpreted as countries advancement in knowledge and technology which is needed for
international competition and consequently higher growth and productivity. This study
Third section is dedicated to data and their resources. Methodology and outcome analysis
have delineated in section four. Conclusion has come in section five.
Literature Review
There is an ample of studies through which the effect of total international trade
on productivity and growth has been examined (e.g. Bauer, 2008 ; Alcala and Ciccone,
2003 ; Bernard and Jensen, 2001 ; Harris and Kherfi, 2000 ;and Frankel and Romer,
1999). At the lower level, there are studies that examine the effect of specialization on
productivity and growth. According to Ricardo’s classic analysis, regions specialize due
to their comparative advantages. Furthermore, national differences in technological
capabilities can shape their specialization and trade. But as Grossman and Helpman
(1994) argue the pattern of relative technological capabilities is entirely arbitrary in this
model. As a consequence, the model has nothing to say about the type of goods in which
a country with certain characteristics might be expected to export.
Most studies about the relationship between specialization and productivity and
growth examine the effect of former, in its absolute sense, on the later irrespective of the
nature of the specialization. Specialization in this sense leads to higher productivity
growth in the form of learning (Dalum et al., 1999). Grossman and Helpman (1994)
count some channels through which this learning process takes place. First, learning
process could occur due to learning by doing which can generate either as a by-product of
activities undertaken of other purposes or as the result of more deliberate efforts to create
knowledge. Second, International process can ease learning process with respect to
international transmission of technology. However, technological progress would have no
growth prospects has comparative advantage in a country and thus larger or more
productive, trade can tilt the equilibrium growth path in the “wrong” direction
(Grossman and Helpman, 1994). Third, Innovation is another path of learning process.
Grossman and Helpman (1994) explicate that:
A Patent or trade secret typically gives an innovator the ability to
exercise monopoly power in the product market. That is a firm with
propriety access to an innovative technology usually can price above
marginal cost without losing all of its sales.
On the other hand research investments are intended to reduce the production costs and
improve quality of the various inputs.
As it is clear specialization can affect productivity and growth through its impact
on knowledge and technology. Therefore, specialization in creation and export of
technology or capital goods pushes a country to generate and catch up higher levels of
knowledge and technology. This kind of specialization in world market induce
competitive pressures that lead to technological upgrading, efficiency gains in production
as well as in management procedures which is essential for growth and higher level of
productivity(Crespo-Cauresma and Worz, 2005). Furthermore, technological
specialization has a significant effect on international competitiveness (Gustavsson et al.,
1996). Krugman (1986) points out that a country in global economy which is known as
more advanced has an absolute advantage in producing all goods. But it has comparative
advantage about more sophisticated goods. As technological gap matters relatively least
technological advanced country produces and exports the more knowledge-intensive
goods.
There are some empirical studies in which the effect of type of specialization on
productivity and growth has been examined. For instance, Crespo-Cuaresma and Worz
(2005) find out that export in technology-intensive industries have a higher potential for
positive externalities coupled with higher productivity levels covering 45 developed and
developing countries and including 33 industries over 1981 – 1997. Dalum et al. (1999)
indicate that specialization in activities offering high levels of technological opportunity
are expected to have a positive impact on growth for 11 industries in OECD over
1965-1988. These studies often have to consider lots of industries which are not very
conclusive for our purpose. Our aim in this study is to compare specialization in capital
goods and technology to specialization in production of natural resources in a conclusive
aggregate level that is plausible regarding to the new datasets.
Data
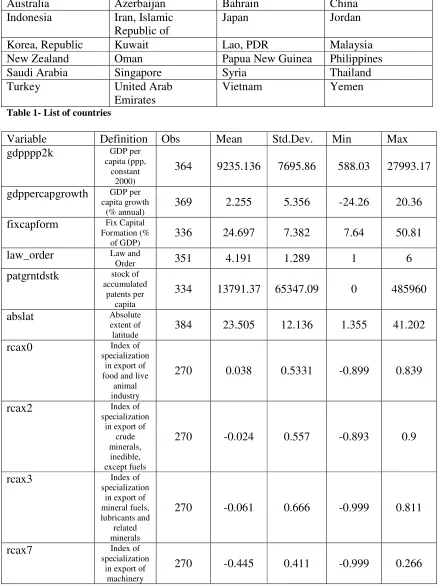
Data have been collected from West and East Asia and Pacific for 24 countries
over 1988 to 2003. Collection of countries has been dictated by availability of data for
each country. Name of included countries has been indicated in Table-1, appendix. West
Asian countries are well known for their natural resources especially crude oil, mines and
agriculture and East Asian countries characterized by their rapid growth in manufacturing
and technology-intensive productions. Definition of data and their sources have come in
Data about international trade are available from United Nations Commodity
Trade Statistics Database1 . All data have been converted to U.S. dollars using exchange
rates supplied by the reporter countries. Data have come in different international
commodity classification standards which Standard International Trade Classification
(SITC), Revision 3 has been applied in this research which gives proper time series as
well as appropriate classification for necessary aggregate level. Following formula has
been utilized for calculation of export specialization index:
x x x x
xs
n i in
in =
Where xsin denotes index of specialization of country i in commodity class n . xinis
export of commodity class n from country i. xi is total export of country i. xn denotes
total export of n from included countries and x is total export of included countries. As
Iapadre (2001) demonstrate:
One problem of the normalized market share lies in the fact that its
measure of specialization is asymmetric: it rages from 1 to infinity for
products in which a country reveals comparative advantage, but only from
zero to 1 for comparative disadvantage products. This asymmetry creates
problems in econometric work on specialization patterns.
One solution for this problem is generating a symmetric index by the following
procedure:
1 1
+ − =
in in in
xs xs rcax
Where rcaxin is symmetric specialization index of export of class n from country i. In a
same way symmetric specialization index of import for each country can be calculated.
As a measure for productivity level GDP per capita based on purchasing power
parity has been utilized. Data are in constant 2000 international dollar. Productivity
growth is calculated as first difference of logarithm of productivity level. Average annual
growth of gross fixed capital formation based on constant local currency has been used as
a measure for investment. All of these three measures have been collected from World
Development Indicators (2005) prepared by the World Bank.
The measure of Law and Order is collected from POLCON project by Henisz
(2002) and defined as:
A country with a sound law and order tradition has sound political
institutions, a strong court system and provisions for an orderly
succession of power. This indicator reflects the degree to which the
citizens of the country are willing to accept the established institutions to
make and implement laws and adjudicate disputes. A high point total
means that there is a strong law and order tradition, while a low point
total means that there is a tradition of depending on physical force or
illegal means to setting claims.
Data about the stock of accumulated patents per capita have been retrieved from
Lederman and Saenz (2005). This index is used as a proxy for accumulated knowledge
existed in a county. Absolute extent of latitude has been collected from Easterly (2001).
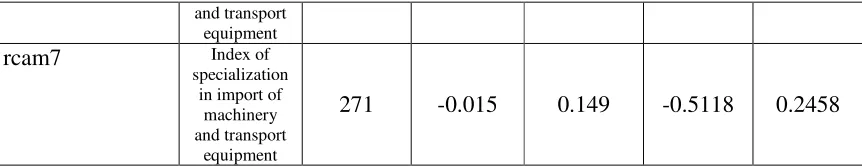
Definition and summary statistics of these variables have been indicated in Table-2 of
Methodology and Outcome Analysis
Capturing the effect of trade specialization on productivity and growth and for
tracing the effect of technology through this line, index of trade specialization for four
main categories has been calculated: 1- Food and live animals (group 0)2- Crude
minerals, inedible, except fuels (group 2) 3- Mineral fuels, lubricants and related
minerals(group 3) 4- Machinery and transport equipments (group 7). As it is clear
specialization in the first three categories could be occurred because of natural and
geographical advantages without any need to a tremendous research or designing
programs or creating very complicated technologies, while specialization in forth
category mostly as capital goods needs a high level of R&D activities for new designs,
solutions for complicated problems and competing with new technologies. Therefore,
specialization in forth category will make a country to be advanced in term of technology
while the first three one do not have this impact.
As Goh and Olivier (2002) point out when countries have been specialized in
import of capital goods they can obtain lots of learning opportunities through which
growth process could be promoted (see also Busse and Groizard, 2006). Hence, index of
specialization in capital goods import (i.e. import of forth category) also is added to the
model to catch and examine this effect. The study is carried out two times. Once it
examines the effect of specialization on the level of productivity and then it studies the
Specialization and Level of Productivity
Some variables are included to control the effect of specialization on the level of
productivity. First factor is institution which is noted as a significant factor on the level of
productivity in different studies (e.g. Hansson, 2006 , Lederman and Saenz, 2005 , Alcala
and Ciccone, 2003). Index of Rule of Law is included as a proxy for institutions in a
country. The other line which is emphasized in this context is the effect of geographical
characteristics on productivity through its effect on trade (e.g. Alcala and Ciccone, 2003).
However, some studies point out that geographical distance cannot be a serious obstacle
for trade (Azerbaijani et al., 2003 and Frankel and Romer, 1999). Latitude of each
country is included to control for effect of this factor. Therefore, the model is
+ +
+ +
=
i
i ircax
rcam abslat
order law
k
gdpppp2 α β( _ ) γ( ) δ 7 λ , i=0,2,3,7
Where, gdpppp2k is productivity level with purchasing power parity method, law_order
is index of rule of law, abslat is absolute extent of latitude, rcam7 denotes index of
specialization in import of capital goods, and rcaxi is index of specialization in export of
four abovementioned groups.
The problem of endogeneity has been reported in different studies (see Rodriguez
and Rodrik, 1999; Amable, 2000; Baldwin, 2003 and Lederman and Maloney, 2002).
Hence, the stock of accumulated patents per capita is employed as instrumental variable.
This variable is outcome of research and innovative activities and investment of a
country. This endogeneity can be diagnosis via a simple OLS regression between
Instrumental Variable (IV) and other variables. The result of this regression has indicated
in Table-5 of appendix. Model m1 shows the relationship between patent stock and the
specialization in export of capital goods. Both show a positive and significant
relationship therefore, this instrument will take into account and a 2SLS method is
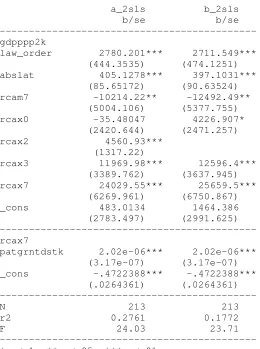
employed to estimate the parameters. The outcome of estimation has come in Table-6.
F-statistics 24.03 rejects the hypothesis that all coefficients equals zero however, R2 is not
very high. Institutions (i.e. rule of law) and geographical factor (i.e. latitude) show a
positive and quite significant effect on productivity level at 0.01 level, while,
specialization in import of capital goods has negative and significant effect on the level of
productivity at 0.05 level. This result does not support those of Goh and Olivier (2002)
and Busse and Groizard (2006). All of export specialization indices indicate a positive
and significant impact on productivity at 0.01 level except specialization in group of food
and live animals which is negative and insignificant. This can happen because of
multicollinearity between this group and group 2 (i.e. Crude minerals, inedible, except
fuels). Correlation between these two groups is 0.7670 and has been shown in Table-3.
Therefore, this model is re-examined without group 2 to check for multicollinearity. As it
has been shown in model b_2SLS of Table-6, coefficient of this variable became positive
and significant at 0.1 level. The most important point is that coefficient of specialization
in export of capital goods is greater than other kinds of specialization in both models.
Specialization and Growth
The general type of model to be estimated is an adjusted form of which is
suggested by Bensidoun et al.(2001):
it jit j
j it it
it i
it
it y y inv rcam rcax
y −ln − =α +βln − +σln +φ 7 +λ +ε
Where yit is average of the PPP GDP per capita of country i for time t to t-5.
it
inv denotes the investment rate on average for period t−5to τ −1. Rcam7 is index of
specialization in import of capital goods. rcax denotes the specialization indicators of
export. αi shows individual fixed effects. A first difference transformation wipes out the
individual effects. ) ( ) ( ) 7 7 ( ) ln (ln ) ln (ln ln ln 1 1 1 1 2 1 1 − − − − − − − − + − + − + − + − = − it it j it it j it it it it it it it it rcaxj rcaxj rcam rcam inv inv y y y y ε ε λ γ δ β
As it is common the generalized method of moments (GMM) is used to estimate
this equation as the within estimator is inconsistent in the case of a dynamic panel-data
model. In addition, the GMM allows the issue of endogeneity of right-hand side variables
to be simultaneously handled. But utilizing GMM estimators come with its price. This
model may need a large sample size (Hayashi, 2000). The consequence is that the
efficient GMM estimator can have poor small sample properties.
Specialization indices are considered as endogenous and the stock of granted
patents are applied as additional instrument. The robust standard errors applied to
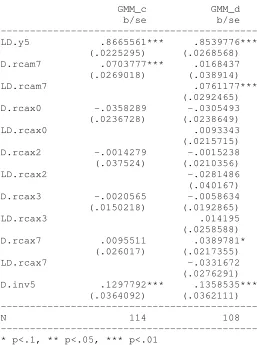
overcome potential heteroskedasticity. The result has been indicated in Table-7.
Arrelano-Bond test for autocovariance in residuals of order 1 is 0.0805 which rejects the
null hypothesis of no autocorrelation. Thus, the lag of endogenous variables (i.e.
specialization variables) is included to solve the autocorrelation problem. Test statistics
of 0.2072 does not reject the null hypothesis of no autocorrelation of order one. First
difference of import of capital goods and its lag shows a positive effect on growth
export of capital goods is positive and has significant effect on growth in 0.1 significant
level. Other types of specialization do not show a significant effect on growth.
Conclusion
To sum up, 2SLS and GMM regressions have been applied to examine the effect
of specialization in export of capital goods on productivity level and growth. There is
strong evidence that higher level of specialization in export of capital goods and
technology accompanies with higher level of productivity. However, specialization in
agriculture, minerals and energy has positive effect on productivity but the specialization
in capital goods and technology shows higher coefficient. Specialization in export of
capital goods and technology shows a positive and significant effect on growth of
productivity, nevertheless, this evidence is not very strong. There is no evidence that
specialization in export of other types of goods has positive, significant effect on growth.
Specialization in import of capital goods and technology shows a more significant effect
in this regard.
Andersson and Ejermo (2006) point out that specialization and comparative
advantage can be created by investment in technology and knowledge. Darvishi and
Asgari (2006) demonstrate East Asian countries switched their comparative advantage
through this investment from agriculture to industrial sector. But structural change of the
economy is not possible without an effective and well defined country’s innovation
system and technology transfer (Gubriel, 2002).
There are different schemes through which knowledge and technology can be
1- Acquiring non-documented knowledge 6-Strategic R&D partnership
2- Internal R&D 7-Licensing
3- Reverse engineering 8- Purchasing
4- Contract R&D 9-Joint Venture
5- Acquisition of a company with technology
While just a few methods are performed in Iran (e.g. licensing, purchasing or reverse
engineering), other paths to technology advancement are mostly ignored. Among these
schemes, especially strategic R&D Partnership and joint venture between East and West
Asian countries can ease learning by interacting which is an essential element in learning
of tacit knowledge and innovation.
But the problem is that acquiring technological leadership requires not only
intensive research activity but also a high rate of investment (Gustavsson et al., 1996).
Fostering the rate of investment needs a lower level of macroeconomic, socio-political
and governance uncertainty (Mellati, 2008). Furthermore, new financial instruments with
respect to Islamic law are needed in order to reduction of financial risks and uncertainties
in this regard. Clearer and strictly enforced intellectual property rights are also suggested
by lots of researchers and institutions.
Temporary protection policies that induce an economy to specialize in production
and export of capital goods and technology are suggested by Krugman and Venables
(1993). Strict protectionist hampers competition pressures while complete openness does
not let process toward shaping specialization and comparative advantage takes place.
Other strategy which is experienced by East Asian countries is shifting from the
added form of exporting known as full-package supply or original equipment
manufacturing (OEM) production (Gereffi, 1999). Shaping industrial clusters are based
on availability of a strong local base of specialized suppliers which are essential for OEM
Bibliography
Alcala, Francisco and Antonio Ciccone, 2003, Trade and Productivity”, Quarterly Journal of Economics, 119(2):613-646.
Amable, Bruno, 2000, “International Specialization and Growth”, Structural Change and Economic Dynamics,11(4):413-431.
Andersson, Martin and Olof Ejermo, 2006, “Technological Specialization and the Composition of Export Flows- An Analysis of Swedish Regions’ Trade With Europe”, Paper For the DIME Workshop on Dynamics of Knowledge
Accumulation, Competitiveness, Regional Cohesion and Economic Policies, Vienna.
Azerbaijani, Karim and Seied Komeil Taiebi and Hosein Karimi Hosnijeh, 2003, “The Most Proper Trade-Local Condition on Basis of Globalization and Integration Indices For Iranian Economy”, Iranian Economy Research,13:75-107.
Baldwin, Robert E., 2003, “Openness and Growth: What’s the Empirical Relationship?”, NBER Working Paper No.9578.
Bauer, Christian, 2008, “Trade, Productivity, and semi-endogenous Growth”, Bavarrian Graduate Program in Economics Discussion Paper, No.56.
Bensidoun, Isabelle and Guillaume Gaulier and Deniz Unal-Kesenci, 2001, “The Nature of Specialization Matters for Growth: An Empirical Investgation” CEPII Working Paper,No.13.
Bernard, Andrew B. and J. Bradford Jensen, 2001, “Exporting and Productivity: The Importance of Reallocation” Available at SSRN: http://ssrn.com/abstract=167569. Busse, Matthias and Jose L. Groizard, 2007, “Technology Trade in Economic
Development.” The World Economy, 31(4):569-592.
Castellani, David, 2001, “Export Behavior and productivity Growth : Evidence From Italian Manufacturing Firms”,Review of World Economics, 138(4):605-628. Crespo-Cauresma, Jesus and Julia Worz, 2005, “On Export Composition and Growth”,
Review of World Economics, 141(1):33-49.
Darvishi, Bagher and Heshmatullah Asgari, 2006 , “Direction of Comparitive Advantage of Some East Asian NICs and Its Comparison With Iran”, Economic Research, :263-297.
Dalum, Bent and Keld Laursen and Bart Verspagen, 1999, “ Does Specialization Matter for Growth?” Industrial and Corporate Change, 8(2):267-288.
Easterly, William R., 2001 , “The Lost Decades: Developing Countries’ Stagnation in Spite of Policy Reform 1980-1998 Dataset”, Journal of Economic Growth, 6(2):135-157..
Fagerberg, Jan, 2006, “Innovation, Technology and the global knowledge economy: Challenges for future growth.” Paper Prepared for “Green Roads to Growth” Project and Conference, Copenhagen.
Frankel, Jaffrey and David Romer, 1999, “ Does Trade Cause Growth?” The American Economic Review, 98(3):379-399.
Goh, Ai-Ting and Jacques Olivier, 2002, “Learning By Doing, Trade in Capital Goods and Growth”, Journal of International Economics, 56(2):411-444.
Grossman, Gene M. and Elhanan Helpman, 1994, “Technology and Trade”, NBER Working Paper No.4926.
Gubriel, Roman, 2002, “Impact of Innovation and Technology Transfer on Economic Growth: The Central and Eastern Europe Experience.” Available at:
www.eadi.org/fileadmin/WG_Documents/Reg_WG/gurbiel.pdf
Gustavsson, Patrik and Par Hansson and Lars Lundberg, 1996, “Technology Resource Endowments and International Competitiveness”, TSER Project: Technology, Economic Integration and Social Cohesion. Paper is available at
http://meritbbs.unimaas.nl/tser/tser.html or
http://www.merit.unimaas.nl/tser/teis003.pdf
Hansson, Gustav, 2006, “Institutions and Their Measures: A Black Box of Goodies”, Goteborg University, Working Papers in Economics No.206.
Harris, Rick and Samer Kherfi, 2000, “Productivity Growth and Trade Specialization”, Centre for The Study of Living Standards Conference on the Canada- U.S. Manufacturing Productivity Gap, Ottawa, Ontario, Janauary 21-22.
Hayashi, F., 2000, “Econometrics”, First Edition, Princeton University Press. Henisz, W. J. , 2002, "The Institutional Environment for Infrastructure Investment."
Industrial and Corporate Change, 11(2): 356-389.
Iapadre, P.Lelio, 2001, “Measuring International Specialization”, IAER,7(2):173-183. Keller, Wolfgang, 1997, “Trade and the Transmission of Technology”Journal of
Economic Growth, 7(1):5-25.
Krugman, Paul and Anthony Venables, 1993, “Integration, Specialization and Adjustment”, NBER Working Paper No.4559.
Kruman, P.R., 1986, “ A technology Gap Model of International Trade” in : K. Jungenfelt and D. Hague, eds., Structural Adjustment in Developed Open Economics, Macmillan Press, London:35-49.
Lederman, Daniel and Laura Saenz, 2005, “Innovation and Development Around the World , 1960-2000” World Bank Policy Research Working Paper 3774. Lederman, Daniel and William Maloney, 2002, “Trade Structure and Growth.”, The
World Bank, Policy Reasearch Working Paper No.3025.
Mahdavi, Abolghasem and Mehran Malekshahi, 2004, “ Evaluation of the Comparative Advantage of Petrochemical products in Iran”, Iran Economic Researches, 21:91-113.
Mehrara, Mohsen and Ali Rostami, 2006, “Iran, convergence in Global Economy and Comparative Advantages” Journal of Economic Researches, 72: 131-162. Mellati, Ali, 2008, “Uncertainty and Investment in Private Sector: An Analytical
Argument and A Review of The Economy of Iran.” PhD Thesis, Gokhale Institute of Politics and Economics, India.
Pagan, A.R. and D. Hall, 1983, “Diagnostics Tests As Residual Analysis”, Econometric Reviews 2(2): 159-218.
Rodriguez, Francisco and Dani Rodrik, 1999, “ Trade policy and Economic Growth:A Skeptic’s Guide to the cross-National Evidence.” NBER Working Paper No.W7081.
Rosenberg, Nathan, 2004, “Innovation and Economic Growth”, OECD, Available at http://www.oecd.org/dataoecd/55/49/34267902.pdf
Solow, R. M. ,1956, “A Contribution to the Theory of Economic Growth.” Quarterly Journal of Economics, 70: 65−94.
Weinhold, Diana and James E. Rauch, 1997, “ Oppenness, Specialization and Productivity growth in Less Developed Countries.” NBER Working Paper, No.6131.
World Bank, 2005, “World Development Indicators”, The World Bank.
Appendix
Australia Azerbaijan Bahrain China Indonesia Iran, Islamic
Republic of
Japan Jordan
Korea, Republic Kuwait Lao, PDR Malaysia New Zealand Oman Papua New Guinea Philippines Saudi Arabia Singapore Syria Thailand Turkey United Arab
Emirates
[image:21.595.81.520.144.731.2]Vietnam Yemen
Table 1- List of countries
Variable Definition Obs Mean Std.Dev. Min Max gdpppp2k GDP per
capita (ppp, constant
2000)
364 9235.136 7695.86 588.03 27993.17
gdppercapgrowth GDP per capita growth
(% annual)
369 2.255 5.356 -24.26 20.36 fixcapform Fix Capital
Formation (% of GDP)
336 24.697 7.382 7.64 50.81 law_order Law and
Order 351 4.191 1.289 1 6
patgrntdstk stock of accumulated
patents per capita
334 13791.37 65347.09 0 485960
abslat Absolute extent of
latitude 384 23.505 12.136 1.355 41.202
rcax0 Index of specialization
in export of food and live
animal industry
270 0.038 0.5331 -0.899 0.839
rcax2 Index of specialization
in export of crude minerals,
inedible, except fuels
270 -0.024 0.557 -0.893 0.9
rcax3 Index of specialization
in export of mineral fuels, lubricants and
related minerals
270 -0.061 0.666 -0.999 0.811
rcax7 Index of specialization
in export of machinery
and transport equipment
rcam7 Index of specialization
in import of machinery and transport
equipment
[image:22.595.86.517.105.188.2]271 -0.015 0.149 -0.5118 0.2458
Table 2 - list of definition and summary statistics of variables
|law_order abslat rcam7 rcax0 rcax2 rcax3 ---+--- law_order | 1.0000
abslat | 0.2185 1.0000
rcam7 | 0.0974 -0.4221 1.0000
rcax0 | -0.0580 0.0388 0.0908 1.0000
rcax2 | -0.0673 -0.0207 0.0066 0.7670 1.0000
rcax3 | -0.0048 -0.2247 0.1249 -0.3133 -0.2730 1.0000 rcax7 | 0.0478 -0.2324 0.2155 -0.1652 -0.1076 -0.6077
Table 3- correlation of explanatory variables in productivity regression
| y5 inv5 rcax0 rcax2 rcax3 rcax7 ---+--- y5 | 1.0000
inv5 | -0.0085 1.0000
rcax0 | -0.3458 0.0440 1.0000
rcax2 | -0.2171 -0.0195 0.7670 1.0000
rcax3 | -0.0948 -0.4134 -0.3133 -0.2730 1.0000
rcax7 | 0.2702 0.6654 -0.1652 -0.1076 -0.6077 1.0000 rcam7 | 0.1570 0.3150 0.0908 0.0066 0.1249 0.2155
Table 4- Correlation of explanatory variables in growth regression
[image:22.595.91.350.512.612.2]--- Variable | m1 m2 ---+--- patgrntdstk | .04957993*** 2.071e-06*** _cons | 8405.7246*** -.48287534*** ---+--- N | 318 226 r2 | .18976439 .16106138 --- legend: * p<0.05; ** p<0.01; *** p<0.001
2SLS regression outcome for productivity level --- a_2sls b_2sls b/se b/se --- gdpppp2k law_order 2780.201*** 2711.549*** (444.3535) (474.1251) abslat 405.1278*** 397.1031*** (85.65172) (90.63524) rcam7 -10214.22** -12492.49** (5004.106) (5377.755) rcax0 -35.48047 4226.907* (2420.644) (2471.257) rcax2 4560.93*** (1317.22) rcax3 11969.98*** 12596.4*** (3389.762) (3637.945) rcax7 24029.55*** 25659.5*** (6269.961) (6750.867) _cons 483.0134 1464.386 (2783.497) (2991.625) --- rcax7 patgrntdstk 2.02e-06*** 2.02e-06*** (3.17e-07) (3.17e-07) _cons -.4722388*** -.4722388*** (.0264361) (.0264361) --- N 213 213
r2 0.2761 0.1772 F 24.03 23.71 ---
[image:23.595.88.348.138.487.2]* p<.1, ** p<.05, *** p<.01
--- GMM_c GMM_d b/se b/se --- LD.y5 .8665561*** .8539776*** (.0225295) (.0268568) D.rcam7 .0703777*** .0168437 (.0269018) (.038914) LD.rcam7 .0761177*** (.0292465) D.rcax0 -.0358289 -.0305493 (.0236728) (.0238649) LD.rcax0 .0093343 (.0215715) D.rcax2 -.0014279 -.0015238 (.037524) (.0210356) LD.rcax2 -.0281486 (.040167) D.rcax3 -.0020565 -.0058634 (.0150218) (.0192865) LD.rcax3 .014195 (.0258588) D.rcax7 .0095511 .0389781* (.026017) (.0217355) LD.rcax7 -.0331672 (.0276291) D.inv5 .1297792*** .1358535*** (.0364092) (.0362111) --- N 114 108 --- * p<.1, ** p<.05, *** p<.01