3.1 Research Design
As mentioned previously, this quantitative research was intended to find out whether there was a significant increaseof students’vocabulary achievement at the ninth grade of SMP Muhammadiyah 1 Sendang Agung after being taught through guessing game. The researcher used the one group pretest-posttest design.
The research design is described as follows:
T1 X T2 Where:
T1: pretest T2: posttest
X : treatments (using guessing game) (Setiyadi, 2006: 131)
3.2 Subject of the Research
The subjects of this research were the students at the grade IX of SMP
Sendang Agung. Each class had the same opportunity to be chosen as the subject. In relation to the design, the researcher took one class to conduct the research as the experimental class that was class IXA. That class consists of 33 students.
3.3 Data Collecting Technique
The data of the research was the student` vocabulary achievement of sport before and after the treatments.
The instrument of the research was multiple choice tests, where the researcher gave pretest and posttest in order to evaluate, to measure the students’vocabulary achievement of sport (noun, verb, and adjective).
In collecting the data, the researcher used the following procedures:
3.3.1 Pretest
3.3.2 Treatments
After giving pretest, the students were given three treatments by using guessing games technique based on the lesson plan which was prepared. Each treatment was held for 90 minutes.
3.3.3 Posttest
The posttest was administered to the students after they got the treatments. It is done in order to know how far the students have mastered the vocabulary after being taught tough guessing game. Similar to the pretest, in the posttest the researcher also used an objective test in form of multiple choices. The questions were the same as the pretest. But, the researcher changed the order of the
questions and the distracters from those in the pretest in order that the students not only memorize or remember the order of the answer for each question but they can really understand the questions. The posttest consisted of 30 items and each item had four options of answers (A, B, C, D). The time allocation was 60
minutes. One is the correct answer and the rest are the distracters. The posttest had the same difficulty and the systems of scoring as the pretest.
3.4 Try Out Test
out the instrument of the test gained the data of the research. The test was administered for 40 items in 60 minutes with four options of answer for each.
3.4.1 Validity
A test was said valid if the instrument measured what should was measured Arikunto (1986:64). Besides, shohamy (1985:75) adds that it also examines whether the test is good representation of the material, which needs to be tested. To measure whether the test had a good validity, the researcher analyzed the test from content, construct, and face validity.
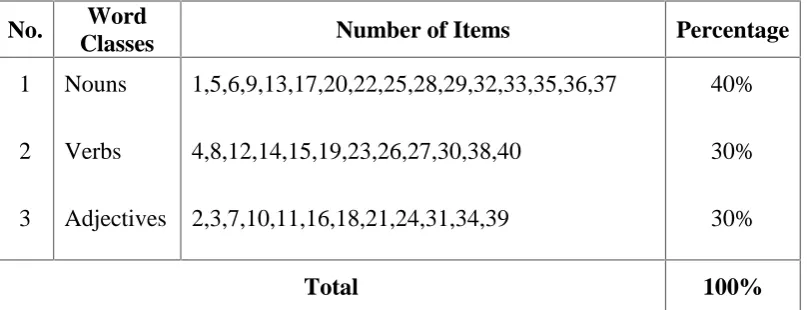
used in guessing game. The content of try out is presented in the table of specification below:
Table 1. Table of specification of try out test
No. Word
Classes Number of Items Percentage
1
2
3
Nouns
Verbs
Adjectives
1,5,6,9,13,17,20,22,25,28,29,32,33,35,36,37
4,8,12,14,15,19,23,26,27,30,38,40
2,3,7,10,11,16,18,21,24,31,34,39
40%
30%
30%
Total 100%
Construct validity was focused in the kind of the test that was used to measure the ability. It was used to the research which had many indicators. According to Setyadi (2006: 26), if the instrument just measure one aspect, for example vocabulary, the construct validity can be measured by evaluate all items in the test. If all items have measured vocabulary mastery, this instrument has fulfilled construct validity. In this research, the researcher measuredthe students’
vocabulary mastery by giving vocabulary testing in the form of multiple choices. So the test has been fulfilled the construct validity.
In this research the face validity of the vocabulary test will be checked and examined by giving questionnaire to them. The questionnaire consisted of five questions in which there were three optionsof answers, these were ‘Ya’, ‘Kurang’, and ‘Tidak’. Based on the result of the questionnaires, most teacher and students answered ‘Ya’
for question number 1 until 4. Then, for question number 5 only one of them who answered ‘Kurang’ and three others answered ‘Ya’. So that, it can be stated that the
test which was in the form of multiple choices had looked right and understandable to other testers, teachers, and students.
3.4.2 Reliability
Reliability refers to the extent to which the test is consistent in its score and gives us an indication of how accurate the test score are. (Hatch and Farhady, 1982: 244). To estimate the reliability of the test this research, split-half technique was used. To measure the coefficient of the reliability between odd and even group, this research used the Person Product Moment Formula (Arikunto, 1997:69) as follows:
2 2
Y X
XY rl
Where:
r
l : The coefficient of reliability between first half and second half groupY2 : The square of Y (Lado in Hughes, 1991:3)
Then this researcher used“Spearmen Brown’s Prophecy Formula” (Hatch and Farhady, 1982:286) to know the coefficient correlation of whole items. The formula is as follows:
rk = rl rl
1 2
Where:
rk : the reliability of the test rl : the reliability of half test
The criteria of reliability are: 0.90- 1.00 : high
0.50- 0.89 : moderate 0.0 - 0.49 : low
(Hatch and Farhady (1982: 286)
3.4.3 Level of Difficulty
In order to see the difficulty of level, researcher used the following formula:
N L U LD
Where:
LD : level of difficulty
N : the total number of the students The criteria are:
< 0.30 = difficult 0.30–0.70 = average
> 0.70 = easy
(Shohamy, 1985: 79)
3.4.4 Discrimination Power
To see the discrimination power, the researcher used the following formula:
DP = N
L U
2 1
Where:
DP : discrimination power
U : the proportion of upper group students L : the proportion of lower group students N : total number of students
The criteria are:
DP: 0.00-0.19 : Poor
DP: 0.20-0.39 : Satisfactory DP: 0.40-0.69 : Good DP: 0.70-1.00 : Excellent
1. If the value is positive discrimination a large number of more
knowledgeable students then poor students god the item in correct. If the value is zero, no discrimination.
2. If the value is negative, means that more low-students than high level students got the item correct.
3. In general, the higher the discrimination index, the better. In classroom situation most items should be higher than 0.20 indexes.
(Shohamy, 1985:81)
3.4.5 Scoring System
In scoring students result ofthe test, this research used Arikunto’s formula. The highest score was 100. The scores of pretest and posttest were calculated by using formula as follow:
100 N R S
Where:
S : The score of the test R : The right answer N : The total items (Arikunto, 1997:212)
3.5 Data Analysis
mastery. The researcher analyzedthe students’ vocabulary achievement by doing these activities:
1. Scoring the pretest and posttest
2. Tabulating the score of student’s vocabulary test results using Repeated measures T-test.
3. Drawing conclusion from the tabulated result of the pretest administering, that is statistically analyzed using SPSS (statistical Program for Social Sciences) in order to test whether increase of the students gain is significant or not.
3.6 Hypothesis Testing
The researcher used the hypothesis testing to prove whether the hypothesis proposed in this research was accepted or rejected.
The hypothesis of the research was: “There was a significant increase of students’ vocabulary achievement after being taughtthrough guessing game”
The hypothesis was statistically analyzed using Repeated measures T-test that was used to draw the conclusion in significant level of 0.05 (P<0.05) in which the hypothesis is approve if Sig<α.
H0 : There is no significant increase of students’vocabulary achievement after
being taught through guessing game.
H1 : There is a significant increase of students’ vocabulary achievement after