R E S E A R C H A R T I C L E
Open Access
Methods for high-dimensional analysis of
cells dissociated from cryopreserved
synovial tissue
Laura T. Donlin
1,2†, Deepak A. Rao
3†, Kevin Wei
3, Kamil Slowikowski
3,4, Mandy J. McGeachy
5, Jason D. Turner
6,
Nida Meednu
7, Fumitaka Mizoguchi
3, Maria Gutierrez-Arcelus
3,4, David J. Lieb
4, Joshua Keegan
3, Kaylin Muskat
8,
Joshua Hillman
8, Cristina Rozo
1, Edd Ricker
1,2, Thomas M. Eisenhaure
4, Shuqiang Li
4, Edward P. Browne
4,
Adam Chicoine
3, Danielle Sutherby
4, Akiko Noma
4, Accelerating Medicines Partnership RA/SLE Network,
Chad Nusbaum
4, Stephen Kelly
9, Alessandra B. Pernis
1,2, Lionel B. Ivashkiv
1,2, Susan M. Goodman
1,2,
William H. Robinson
10, Paul J. Utz
10, James A. Lederer
3, Ellen M. Gravallese
11, Brendan F. Boyce
7, Nir Hacohen
4,12,
Costantino Pitzalis
13, Peter K. Gregersen
14, Gary S. Firestein
8, Soumya Raychaudhuri
3, Larry W. Moreland
5,
V. Michael Holers
15, Vivian P. Bykerk
1,2, Andrew Filer
6, David L. Boyle
8, Michael B. Brenner
3and Jennifer H. Anolik
7*Abstract
Background:Detailed molecular analyses of cells from rheumatoid arthritis (RA) synovium hold promise in identifying cellular phenotypes that drive tissue pathology and joint damage. The Accelerating Medicines Partnership RA/SLE Network aims to deconstruct autoimmune pathology by examining cells within target tissues through multiple high-dimensional assays. Robust standardized protocols need to be developed before cellular phenotypes at a single cell level can be effectively compared across patient samples.
Methods:Multiple clinical sites collected cryopreserved synovial tissue fragments from arthroplasty and synovial biopsy in a 10% DMSO solution. Mechanical and enzymatic dissociation parameters were optimized for viable cell extraction and surface protein preservation for cell sorting and mass cytometry, as well as for reproducibility in RNA sequencing (RNA-seq). Cryopreserved synovial samples were collectively analyzed at a central processing site by a custom-designed and validated 35-marker mass cytometry panel. In parallel, each sample was flow sorted into fibroblast, T-cell, B-cell, and macrophage suspensions for bulk population RNA-seq and plate-based single-cell CEL-Seq2 RNA-seq.
Results:Upon dissociation, cryopreserved synovial tissue fragments yielded a high frequency of viable cells, comparable to samples undergoing immediate processing. Optimization of synovial tissue dissociation across six clinical collection sites with ~ 30 arthroplasty and ~ 20 biopsy samples yielded a consensus digestion protocol using 100μg/ml of
Liberase™TL enzyme preparation. This protocol yielded immune and stromal cell lineages with preserved surface markers and minimized variability across replicate RNA-seq transcriptomes. Mass cytometry analysis of cells from cryopreserved synovium distinguished diverse fibroblast phenotypes, distinct populations of memory B cells and antibody-secreting cells, and multiple CD4+and CD8+T-cell activation states. Bulk RNA-seq of sorted cell populations demonstrated robust separation of synovial lymphocytes, fibroblasts, and macrophages. Single-cell RNA-seq produced transcriptomes of over 1000 genes/cell, including transcripts encoding characteristic lineage markers identified.
(Continued on next page)
* Correspondence:[email protected]
†Laura T. Donlin and Deepak A. Rao contributed equally to this work. David L. Boyle, Michael B. Brenner and Jennifer H. Anolik are joint co-authors.
7University of Rochester Medical Center, Rochester, NY 14642, USA
Full list of author information is available at the end of the article
(Continued from previous page)
Conclusions:We have established a robust protocol to acquire viable cells from cryopreserved synovial tissue with intact transcriptomes and cell surface phenotypes. A centralized pipeline to generate multiple high-dimensional analyses of synovial tissue samples collected across a collaborative network was developed. Integrated analysis of such datasets from large patient cohorts may help define molecular heterogeneity within RA pathology and identify new therapeutic targets and biomarkers.
Keywords:Rheumatoid arthritis, Synovial tissue, Accelerating Medicines Partnership, RNA sequencing, CyTOF, Mass cytometry, Arthroplasty, Synovial biopsy,
Background
The destructive inflammatory environment in rheuma-toid arthritis (RA) synovium results from the activity of various cell types, including synovial fibroblasts, macro-phages, lymphocytes, osteoclasts, and vascular
endothe-lial cells [1–5]. Multiple pathways can be targeted to
treat RA, including inhibition of tumor necrosis factor (TNF) or interleukin-6 (IL-6) signaling, blockade of T-cell costimulation, depletion of B cells, and inhibition
of the JAK/STAT pathway [6]. However, despite the
advent of biologic therapies, up to ~ 2/3 of RA patients
do not achieve sustained disease remission [7], and there
are no reliable biomarkers that serve to guide selection of specific therapeutic options for the individual patient. A more comprehensive interrogation of cells present in rheumatoid synovium may identify additional pathologic pathways targetable by therapeutics and aid in stratifying patients into disease subsets and treatment response
categories based on informative biomarkers [8, 9]. Such
studies have previously been limited by the lack of methods to simultaneously recover and assay the diver-sity of cell types in the synovium and by the challenge of applying high-dimensional single cell analytics to suffi-cient numbers of patient samples. In addition, compari-sons of identical cell lineages isolated from targeted tissues in patients with RA and other diseases such as systemic lupus erythematosus (SLE) have not been performed.
In recognition of these needs, the NIH Accelerating Medicines Partnership (AMP) RA/SLE Network was assembled with the goal of generating detailed analyses of synovial tissue samples from a large number of RA patients. The RA Working Group of the AMP RA/SLE Network (or AMP RA network) has developed a pipeline to study RA synovial tissue samples through parallel high-dimensional analyses including mass cytometry, bulk RNA-seq of selected cell populations, and single cell RNA-seq. Mass cytometry can define the cellular landscape of tissues, while RNA-seq delves deeper into the gene expression profile for each cell type. When performed at scale on a large patient cohort, these assays have the potential to aid in developing personalized therapeutic approaches for RA.
To amass an RA cohort of sufficient size, numerous clinical collection sites contributed synovial tissue samples. The network set out to develop a pipeline for uniform and reproducible sample handling involving cryopreservation of intact synovial tissue samples. The frozen tissue fragments were then shipped to a central
processing site capable of performing multiple
high-dimensional analyses in parallel for each sample. The protocol was optimized for two sources of tissue: synovial biopsy obtained for research and clinically indi-cated excision during arthroplasty.
Here, we report the AMP RA network protocol for dissociation and analysis of immune and stromal cells from cryopreserved synovial tissue by multiple high-dimensional technologies. We describe a consensus protocol for synovial tissue disaggregation that results in high yields of viable
cells with preserved surface marker expression—for both
larger arthroplasty and millimeter-sized biopsy samples. We also describe an experimental pipeline to analyze each sample in parallel using single-cell RNA-seq and low-input bulk RNA-seq on selected populations, as well as mass cytometry with defined markers for synovial cells. This pipeline allows for cytometric identification and quantifica-tion of numerous immune and stromal cell populaquantifica-tions, as well as robust transcriptomic analyses of small populations of cells from pathologic synovial samples. These methods are adaptable for use in multiple sites and have been adopted and utilized by the AMP RA network.
Methods
Human patient samples
Patients with RA fulfilled the ACR 2010 Rheumatoid Arthritis classification criteria or were identified by the
participating site rheumatologist as having clinical RA [6].
A diagnosis of osteoarthritis (OA) was defined by the treating surgeon and confirmed by chart review. Synovial tissue samples were acquired by two different methods:
arthroplasty and ultrasound-guided synovial biopsy.
clinically inflamed joints under research protocols at the University of Birmingham, UK and Barts & the London School of Medicine and Dentistry, UK. The study received institutional review board approval at each site.
Arthroplasty synovial tissue collection
Synovial tissue excised as standard of care during arthro-plasty was transported from the operating room to a laboratory in ice-cold PBS. The tissue was identified as synovium by characteristic features: a fibrous or elastic tissue, pink or reddish in appearance. Small fragments
(~ 1–2 mm3) were generated by dissecting with forceps
or surgical scissors. Six fragments (~ 150 mg total) across the tissue were randomly combined to make
indi-vidual aliquots [10,11].
Synovial biopsy procedures
Synovial biopsy samples were obtained under ultrasound guidance by an experienced interventionist using either a needle biopsy or portal and forceps. For needle biopsy pro-cedures, a 14G or 16G spring-loaded Cook Quick-Core®
Bi-opsy needle was used to obtain multiple fragments [12,13].
For the portal-based approach, a portal (Merit Medical Prelude 7F) was initially inserted into the synovial cavity with multiple samples and then retrieved using flexible
2.0–2.2 mm forceps [14, 15]. Six biopsy fragments were
randomly allocated per aliquot.
Synovial tissue cryopreservation and thawing
Synovial tissues were either (1) disaggregated immediately followed by cryopreservation of dissociated cells or (2) cut into fragments that were cryopreserved for subsequent disaggregation at a central processing site. Dissociated synovial cells were resuspended in CryoStor® CS10 (Bio-Life Solutions) at ~ 2 million cells/ml to viably freeze them. Intact synovial tissue samples were divided into fragments as already described and transferred to a cryo-vial (1.5 ml; Nalgene) containing 1 ml of CryoStor® CS10 for viable freezing. Cryovials were then placed in an insu-lated container with isopropanol in the bottom chamber for slow freezing (Mr. Frosty; Nalgene), which comprised
incubation at 4 °C for 10 min followed by 1 day at−80 °C.
The samples were then either shipped on dry ice or trans-ferred into liquid nitrogen for long-term storage.
Synovial fragments were thawed by rapidly warming the cryovial in a 37 °C water bath. The preservation media was
filtered out through a 70-μm strainer. The tissue was then
rinsed through a series of incubations in a six-well culture plate: 10 min in 10% FBS/RPMI at room temperature with intermittent swirling, a quick rinse in 10% FBS/RPMI, and a final rinse in serum-free RPMI. Frozen synovial cells were thawed rapidly in a 37 °C water bath and transferred into 20 ml of 10% FBS/RPMI, centrifuged to pellet cells, and then resuspended in media for downstream analyses.
Dissociation of synovial tissue
Both arthroplasty and synovial biopsy samples were dissociated by a combination of enzymatic digestion and mechanical disruption with various test conditions de-scribed in Results. The final consensus AMP RA
net-work enzyme digestion uses RPMI media with Liberase™
TL enzyme preparations (100μg/ml; Roche) and DNase
I (100μg/ml; Roche).
Arthroplasty tissue
To achieve consistent mechanical disruption and proteo-lytic enzyme exposure across a fragment of tissue, large synovial specimens (> 150 mg) were cut into small
fragments (~ 2 mm3) using surgical scissors. Mechanical
disruption of arthroplasty samples (six tissue fragments
totaling≥500 mg) was carried out by a gentleMACS
disso-ciator system (Miltenyi) with the m_Spleen 04.01 setting, which involves churning and shredding in a sterile dispos-able tube. Enzymatic digestion was performed in RPMI medium at 37 °C for 30 min. A large volume of 5% FBS/ RPMI was then added to terminate the enzymatic reaction.
The tissue was ground through a 70-μm filter using the flat
plastic end of a 3-ml syringe plunger to disperse the remaining intact tissue and dispense dissociated cells.
Synovial biopsy tissue
For the samples obtained by synovial biopsy, tissue
frag-ments were minced into small fragfrag-ments (~1 mm3) using
a scalpel. Samples were then subjected to enzymatic diges-tion at 37 °C while being exposed to continuous stirring in
a U-bottom polystyrene tube (12 × 75 mm2) with a
mag-netic stir bar for 30 min. Halfway through the enzymatic digestion, samples were passed gently through a 16G syr-inge needle 10 times for additional mechanical disruption.
RNA extraction from whole synovial tissue fragments
For samples used in the aforementioned dissociation protocol, synovial tissue fragments were also preserved for whole tissue RNA extraction. Three whole tissue replicates were collected for each sample, with six fragments placed into a cryovial containing 1 ml of RNALater (Qiagen) and inverted three times. The cryovials were incubated overnight at 4 °C. The next day, the cryovials were spun at
~ 1000×gfor 30 s and most of the RNALater was removed,
leaving only enough RNALater to cover the tissue. The
cryovials were then placed in storage at−70 °C. For RNA
extraction, samples were thawed and fragments transferred
into RLT lysis buffer (Qiagen) + 1% β-mercaptoethanol
(Sigma) and homogenized using a TissueLyser II (Qiagen) before RNA isolation using RNeasy columns.
Flow cytometry cell sorting
and leukocyte populations. Antibodies included anti-CD 45-FITC (HI30), anti-CD90-PE(5E10), anti-podoplanin-PerCP/eFluor710 (NZ1.3), anti-CD3-PECy7 (UCHT1), anti-CD19-BV421 (HIB19), anti-CD14-BV510 (M5E2),
anti-CD34-BV605 (4H11), anti-CD4-BV650 (RPA-T4),
anti-CD8-BV711 (SK1), anti-CD31-AlexaFluor700 (WM59), anti-CD27-APC (M-T271), anti-CD235a-APC/AF750, TruS-tain FcX, and propidium iodide. Cells were sTruS-tained in HEPES-buffered saline (20 mM HEPES, 137 mM NaCl, 3 mM KCl, 1 mM CaCl2) with 1% bovine serum albumin (BSA) for 30 min, then washed once, resuspended in the same buffer with propidium iodide added, vortexed briefly,
and passed through a 100-μm filter.
Cells were sorted on a three-laser BD FACSAria Fusion cell sorter. Intact cells were gated according to FSC-A and SSC-A. Doublets were excluded by serial FSC-H/FSC-W and SSC-H/SSC-W gates. Nonviable cells were excluded based on propidium iodide uptake. Cells were sorted
through a 100-μm nozzle at 20 psi.
A serial sorting strategy was used to sequentially capture cells for bulk RNA-seq and then single-cell RNA-seq if sufficient numbers of cells were present. First, 1000 cells of the targeted cell type were sorted for low-input
RNA-seq into a 1.7-ml Eppendorf tube containing 350μl
of RLT lysis buffer (Qiagen) + 1% β-mercaptoethanol.
Once 1000 cells of a particular cell type were collected, the sort was stopped and the tube was exchanged for a second tube containing FACS buffer. Sorting was then re-sumed and the rest of the cells of that type were collected into the second tube as viable cells. This process was carried out for four targeted populations. Live cells of each population that were sorted into FACS buffer were then resorted as single cells into wells of 384-well plates
containing 1μl of 1% NP-40, targeting up to 144 cells of
each type per sample.
RNA sequencing on low-input bulk populations
RNA from sorted bulk cell populations was isolated using RNeasy columns (Qiagen). RNA from up to 1000 cells was treated with DNase I (New England Biolabs), and then concentrated using Agencourt RNAClean XP beads (Beckman Coulter). Full-length cDNA and sequencing libraries were prepared using the Smart-Seq2 protocol as
described previously [16]. Libraries were sequenced on a
MiSeq (Illumina) to generate 25-base-pair, paired-end reads totaling a fragment length of 50 base pairs.
Single-cell RNA sequencing
Single cell RNAseq (scRNA-Seq) was performed using the
CEL-Seq2 method [17] with the following modifications.
Single cells were sorted into 384-well plates containing
0.6μl of 1% NP-40 buffer in each well. Then, 0.6μl dNTPs
(10 mM each; NEB) and 5 nl of barcoded reverse
transcription primer (1 μg/μl) were added to each well
along with 20 nl of ERCC spike-in (diluted 1:800,000). Reactions were incubated at 65 °C for 5 min, and then moved immediately to ice. Reverse transcription reactions
were carried out as described previously [17] and cDNA
was purified using 0.8× volumes of AMPure XP beads (Beckman Coulter). In-vitro transcription reactions (IVT) were performed as described followed by EXO-SAP treat-ment. Amplified RNA (aRNA) was fragmented at 80 °C for 3 min and purified using RNAClean XP beads (Beck-man Coulter). The purified aRNA was converted to cDNA using an anchored random primer and Illumina adaptor sequences were added by PCR. The final cDNA library was purified using AMPure XP beads (Beckman Coulter). Libraries were sequenced on a Hiseq 2500 (Illumina) in Rapid Run Mode to generate paired-end reads. Forward reads (35 nt) were mapped to human reference genome
hg19 using STAR v2.5 [18], while reverse reads (15 nt)
in-cluded cellular and molecular barcodes (6 nt each). Basic analyses of single-cell RNA-seq data, including quantifica-tion of genes detected per cell, filtering of cells with less than 1000 detected genes, and principal components
ana-lyses, were performed using RSEM [19].
Differential expression
To examine differential gene expression profiles between RA and OA synovial tissues processed through the consen-sus disaggregation protocol, tissue samples were collected from 10 RA patients and 10 OA patients. From these 20
patients, 2–8 replicates were generated per donor for a total
of 87 samples. We performed differential expression ana-lysis by fitting a linear mixed model to each gene, in which we controlled for unwanted technical variation with donor and site as random effects.
Gene Ontology term enrichment analysis
We tested Gene Ontology (GO) enrichment with differen-tially expressed genes. We used Ensembl gene IDs down-loaded in April 2016, including 9797 GO terms and 15,693 genes. The minimal hypergeometric test was used to test
for significance [20].
Mass cytometry
Synovial cells were resuspended in PBS/1%BSA with primary antibody cocktails at 1:100 dilution for 30 min
(Additional file1: Table S1). All antibodies were obtained
paraformaldehyde for 10 min and stored overnight in PBS/1%BSA. The following day, cells were incubated with
MaxPar Intercalator-Ir 500μM 1:4000 in PBS for 20 min,
and then washed twice with MilliQ water, filtered, and an-alyzed on a Helios instrument (Fluidigm). Mass cytometry
data were normalized using EQ™ Four Element
Calibra-tion Beads (Fluidigm) as described previously [21]. viSNE
analysis was performed using the Barnes-Hut SNE
imple-mentation on Cytobank (www.cytobank.org). Gated live
cells (DNA-positive, cisplatin-negative) were analyzed using all available protein markers. Biaxial gating was per-formed using FlowJo 10.0.7.
Results
Synovial tissue dissociation: optimizing cell yield and surface marker preservation
Laboratories within the AMP RA network (Fig. 1a)
ini-tially set out to collectively establish a standard operating procedure for isolating cells of differing lineages from synovial tissue. This protocol required balancing rigorous dissociation of stromal cells that adhere tightly to the tissue matrix, while minimizing perturbations and main-taining viability, RNA stability, and key surface proteins required for downstream isolation and assays. In addition, methods were needed to handle both large arthroplasty
samples and small synovial biopsy samples (Fig.1b).
Selection of methods for mechanical disruption
Pilot experiments across several sites suggested that vari-ous forms of mechanical disruption could be used, including manual inversion of the tube or incubation in a Stomacher® 400 circulator. Dissociation using the gentleMACS was selected for arthroplasty as this method provided an automated and standardized proto-col that could be implemented across laboratories
(Fig. 1c). However, dissociation of small synovial biopsy
fragments (~ 0.5–1 mm3) using the gentleMACS system
generated variable and insufficient yields, possibly due to cell retention in the dissociation container. Therefore, synovial biopsy samples were subjected to mechanical disruption by continuous magnetic stirring, combined with trituration through a syringe needle.
Enzymatic dissociation combined with mechanical disruption generates high cell yields
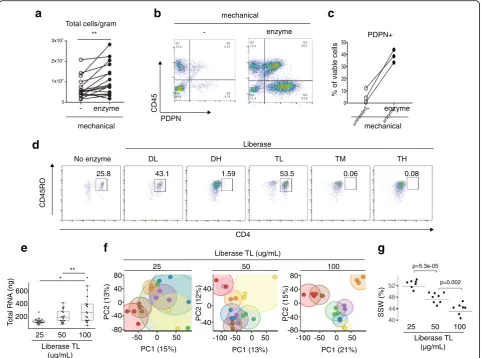
To test the impact of combining enzymatic treatment with mechanical dissociation, proteolytic enzymes were added to the media during mechanical dissociation. For the majority of tissue samples, higher cell yields were obtained when synovial fragments were incubated with enzyme in
addition to mechanical disruption (Fig. 2a). Importantly
for highly adherent stromal (PDPN+CD45–) lineages, the
proportion recovered increased with enzymatic digestion
(Fig.2b, c).
Proteolytic enzyme preparations differ in surface marker preservation
Focusing on highly purified enzyme formulations designed for standardized protocols, the consortium tested
Liber-ase™ mixtures containing thermolysin (T) or dispase (D)
in combination with collagenase. As proteolytic enzymes
can cleave cell surface proteins [22, 23], we tested the
enzyme panel to identify a formulation that preserved important cell surface proteins such as CD3 and CD4. Certain formulations compromised the detection of cell
surface proteins. For example, on CD3+ T cells isolated
from synovium, a decline in CD4 surface detection was
observed with Liberase™ Dispase-High (DH),
Thermolysin-Medium (TM), and Thermolysin-High (TH) compared to no enzyme treatment or Thermolysin-Low
(TL) and Dispase-Low (DL) (Fig.2d). As peripheral blood
mononuclear cell preparations with equal numbers of circulating T cells resulted in a similar pattern of loss in CD4 detection when treated with the enzymes, the decline in CD4 levels in the synovial preparations is likely due to direct degradation of the cell surface protein by proteases
rather than a selective reduction in extracting CD4+ T
subsets (Additional file 1: Figure S1a). As Liberase™ TL
versus TM mixtures proved equally efficient at dissociat-ing out both stromal and hematopoietic cells (Additional
file1: Figure S1b), Liberase™TL was chosen for both high
cell yields and preservation of cell surface markers for downstream analyses, including mass cytometry.
Optimization of proteolytic enzyme concentrations
To determine the optimal concentration of proteolytic enzyme for consistent cell recovery and reproducibility of
downstream assays, four network sites processed
arthroplasty samples using three different Liberase™ TL
concentrations, with three technical replicates for each
con-centration. In comparison to the 25 and 50μg/ml
concen-trations, the 100 μg/ml concentration yielded the highest
amount of intact RNA after tissue dissociation (Fig.2e). In
addition, synovial samples processed with 100 μg/ml
enzyme concentration demonstrated the lowest variance in RNA-seq gene expression across replicate samples, visually depicted in the principal component analysis (PCA) plots where distance between replicates is minimized with the
100 μg/ml concentration (Fig. 2f). Next, we computed the
sum of squares within (SSW) to quantify replicate similar-ities within each of the three enzyme concentrations. Here,
we also observed that replicates processed with 100μg/ml
had the least variation (Fig.2g).
To gain insight into the source of gene expression ation across synovial samples, we applied analysis of vari-ance (ANOVA) to each principal component to assess the contribution of the following sources: site, donor, and the potential impact of the dissociation process (Additional
variation associated with donor differences (PC1 and PC2), which encompasses biological differences such as disease state. Site-specific collection and/or processing differences also contributed variation (PC1). Of note, the AMP Network has designated a central processing site to eliminate site-specific dissociation effects.
Sample variability in PC3 and PC6 also related to gene expression differences that were identified in a separate RNAseq analysis comparing whole versus dissociated
synovial preparations (Additional file 1: Figure S1c–e).
The analysis comparing dissociated versus whole tis-sue RNAseq was intended to identify dissociation-induced effects, but involved mixtures of various cell types and,
correspondingly, much of the gene expression differences indicated cell composition differences. These differences likely relate to differences in the preparation protocols; for example, adipocytes escape during spinning and aspiration steps in the dissociation protocol, while red blood cells may inadvertently be removed in whole tissue prepara-tions during a salt solution incubation and subsequent as-piration. Nonetheless, outside of cell type-specific genes, there was an increase in stress response genes in dissoci-ated cell preparations, similar to a previous report on
dissociation-induced effects in single cells [24]. This
in-cluded an upregulation in heat shock protein genes (HSP1A1, HSP6A, HSP90AA) and early response genes
mass cytometry (CyTOF)
Fibroblasts T cells
B cells Macrophages
Fibroblasts T cells
B cells Macrophages
sorted single cell RNA-seq CEL-Seq2 low-input bulk RNA-seq
Smart-Seq2
Dissociated synovial cells Arthroplasty
Biopsy
150-6000mg <150mg
GentleMACS rapid stirring + trituration with syringe Fragments frozen
in CryoStor
cut to 2mm3
Mechanical + enzymatic dissociation
Dissociated synovial cells
50,000 - 200,000 cells Flow cytometry
Cell sorting
Clinical collection sites Central processing site
Up to 1000 cells per cell type
a
AMPsynovial tissue collectionClinical collection sites
Central processing site
b
c
[image:6.595.57.537.88.487.2](FOS,JUN,ATF3) (Additional file1: Figure S1d, e). Thus, synovial cells demonstrating specific upregulation in this signature could indicate a dissociation-induced gene expres-sion pattern rather than a cell subset-specific program. For subsequent single-cell RNAseq studies, individual synovial cells with high levels of this stress response could either be removed from the analyses or the signature could be ad-justed for computationally.
Overall, these results suggest that dissociation with
100μg/ml Liberase™TL produces consistent and robust
recovery of diverse synovial stromal and immune cell populations with the largest source of variation in the samples due to donor biological differences.
Development of cryopreservation methods
Having established synovial dissociation methods, we then focused on establishing a strategy to analyze samples ac-quired at distant sites through a uniform high-dimensional analysis pipeline. We first evaluated the feasibility of study-ing synovial cells cryopreserved after tissue dissociation.
untreated enzyme 0
10 20 30 40 50
CD45RO
d
mechanical
No enzyme DL DH TL TM TH
Liberase
CD4
25.8 43.1 1.59 53.5 0.06 0.08
** Total cells/gram
- enzyme
e
f
g
- enzyme
mechanical
CD45
PDPN 0
3x10⁷
2x10⁷
1x10⁷
80
40
0
-40
-80
40
0
-40
80
40
0
-40
-80
PC2 (13%)
PC1 (15%)
PC2 (12%)
PC1 (13%)
PC2 (15%)
PC1 (21%) -100 -50 0 50 -100 -50 0 50
-50 0 50
25 50 100
a
b
c
Liberase TL (ug/mL)
** *
25 50 100
Liberase TL (ug/mL)
)
g
n(
A
N
R
l
at
o
T200 400 600
- enzyme
sll
e
c
el
b
ai
v
f
o
%
PDPN+
mechanical
Liberase TL (µg/mL)
)
%(
W
S
S
p=0.002 p=5.3e-05
25 50 100
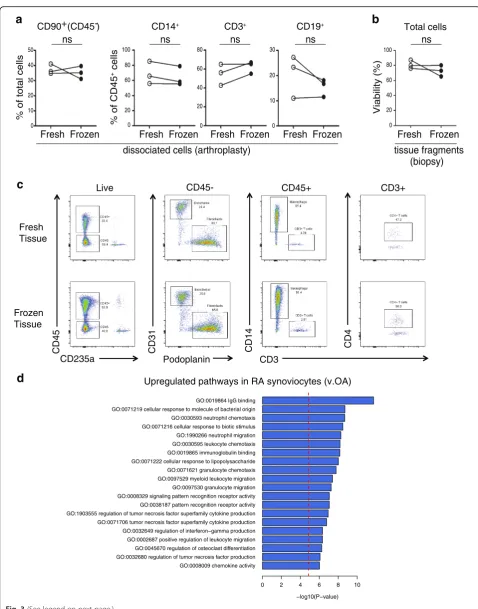
[image:7.595.58.540.88.446.2]From three different arthroplasty samples analyzed either immediately after dissociation (fresh) or after freezing the cells in a cryopreservation solution for at least 1 day, comparable cell frequencies were extracted for synovial
fibroblasts, monocytes, T cells, and B cells (Fig. 3a). This
result, although based on only three samples, suggested that synovial cells generally survive cryopreservation well,
con-sistent with prior studies [5,25,26].
In addition to cryopreserving dissociated synovial cells, we next evaluated the feasibility of cryopreserving intact synovial tissue fragments prior to dissociation. Notably, three synovial biopsy tissues processed after cryopreser-vation yielded cells with comparable viability to paired
tissue analyzed immediately after isolation (Fig. 3b). In
addition, flow cytometric analysis of cells from cryopre-served synovial tissue showed robust detection of stro-mal and hematopoietic cell populations, similar to fresh
synovial tissue (Fig.3c). These results indicate that intact
synovial tissue can be cryopreserved for subsequent cel-lular analyses.
We next examined whether application of the protocol
implementing 100 μg/ml of Liberase™ TL, mechanical
disaggregation, and viable freezing could detect robust ex-pression pattern differences between dissociated synovial cells from tissues from patients with RA and osteoarthritis (OA). Importantly, an RNA-seq analysis of disaggregated total synovial cells demonstrated an upregulation in RA of genes involved in immune processes, such as immuno-globulin binding, cellular response to molecules of bacter-ial origin, leukocyte chemotaxis and migration, cytokine production, and antigen processing and presentation by
MHC class II (Fig.3d).
High-dimensional assays of synovial cells
A goal of the AMP Network is to generate both mass cytometry and RNA-seq analyses of cells from cryopre-served synovial samples dissociated by the protocol described earlier. Acquisition of data for both of these technologies from the same synovial sample allows the coupling of detailed quantification of cell populations
with genome-wide transcriptomic analyses. These
combined analyses enable interrogation of correlations between cell populations and transcriptomic signatures with unprecedented resolution for a human autoimmune disease tissue target. Because synovial samples vary widely in both cell yield and composition, we developed an algorithm to allocate cells for different analyses in a step-wise fashion without prior knowledge of the cell
composition (Fig.1c). Preliminary experiments indicated
that reproducible mass cytometry analyses could be obtained from 100,000 synovial cells; therefore, for samples that yielded over 200,000 synovial cells, approxi-mately half of the cells were allocated to mass cytometry, with the rest were used for sequential low-input and
single-cell RNA-seq analyses. When less than 200,000 synovial cells were obtained, mass cytometric analysis was omitted and only RNA-seq analyses were performed.
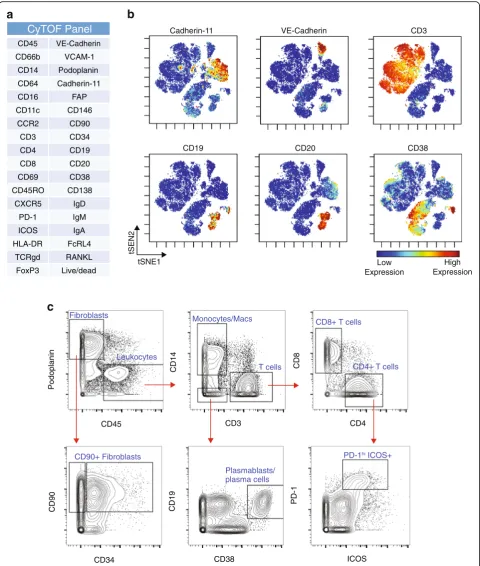
Mass cytometry of synovial cells
A 35-parameter mass cytometry panel was developed to identify stromal, vascular, and immune cells within
syn-ovial samples (Fig.4a). Visualization of the mass
cytome-try data obtained from a cryopreserved synovial biopsy
sample using the dimensional reduction tool viSNE [27]
revealed clear discrimination of synovial fibroblasts
(cad-herin-11+), endothelial cells (VE-cadherin+), and immune
cell subsets from cryopreserved RA synovial tissue
(Fig.4b). viSNE visualization highlighted the heterogeneity
within immune cell populations, which was confirmed by biaxial gating. For example, two populations of B cells
were easily resolved, including one CD19+CD20+
popula-tion and a distinct CD19+CD20–CD38hipopulation
com-prised of antibody-secreting cells (Fig. 4b, c) [28, 29].
Marked heterogeneity within the CD3+ T-cell population
was also evident, with multiple lobes of T cells visualized,
including a subset of PD-1hiICOS+CD4+T cells (Fig.4b, c)
[5]. This visualization also demonstrated heterogeneity
among the podoplanin+ synovial fibroblasts, including
fibroblast subpopulations that express CD90 and/or CD34
[25, 26]. These results indicate that high-resolution mass
cytometry data can be obtained from synovial cells collected from cryopreserved intact synovial tissue that is subsequently thawed and dissociated.
RNA-seq transcriptomics of synovial cell populations and single cells
In addition to mass cytometry analyses, a major goal of the AMP Network is to define molecular signatures and pathways of disease by transcriptome analysis. Low-input RNA-seq provided robust gene expression values for a large number of protein coding genes averaged across approximately 1000 cells. The complementary single-cell RNA-seq approach provided a high-resolution view of the heterogeneity of expression profiles between individual cells. We designed a cell sorting workflow that prioritized collecting cells for low-input RNA-seq, with a goal of col-lecting 1000 cells from each of the four targeted cell types. If more than 1000 cells of a targeted cell type were avail-able, the remaining cells were sorted into a second collec-tion tube for subsequent single-cell RNA-seq analysis
(Fig.1c). This sorting scheme enabled capture of virtually
all of the cells for each of the four target populations for low-input and single-cell RNA-seq.
Synovial cells were stained with a multidimensional flow cytometry panel that could identify diverse cell populations
including fibroblasts (CD45–podoplanin+CD31−),
endothelial cells (CD45−podoplanin−CD31+), macrophages
Fresh Frozen
0 20 60 80
40
Fresh Frozen
0 40
20 60 100
80
0 20
10 30 50
40
Fresh Frozen
a
b
% of total cells
tissue fragments (biopsy)
Viabilit
y(
%)
% of CD45
+ cells
dissociated cells (arthroplasty)
Fresh Frozen
0 10 20 30
0 40
20 60 100
80
Fresh Frozen ns ns
ns ns ns
CD90+ (CD45-) CD14+ CD3+ CD19+
CD31 CD14 CD4
Podoplanin CD3
CD45- CD45+ CD3+
Frozen Tissue Fresh Tissue
CD45
CD235a Live
c
Total cells
d
Upregulated pathways in RA synoviocytes (v.OA)GO:0008009 chemokine activity GO:0032680 regulation of tumor necrosis factor production GO:0045670 regulation of osteoclast differentiation GO:0002687 positive regulation of leukocyte migration GO:0032649 regulation of interferon−gamma production GO:0071706 tumor necrosis factor superfamily cytokine production GO:1903555 regulation of tumor necrosis factor superfamily cytokine production GO:0038187 pattern recognition receptor activity GO:0008329 signaling pattern recognition receptor activity GO:0097530 granulocyte migration GO:0097529 myeloid leukocyte migration GO:0071621 granulocyte chemotaxis GO:0071222 cellular response to lipopolysaccharide GO:0019865 immunoglobulin binding GO:0030595 leukocyte chemotaxis GO:1990266 neutrophil migration GO:0071216 cellular response to biotic stimulus GO:0030593 neutrophil chemotaxis GO:0071219 cellular response to molecule of bacterial origin GO:0019864 IgG binding
−log10(P−value)
0 2 4 6 8 10
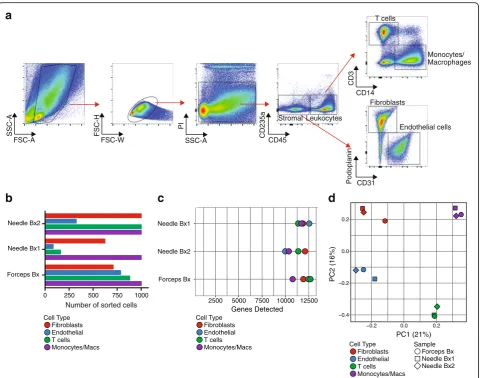
[image:9.595.57.536.82.692.2](Fig.5a). Low-input RNA-seq analysis of fibroblasts, macro-phages, endothelial cells, and T cells sorted from three cryopreserved RA synovial biopsy samples yielded
tran-scriptomes with 8000–13,000 genes detected from cell
in-puts ranging from 1000 cells down to 83 cells (Fig.5a, b).
Principal components analysis robustly distinguished the different cell types at the global transcriptomic level
(Fig. 5c). These results indicate that cells obtained from
cryopreserved biopsies yield transcriptomes that reflect the expected cell identity.
Transcriptomes of single cells sorted from cryopre-served RA synovium were obtained by RNA-seq through the CEL-Seq2 platform. High-quality transcriptomes from both single-cell fibroblasts and leukocytes from RA syno-vium were generated, with fibroblasts generally yielding
higher gene counts (Fig. 6a). Principal components
ana-lysis of single cells from an RA synovial sample separated the fibroblasts from the immune cells along PC1, and mostly separated macrophages from T and B lymphocytes
along PC2 (Fig. 6b). Importantly, single cells from each
sorted cell population expressed markers expected for that
cell type. For example, the podoplanin transcript was
expressed primarily in fibroblasts, consistent with flow
cytometry and mass cytometry data, while theCD14
tran-script was identified in sorted macrophages, an expected finding since the cells were flow sorted by CD14 protein
expression (Fig. 6c). Similarly, the CD3E transcript was
uniquely detected in sorted T cells, whileCD79A
expres-sion was unique to sorted B cells. These results indicate that high-quality transcriptomes can be generated from bulk populations and single cells obtained from cryopre-served RA synovial tissue samples.
Discussion
Here we describe the development of an experimental
pipeline to analyze synovial tissue with multiple
high-dimensional technologies, aimed at deconstructing the cellular and molecular features of RA. This standard-ized and validated strategy enables single-cell analytics on large sample numbers collected from numerous clinical sites.
The integration of contemporary high-dimensional assays provides the opportunity to dissect the properties of tissues affected by rheumatic disease with a resolution not previously possible. Histologic and immunohisto-chemical assessments of synovium have revealed marked
heterogeneity in RA synovial pathology [13,30]. Gene
ex-pression analyses of synovium by microarray have added gene expression signatures to these histologic patterns [31–34]. However, broad analyses of gene expression in synovium have thus far been limited mainly to assess-ments of whole tissue, which cannot distinguish which cell
types express the relevant genes [31,35–38]. The analysis
pipeline described here enables simultaneous quantifica-tion of a wide range of stromal and leukocyte subpopula-tions by mass cytometry, paired with genome-wide transcriptional analyses, both of targeted cell populations and of single cells. Mass cytometry alone provides a powerful, broad assessment of the cell types and phenotypes within the tissue on a relatively large number
of cells [5]. Transcriptomic analyses of sorted
subpopula-tions can identify the cell types contributing specific gene expression signatures derived in the synovium, including signatures specific to RA synovium. Single-cell tran-scriptomics allow a high-powered characterization of the
heterogeneity of cells across a tissue [39] and within cell
subsets that were previously classified as the same cell
type [25,26,40]. We propose that integrating the multiple
high-dimensional datasets acquired with this pipeline will reveal how distinct cell types relate to specific aspects of RA pathology. Applied to a large patient cohort, these analyses have the potential to reveal functional pathologic markers that distinguish patients with distinct clinical
trajectories and therapeutic responses [5].
Implementing these technologies requires robust tissue processing protocols. The validation studies described here, which were carried out by a collaboration among laboratories with expertise in synovial tissue and RA, provide a widely applicable, reproducible method for obtaining single cells from RA synovium that performs well in cytometric and transcriptomic analyses. Classically, synovial tissue has been disaggregated by crude collage-nase preparations, which often cleave cell surface proteins and may contain bacterial products that stimulate im-mune cells. Here, varied concentrations of highly purified proteolytic enzyme preparations were assessed for preser-vation of vulnerable cell surface proteins required for downstream assays, as well as cell viability, RNA integrity, and applicability to next-generation sequencing. Combin-ing limited enzyme incubation time with mechanical dis-aggregation yielded viable cell populations from disparate lineages that performed well in downstream assays. It is
(See figure on previous page.)
Fig. 3Cryopreservation of synovial fragments retains stromal and hematopoietic cell viability and RA synovial gene expression patterns.a
Cadherin-11 VE-Cadherin CD3
CD19 CD20 CD38
Low Expression
High Expression
tSEN2
tSNE1
CyTOF Panel
CD45 VE-Cadherin
CD66b VCAM-1
CD14 Podoplanin
CD64 Cadherin-11
CD16 FAP
CD11c CD146
CCR2 CD90
CD3 CD34
CD4 CD19
CD8 CD20
CD69 CD38
CD45RO CD138
CXCR5 IgD
PD-1 IgM
ICOS IgA
HLA-DR FcRL4
TCRgd RANKL
FoxP3 Live/dead
CD8
CD14
Podoplanin
CD19
CD90
Monocytes/Macs
T cells
CD8+ T cells
CD4+ T cells Leukocytes
Fibroblasts
Plasmablasts/ plasma cells CD90+ Fibroblasts
a
b
c
PD-1hi ICOS+
PD-1
CD38 CD34
CD4 CD3
CD45
ICOS
Fig. 4Mass cytometry analysis of dissociated synovial tissue reveals synovial cell heterogeneity via surface marker detection.aAntibody marker panel for synovial cell mass cytometry analysis.bviSNE visualization of synovial cells analyzed by mass cytometry from cryopreserved synovial biopsy sample obtained from knee of an RA patient. Each dot is a cell. Color reflects level of expression of marker indicated at top of plot.c
[image:11.595.58.539.87.654.2]important to recognize that dissociating tissues into cell
suspensions may introduce processing signatures [24].
However, differences in transcriptome between intact and dissociated tissue may arise from a number of sources. These may include better representation of genes from cells difficult to extract in the intact tissue samples, in addition to potentially adverse consequences such as a cellular response to tissue manipulation. Importantly, with the synovial tissue disaggregation protocols developed here, mass cytometry of the single cells obtained clearly identified multiple expected cell populations in striking detail. RNA-seq transcriptomic analyses also robustly distinguished cells of different types at both the low-input and single-cell level. Further, transcriptomic analysis of synovial cells identified RA-specific gene signatures even in the relatively small sample set presented with the
largest source of variation in the transcriptome due to donor biological differences. While dissociation-induced gene signatures are identifiable, they can be adjusted for computationally if necessary. Taken together, these obser-vations strongly argue for the potential of this approach to discover new aspects of RA cellular pathology, which can be further validated in intact tissues.
The ability to effectively cryopreserve synovial tissue marks a major technical advance for synovial research. The viability and flow cytometric phenotypes of cells from cryopreserved synovial tissue samples were comparable to those from freshly processed tissues. Cells obtained from cryopreserved tissue samples were largely viable and readily used for all of the mass cytometric and RNA-seq analyses presented in this report. Cryopreservation of intact synovial tissue provides a simple, rapid technique to
Sample Forceps Bx Needle Bx1 Needle Bx2 Forceps Bx
Needle Bx2 Needle Bx1
2500 5000 7500 10000 12500
Genes Detected
Cell Type Fibroblasts Endothelial T cells Monocytes/Macs
0 250 500 750 1000
Needle Bx1 Needle Bx2
Forceps Bx
a
b
c
d
SSC-A
FSC-A
CD3
CD14
FSC-H
FSC-W
PI
SSC-A CD235a CD45
Podoplanin CD31 Stromal Leukocytes
T cells
Monocytes/ Macrophages
Fibroblasts
Endothelial cells
Cell Type Fibroblasts Endothelial T cells
Monocytes/Macs Cell Type
Fibroblasts
T cells 0.4 0.2 0.0 0.2
0.2 0.0 0.2
PC1 (21%)
PC2 (16%)
Endothelial
Monocytes/Macs
Number of sorted cells
Fig. 5Low-input RNA-seq distinguishes cell populations sorted from dissociated RA synovial cells.aFlow cytometric detection of distinct cell populations obtained from cryopreserved RA synovial biopsy.bNumber of cells of each targeted cell populations sorted from three different RA patient synovial biopsy (Bx) samples (two obtained by needle biopsy and one by portal and forceps biopsy from knee joint) for low-input RNA-seq.
[image:12.595.59.541.86.464.2]preserve and transport affected tissues for cellular studies in a multisite consortium. Tissue fragment cryopreserva-tion enables sample colleccryopreserva-tion from numerous clinical sites, including those lacking the resources for tissue dissociation. This approach also eliminates site-specific processing effects, allowing samples to be processed at a central site that possesses multiple high-dimensional technologies, and to utilize batch processing of samples to minimize technical variation and confounding effects. While it remains to be determined how long cryopre-served synovial tissue can be stored, samples have been routinely stored in liquid nitrogen for several months, and a small number of samples have been analyzed over 1 year after freezing without obvious decreases in cell yield.
In an ongoing phase I study, the AMP RA Network has implemented this synovial tissue pipeline to study cryo-preserved synovial samples from a pilot cohort of over 40 RA and OA patients with the goal of defining RA disease-specific cellular populations and pathways. Greater than half of the synovial samples processed yielded suffi-cient cells for both mass cytometry and RNA-seq analyses,
with cell viabilities comparable to those reported here. Analysis of cells from these phase I samples is in progress.
The phase I pilot study will be followed by a phase II study involving a much larger cohort of RA patients, including those with early disease, with a focus on identi-fying RA tissue biomarkers and novel tissue drug targets. A similar strategy of tissue cryopreservation has been adopted by the AMP for single-cell transcriptomic analyses of kidney biopsy samples from patients with lupus nephritis, including development of a dissociation
protocol optimized for human kidney tissue [41].
Al-though different tissues and cellular subsets may respond to cryopreservation differently, the strategy of analyzing cells from cryopreserved tissue appears readily adaptable to multicenter studies of tissues in other inflammatory diseases.
Conclusions
These studies demonstrate the feasibility and potential of analyzing viable cells from cryopreserved synovial tissue samples by multiple, complementary high-dimensional analyses. Using an optimized dissociation protocol that
0 50 100 150 200 250
0 2000 4000 6000 8000 Compl e
xity (Genes w/ >= 5 fr
ags) A01 A02 A03 A04 A05 A06 A07A08 A09 A10 A11 A12 B01 B02 B03B04 B05 B06 B07 B08 B09 B10 B11B12 C01 C02 C03 C04
C05C06C07 C08 C09 C10C11 C12D01 D02 D03 D04 D05D06 D07 D08 D0 D10D11 D12
0 50 100 150 200 250
0 2000 4000 6000 8000 Comple
xity (Genes w/ >= 5 fr
ags) E01 E02 E03 E04 E05 E06 E07E08 E09E10 E11 E12 F01 F02 F03 F04 F05 F06
F07F09F08
F10F11 F12G01 G02 G03 G04 G05 G06G07 G08 G09 G10 G11 G12 H01H02 H03 H04 H05H06 H07
H08H09H10 H11H12 Fibroblasts Leukocytes 10 0 10
30 20 10 0 10
PC1, 32% of variance
PC2, 8.6% of v
ar iance CellType B cell Fibroblast Macrophage T cell
Fragments mapped to human transcripts (x1,000) Fragments mapped to human transcripts (x1,000)
a
b
c
T cells 02468 1 0 CD3E F11 E07 D02 H08 C09 A12A11 B02 D11 B03 A09 G01 F07 D04 H02 B10 H04H05 F04 C11C08 D01 E09 D06 C05E03 D07 A08 F03 B01 E10 C07 F01 E05 E06 C04 D03 A07E08 H07 A01 A02 C01 H06 B07 G05 F02 G02 A05 F05
E04A03G04E01 A04 B04 F09 A06 H01 H09 C03 A10 C06 C12 G03 F08 H03 B05 C02 02468 1 0 1 2 CD14 H03 D03 A11 D04 C01 H07 C03 B01 F07 D06 C06 C11 H02 E10 B03 A02 F03 A05 A12 A10 H01 G05 H05 C12 B02 G01 C08 H08 E09 B10 A06 H06 E04 C09 C04 A03 B04 H09 D01 H04 E03 E05 B07 F04 A07 C07 A09 A08 F02 G02 E01 E06 A01 F11 G03 F08 D02 F05 C05 F01 G04 D11 C02 E07 E08 F09 B05 D07 A04 024 6 8 10 Podoplanin F02 E09 H09 A08 C09 A04 A09 D01 H07 F07B10 H04 E05 A02 E03 F09 F11 A11 A06 B04 E04 C06 C05 D07 E07 E01 C11 B07 F08 A07 F01 G04 H03 A05 D06 E10 G01 G02 H06 D02 B03 C01 D11 D03 G05 F04 C07 F05B01 C04 F03 A03 E06 C12 C02 H05 H02 C03 G03 D04 A10 H08 B05 A01 E08 C08 A12 B02 H01 02468 1 0 CD79A A01 A02 A03 A04 A05 A06 A07 A08 A09 A10 A11 A12 B01B02 B03 B04 B05 B07 B10 C01 C02 C03 C04C05 C06 C07C08 C09 C11 C12 D01 D02 D03 D04 D06 D07 D11 E01E03 E04 E05 E06 E07 E08 E09
E10 F02F01 F03 F04 F05 F07 F08 F09 F11 G01G02 G03 G04 G05 H01H02 H03 H04 H05H06 H07 H08 H09
B cells Fibros Macs B cells Fibros Macs T cells
T cells
B cells Fibros Macs B cells Fibros Macs T cells
[image:13.595.52.539.87.357.2]provides high yields of viable cells with preserved cell sur-face and transcriptomic features, synovial tissue samples acquired across a multisite network can be analyzed in a uniform way in order to identify dominant cell types and pathways, as well as to characterize previously unidentified cellular heterogeneity. Such approaches applied to large numbers of patients offer new opportunities to discover rheumatic disease biomarkers, targets for drug develop-ment, and molecular stratification of synovial pathology.
Additional file
Additional file 1:Table S1.Mass cytometry panel for analysis of synovial cells.Figure S1.Additional variables in synovial tissue enzymatic treatment (PDF 2239 kb)
Abbreviations
AMP RA network:RA Working Group of the AMP RA/SLE Network; AMP: Accelerating Medicines Partnership; ANOVA: Analysis of variance; DH: Dispase-High; DL: Dispase-Low; GO: Gene Ontology; IL-6: Interleukin-6; OA: Osteoarthritis; PCA: Principal component analysis; RA: Rheumatoid arthritis; RNA-seq: RNA sequencing; SLE: Systemic lupus erythematosus; SSW: Sum of squares within; TH: Thermolysin-High; TL: Thermolysin-Low; TM: Thermolysin-Medium; TNF: Tumor necrosis factor
Acknowledgements
The authors acknowledge the many clinical coordinators and patients who helped to provide samples for analysis in this study. They appreciate the many efforts of Mina Pichavant, Clinical Research Project Manager for the AMP, and Bill Apruzzese, Associate Director of Operations and Management for the AMP. Dr. Anolik gratefully acknowledges the UR Flow Cytometry Core and the Genomics Research Center. The following additional AMP members have contributed to the consortium through a variety of efforts: Jane Buckner, Derrick Todd, Michael Weisman,
Ami Ben Artzi, Lindsy Forbess, Joan Bathon, John Carrino, Oganna Nwawka, Eric Matteson, Robert Darnell, Dana Orange, Rahul Satija, Diane Horowitz, Harris Perlman, Art Mandelin, Louis Bridges, Laura B. Hughes, Arnold Ceponis, Peter Lowry, Paul Emery, Ahmed Zayat, Amir Aslaam, Karen Salomon-Escoto, David Fox, Robert Ike, Andy Cordle, Aaron Wise, John Ashton, Javier Rangel-Moreno, Christopher Ritchlin, Darren Tabechian, Ralf Thiele, Deborah Parks, John Akinson, Chiam Putterman, Evan Der, Elena Massarotti, Michael Weisman, David Hildeman, Richard Furie, Betty Diamond, Michelle Petri, Diane Kamen, Melissa Cunningham, Jill Buyon, Iris Lee, Hasan Salameh, Maureen McMahon, Ken Kalunian, Maria Dall’Era, David Wofsy, Mattias Kretzler, Celine Berthier, William McCune, Ruba Kado, Wiliam Pendergraft, Dia Waguespack, Yanyan Liu, Gerald Watts, Arnon Arazi, Rohit Gupta, Holden Maecker, Patrick Dunn, Rong Mao, Mina Pichavant, Quan Chen, John Peyman, Ellen Goldmuntz, Justine Buschman, Jennifer Chi, Su-Yau Mao, Susana Serrate-Sztein, Yan Wang, Thomas Tuschl, Yvonne Lee, Chamith Fonseka, Fan Zhang, Ilya Korsunskiy, Judith A. James, and Joel Guthridge.
Funding
This work was supported by the Accelerating Medicines Partnership (AMP) in Rheumatoid Arthritis and Lupus Network (AMP RA/SLE Network). The AMP is a public–private partnership (AbbVie Inc., Arthritis Foundation, Bristol-Myers Squibb Company, Lupus Foundation of America, Lupus Research Alliance, Merck Sharp & Dohme Corp., National Institutes of Health, Pfizer Inc., Rheumatology Research Foundation, Sanofi, and Takeda Pharmaceuticals International, Inc.) created to develop new ways of identifying and validating promising biological targets for diagnostics and drug development. Funding was provided through grants from the National Institutes of Health (UH2-AR067676, UH2-AR067677, UH2-AR067679, UH2-AR067681, UH2-AR067685, AR067688, AR067689, AR067690, AR067691, UH2-AR067694, and UM2-AR067678). This report includes independent research supported by the National Institute for Health Research/Wellcome Trust Clinical Research Facility at University Hospitals Birmingham NHS Foundation Trust. The views expressed in this publication are those of the author(s) and
not necessarily those of the NHS, the National Institute for Health Research, or the Department of Health. Funding was also provided by Arthritis Research UK (Fellowship 18547) and the RACE Rheumatoid Arthritis Pathogenesis Centre of Excellence (grant 20298).
Availability of data and materials
In addition to the data included in the manuscript, additional datasets analyzed during the current study are available from the corresponding author on reasonable request. Select datasets are available at the ImmPort repository.
Authors’contributions
LTD, MJM, JDT, NM, KM, JH, SK, SMG, CP, EMG, LWM, VPB, AF, DLB, and JHA contributed to tissue collection, acquisition of data, and data interpretation. LTD, DAR, KW, MJM, JDT, NM, FM, JK, KM, JH, CR, ER, AC, SK, ABP, JAL, LBI, CP, GSF, LWM, AF, DLB, MBB, and JHA contributed to tissue processing and validation studies, acquisition of data, and data interpretation. LTD, MJM, JDT, NM, FM, KM, JH, AF, DLB, MBB, and JHA contributed to the AMP Tissue Working Group and experimental design. DAR, KW, FM, DJL, JK, TME, SL, EPB, CN, and NH contributed to RNA purification, library prep, and sequencing. KS, MG-A, DJL, TME, SL, EPB, DS, AN, CN, JAL, NH, SR, and MBB contributed to computational data analysis. DAR and JAL contributed to mass cytometry experimental design, data acquisition, and data interpretation. KS, MG-A, DJL, TME, SL, EPB, WHR, NH, SR, and MBB contributed to the AMP Systems Biology Group. LTD, DAR, AF, MBB, and JHA contributed to manuscript drafting. All authors contributed to manuscript review. EMG, PKG, LWM, VPB, DLB, MBB, and JHA contributed to the AMP RA Disease Focus Group and experimental design. MJM, ABP, LBI, WHR, PJU, EMG, BFB, JAL, NH, CP, PKG, GSF, SR, LWM, VMH, VPB, AF, DLB, MBB, and JHA were AMP Principal Investigators. All authors read and approved the final manuscript.
Ethics approval and consent to participate
The study received institutional review board approval at each site. Sites performing research synovial biopsies included informed consent specifically for this procedure. Where samples were used for transcriptome analysis, informed consent included consent for genetic analysis and deposition of AMP project data into public NIH databases.
Competing interests
The authors declare that they have no competing interests.
Publisher’s Note
Springer Nature remains neutral with regard to jurisdictional claims in published maps and institutional affiliations.
Author details
1Hospital for Special Surgery, New York, NY 10021, USA.2Weill Cornell
Medical College, New York, NY 10065, USA.3Brigham and Women’s Hospital, Harvard Medical School, Boston, MA 02115, USA.4Broad Institute of MIT and
Harvard University, Cambridge, MA 02142, USA.5University of Pittsburgh
School of Medicine, Pittsburgh, PA 15261, USA.6University of Birmingham,
Queen Elizabeth Hospital, B15 2WB, Birmingham, UK.7University of Rochester Medical Center, Rochester, NY 14642, USA.8University of California San Diego
School of Medicine, La Jolla, CA 92093, USA.9Mile End Hospital, Barts Health
NHS Trust, E1 1BB, London, UK.10Stanford University School of Medicine,
Stanford, CA 94305, USA.11University of Massachusetts Medical School, Worcester, MA 01605, USA.12Massachusetts General Hospital, Harvard
Medical School, Boston, MA 02114, USA.13Queen Mary University of London,
E1 4NS, London, UK.14The Feinstein Institute for Medical Research,
Manhasset, NY 11030, USA.15University of Colorado of Denver School of Medicine, Aurora, CO 80045, USA.
Received: 10 March 2018 Accepted: 24 May 2018
References
1. Gravallese EM, Manning C, Tsay A, Naito A, Pan C, Amento E, Goldring SR. Synovial tissue in rheumatoid arthritis is a source of osteoclast differentiation factor. Arthritis Rheum. 2000;43(2):250–8.
link between B cells and bone Erosion in rheumatoid arthritis. Arthritis Rheumatol. 2016;68(4):805–16.
3. McInnes IB, Schett G. The pathogenesis of rheumatoid arthritis. N Engl J Med. 2012;365(23):2205–19.
4. Ai R, Hammaker D, Boyle DL, Morgan R, Walsh AM, Fan S, Firestein GS, Wang W. Joint-specific DNA methylation and transcriptome signatures in rheumatoid arthritis identify distinct pathogenic processes. Nat Commun. 2016;7:11849.
5. Rao DA, Gurish MF, Marshall JL, Slowikowski K, Fonseka CY, Liu Y, Donlin LT, Henderson LA, Wei K, Mizoguchi F, et al. Pathologically expanded peripheral T helper cell subset drives B cells in rheumatoid arthritis. Nature. 2017;542(7639):110–4.
6. Smolen JS, Landewe R, Bijlsma J, Burmester G, Chatzidionysiou K, Dougados M, Nam J, Ramiro S, Voshaar M, van Vollenhoven R, et al. EULAR
recommendations for the management of rheumatoid arthritis with synthetic and biological disease-modifying antirheumatic drugs: 2016 update. Ann Rheum Dis. 2017;76(6):960–77.
7. Nagy G, van Vollenhoven RF. Sustained biologic-free and drug-free remission in rheumatoid arthritis, where are we now? Arthritis Res Ther. 2015;17:181.
8. Tak P. A personalized medicine approach to biological treatment of rheumatoid arthritis: a preliminary treatment algorithm. Rheumatol. 2012;17:2012. 9. Orr C, Vieira-Sousa E, Boyle DL, Buch MH, Buckley CD, Canete JD, Catrina AI,
Choy EHS, Emery P, Fearon U, et al. Synovial tissue research: a state-of-the-art review. Nat Rev Rheumatol. 2017;13(8):463–75.
10. Dolhain RJ, Ter Haar NT, De Kuiper R, Nieuwenhuis IG, Zwinderman AH, Breedveld FC, Miltenburg AM. Distribution of T cells and signs of T-cell activation in the rheumatoid joint: implications for semiquantitative comparative histology. Br J Rheumatol. 1998;37(3):324–30.
11. Boyle DL, Rosengren S, Bugbee W, Kavanaugh A, Firestein GS. Quantitative biomarker analysis of synovial gene expression by real-time PCR. Arthritis Res Ther. 2003;5(6):R352–60.
12. Kelly S, Humby F, Filer A, Ng N, Di Cicco M, Hands RE, Rocher V, Bombardieri M, D'Agostino MA, McInnes IB, et al. Ultrasound-guided synovial biopsy: a safe, well-tolerated and reliable technique for obtaining high-quality synovial tissue from both large and small joints in early arthritis patients. Ann Rheum Dis. 2015;74(3):611–7.
13. Pitzalis C, Kelly S, Humby F. New learnings on the pathophysiology of RA from synovial biopsies. Curr Opin Rheumatol. 2013;25(3):334–44. 14. Koski JM, Helle M. Ultrasound guided synovial biopsy using portal and
forceps. Ann Rheum Dis. 2005;64(6):926–9.
15. Choi IY, Karpus ON, Turner JD, Hardie D, Marshall JL, de Hair MJH, Maijer KI, Tak PP, Raza K, Hamann J, et al. Stromal cell markers are differentially expressed in the synovial tissue of patients with early arthritis. PLoS One. 2017;12(8):e0182751.
16. Picelli S, Faridani OR, Bjorklund AK, Winberg G, Sagasser S, Sandberg R. Full-length RNA-seq from single cells using smart-seq2. Nat Protoc. 2014;9(1):171–81. 17. Hashimshony T, Senderovich N, Avital G, Klochendler A, de Leeuw Y, Anavy
L, Gennert D, Li S, Livak KJ, Rozenblatt-Rosen O, et al. CEL-Seq2: sensitive highly-multiplexed single-cell RNA-Seq. Genome Biol. 2016;17:77. 18. Dobin A, Davis CA, Schlesinger F, Drenkow J, Zaleski C, Jha S, Batut P,
Chaisson M, Gingeras TR. STAR: ultrafast universal RNA-seq aligner. Bioinformatics. 2013;29(1):15–21.
19. Li B, Dewey CN. RSEM: accurate transcript quantification from RNA-Seq data with or without a reference genome. BMC Bioinformatics. 2011;12:323. 20. Wagner F. The XL-mHG test for gene set enrichment. PeerJ Preprints. 2017;
https://doi.org/10.7287/peerj.preprints.1962v3.
21. Finck R, Simonds EF, Jager A, Krishnaswamy S, Sachs K, Fantl W, Pe'er D, Nolan GP, Bendall SC. Normalization of mass cytometry data with bead standards. Cytometry Part A. 2013;83(5):483–94.
22. Van Landuyt KB, Jones EA, McGonagle D, Luyten FP, Lories RJ. Flow cytometric characterization of freshly isolated and culture expanded human synovial cell populations in patients with chronic arthritis. Arthritis Res Ther. 2010;12(1):R15.
23. Cush JJ, Lipsky PE. Phenotypic analysis of synovial tissue and peripheral blood lymphocytes isolated from patients with rheumatoid arthritis. Arthritis Rheum. 1988;31(10):1230–8.
24. van den Brink SC, Sage F, Vertesy A, Spanjaard B, Peterson-Maduro J, Baron CS, Robin C, van Oudenaarden A. Single-cell sequencing reveals dissociation-induced gene expression in tissue subpopulations. Nat Methods. 2017;14(10):935–6.
25. Stephenson W, Donlin LT, Butler A, Rozo C, Bracken B, Rashidfarrokhi A, Goodman SM, Ivashkiv LB, Bykerk VP, Orange DE, et al. Single-cell RNA-seq of rheumatoid arthritis synovial tissue using low-cost microfluidic instrumentation. Nat Commun. 2018;9(1):791.
26. Mizoguchi F, Slowikowski K, Wei K, Marshall JL, Rao DA, Chang SK, Nguyen HN, Noss EH, Turner JD, Earp BE, et al. Functionally distinct disease-associated fibroblast subsets in rheumatoid arthritis. Nat Commun. 2018;9(1):789.
27. Amir el AD, Davis KL, Tadmor MD, Simonds EF, Levine JH, Bendall SC, Shenfeld DK, Krishnaswamy S, Nolan GP, Pe'er D. viSNE enables visualization of high dimensional single-cell data and reveals phenotypic heterogeneity of leukemia. Nat Biotechnol. 2013;31(6):545–52.
28. Anolik J, Barnard J, Cappione A, Pugh-Bernard A, Felgar R, Looney J, Sanz I. Rituximab improves peripheral B cell abnormalities in human systemic lupus erythematosus. Arthritis Rheumatism. 2004;50:3580–90.
29. Tipton CM, Fucile CF, Darce J, Chida A, Ichikawa T, Gregoretti I, Schieferl S, Hom J, Jenks S, Feldman RJ, et al. Diversity, cellular origin and autoreactivity of antibody-secreting cell population expansions in acute systemic lupus erythematosus. Nat Immunol. 2015;16(7):755–65.
30. Slansky E, Li J, Haupl T, Morawietz L, Krenn V, Pessler F. Quantitative determination of the diagnostic accuracy of the synovitis score and its components. Histopathology. 2010;57(3):436–43.
31. Dennis G Jr, Holweg CT, Kummerfeld SK, Choy DF, Setiadi AF, Hackney JA, Haverty PM, Gilbert H, Lin WY, Diehl L, et al. Synovial phenotypes in rheumatoid arthritis correlate with response to biologic therapeutics. Arthritis Res Ther. 2014;16(2):R90.
32. Belasco J, Louie JS, Gulati N, Wei N, Nograles K, Fuentes-Duculan J, Mitsui H, Suarez-Farinas M, Krueger JG. Comparative genomic profiling of synovium versus skin lesions in psoriatic arthritis. Arthritis Rheumatol. 2015;67(4):934–44.
33. van Baarsen LG, Wijbrandts CA, Timmer TC, van der Pouw Kraan TC, Tak PP, Verweij CL. Synovial tissue heterogeneity in rheumatoid arthritis in relation to disease activity and biomarkers in peripheral blood. Arthritis Rheum. 2010;62(6):1602–7.
34. Hogan VE, Holweg CT, Choy DF, Kummerfeld SK, Hackney JA, Teng YK, Townsend MJ, van Laar JM. Pretreatment synovial transcriptional profile is associated with early and late clinical response in rheumatoid arthritis patients treated with rituximab. Ann Rheum Dis. 2012;71(11):1888–94. 35. Badot V, Galant C, Nzeusseu Toukap A, Theate I, Maudoux AL, Van den
Eynde BJ, Durez P, Houssiau FA, Lauwerys BR. Gene expression profiling in the synovium identifies a predictive signature of absence of response to adalimumab therapy in rheumatoid arthritis. Arthritis Res Ther. 2009;11(2):R57.
36. Lauwerys BR, Hernandez-Lobato D, Gramme P, Ducreux J, Dessy A, Focant I, Ambroise J, Bearzatto B, Nzeusseu Toukap A, Van den Eynde BJ, et al. Heterogeneity of synovial molecular patterns in patients with arthritis. PLoS One. 2015;10(4):e0122104.
37. Lindberg J, Wijbrandts CA, van Baarsen LG, Nader G, Klareskog L, Catrina A, Thurlings R, Vervoordeldonk M, Lundeberg J, Tak PP. The gene expression profile in the synovium as a predictor of the clinical response to infliximab treatment in rheumatoid arthritis. PLoS One. 2010;5(6):e11310.
38. Orange DE AP, DiCarlo EF, Szymonifka J, McNamara M, Cummings R, Andersen KM, Mirza S, The Accelerating Medicine Partnership: RA/SLE Network, Figgie M, Ivashkiv L, Pernis AB, Jiang C, Frank M, Darnell R, Gravallese E, Bykerk VP, Goodman SM, Donlin LT: Machine Learning integration of rheumatoid arthritis synovial histology and RNAseq data identifies three disease subtypes. Arthritis Rheumatol. 2018;70(5):690–701 39. Der E, Ranabothu S, Suryawanshi H, Akat KM, Clancy R, Morozov P, Kustagi
M, Czuppa M, Izmirly P, Belmont HM, et al. Single cell RNA sequencing to dissect the molecular heterogeneity in lupus nephritis. JCI Insight. 2017;2(9) 40. Villani AC, Satija R, Reynolds G, Sarkizova S, Shekhar K, Fletcher J,
Griesbeck M, Butler A, Zheng S, Lazo S, et al. Single-cell RNA-seq reveals new types of human blood dendritic cells, monocytes, and progenitors. Science. 356(6335):eaah4573.