5
XI
November 2017
Performance Analysis of Decision Tree Algorithms
on Mushroom Dataset
B.Lavanya1, G.R.Preethi2
1, 2
Department of Computer Science, University Of Madras
Abstract: Data mining is a process of extracting valuable information from vast dataset databases. This paper discusses data mining algorithms namely ID3, CART, and HoeffdingTree (HT) based on decision tree. Our goal is to assess the risk to human life through the consumption of mushrooms. Decision tree is used to classify the data with 22 attributes, to either edible or poisonous Mushrooms. Decision tree is used in this study as classification technique for analyzing mushroom data set. This experiment has been performed in R studio software environment. This study illustrates the accuracy of each classifier and the results are compared and discussed to which classifier is best for mushroom dataset. Hoeffding Tree provides better results with highest accuracy, low time and least error rate when compared with ID3 and CART.
Keywords:Classification, Decision tree, ID3, CART, HoeffdingTree. I. INTRODUCTION
The data mining process of extracting information from large set database. Mining has attracted great attention from various fields due to wide and large data present in these fields. Agriculture data can be analysed for taking various decisions like to increase the productivity, to classify soil type, to categorize different types of crops etc. Large amounts of data of different fields are available. Manually analyzing the large amounts of data is complicated task; data mining techniques can be applied for the same. Data mining is a step in the whole process of knowledge discovery which can be applied to a dataset to extract any previously unknown, valid, novel, useful and understandable patterns if present in the dataset. Data mining is the non-trivial process that automatically collects the useful hidden information from the data and is taken on as forms of rule, concept, pattern and so on [1].
Data mining is always successful in prediction of useful or discovery of new patterns in large databases. It utilizes methods at the intersection of artificial intelligence, machine learning statistics and database systems [1]. One of supervised data mining technique namely decision tree classification has the task to predict accurately the class to which the data samples belong to. For example consider mushrooms data samples. Based on training dataset, the mushrooms are classified as either edible or poisonous. Data available from UCI data repository, which records all Agaricus and Lepiota family and then they are classified as edible or poisonous is used as training dataset for proposed system. In this paper different types of decision tree classification using ID3, CART, and HT are implemented. This paper is an illustrative classification problem with binary output: mushrooms are classified into simple edible are poisonous and the performance of these classification techniques are compared.
II. LITERATUREREVIEW
Pedro Domingos, Geoff Hulten et al., [1] in “Mining High-Speed Data Streams” focuses on high speed data stream classification
III.METHODOLOGY
The proposed method classifies the edible mushrooms and poisonous mushrooms from mushroom dataset find risk factor and compares the performance of three various decision tree classification techniques over this data. The objective of this paper to assess the risk to human life through the mushrooms that we intake, this work concentrates on mushroom dataset. It proves that classification using Hoeffding tree yields 100% result.
A. Dataset Description
A mushroom data set available from the UCI data repository is considered for Hoeffding Tree. This data set includes descriptions of attributes samples corresponding to 22 species of gilled mushrooms in the Agaricus and Lepiota family. Each species is identified as definitely edible, definitely poisonous or of unknown edibility and not recommended. This latter case is combined with poisonous one. This data set contains 8,124 instances, of which 4,208(52%) instances are edible and 3,916(48%) are poisonous. This data set is analyzed to identify different combinations of attributes that are significant in classifying the mushroom data as poisonous or edible.
B. Classification Techniques
Various classification algorithms and methodologies are available for classification of the given data set. The classification techniques we have chosen is decision trees.
1) Decision Trees: Decision trees are powerful and popular tools for classification and prediction. Decision trees represent rules, which can be understood by humans and used in knowledge system such as database [5]. Decision trees can handle both numerical and categorical data. A decision tree is a decision support tool that uses a tree-like graph or model of decisions and their possible consequences, including chance event outcomes, resource costs, and utility. Decision node: specifies a test on a single attribute. Leaf node: indicates the value of the target attribute. Edge: split of one attribute. Path: a disjunction of test to make the final decision.This paper implemented decision tree classification, that three classification algorithms namely ID3, CART, and HoeffdingTree.
a) ID3 Algorithm: Iterative Dichotomiser 3, popularly known as ID3, ID3 adopts a greedy mechanism where trees are constructed through non backtracking top-down manner. The process of constructing these trees starts with the training phase where data is represented in form of attributes and their associated classes. ID3 algorithm builds tree based on the information gain obtained from the training instances and then uses the same to classify the test data [7].
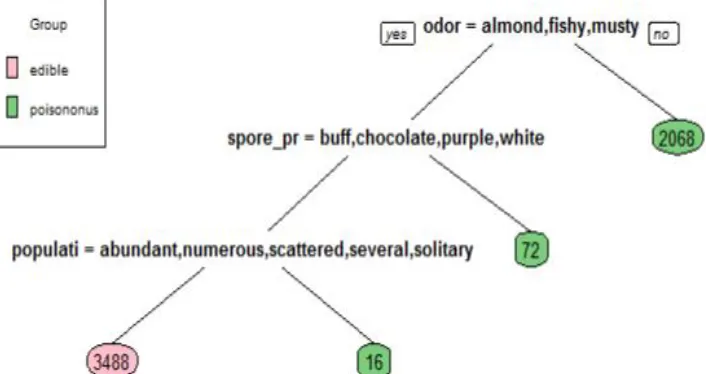
[image:3.612.136.489.522.709.2]i. Rules for ID3 Decision Tree: Calculate the entropy of the class Attribute. The dataset is then split on the different attributes. The Entropy for each branch is calculated. Then it is added proportionally to get total entropy is subtracted from the entropy before the split. The result is the Information Gain or Decrease in entropy. Choose attribute with the highest Information Gain as the Decision node, divide the dataset by its branches and repeat the same process on every branch. A branch with entropy of 0 is a leaf node. A branch is when entropy more than 0 needs further splitting. ID3 algorithm is handle recursively on the non-leaf branches, until all data is classified [8][9].
The attribute containing the highest information gain value is chosen to make the decision and constructed decision tree of mushroom data. Actually 4,208(52%) instances are edible and 3,916 (48%) are poisonous. But this ID3 classifier classified 3488(42%), instances are edible and 2156(26%) are poisonous. There are missing Instances data 2480(32%). It leads to a total of 69% accuracy and 31% error, the tree is shown in Fig 1.
ii. Disadvantages ID3
1) Does not handle numeric attribute and missing values.
2) Data may be over-fitted or over-classified, if a small sample is tested. 3) Only one attribute at a time is tested for making a decision.
4) Highest error rate.
b) CART Algorithm: One of the decision tree algorithms is CART (Classification and Regression Tree). CART is developed by Breiman, Friedman, Olshen, & Stone in 1984 (Book - Classification and Regression Trees). CART algorithm can be used for building both Classification and Regression Decision Trees. The impurity (or purity) measure used in building decision tree in CART is Gini Index. The decision tree built by CART algorithm is always a binary decision tree (each node will have only two child nodes). The splits are selected using the towing criteria and the obtained tree is pruned by cost–complexity pruning. CART can handle both numeric and categorical variables and it can easily handle outliers.
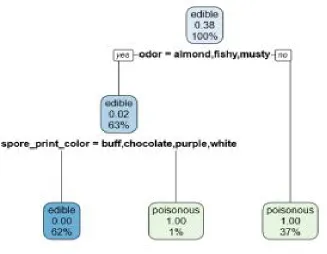
[image:4.612.146.473.382.636.2]i. Spit Attributes Based on the Gini Index: A data partition or set of training samples are concluding result, is a tree containing decision nodes and leaf nodes. A decision node, Odour has either two or more than two branches they are Almond, Fishy, and Musty. Leaf node is classes edible or poisonous depicts a decision tree classification. The root node is the top-most decision node in a tree which is the best predictor. The attributes with the largest reduction in the Gini index selecting as the splitting attribute. So splitting attribute is odour, now take odour out of consideration since they has already been classified the same approach is used with remaining data until the algorithm terminates.
Fig 2: Mushroom data set classified using CART
ii. Disadvantages CART
1) It can split on only one variable. 2) Misclassification is high.
3) Trees formed may be unstable.
4) Insignificant modification of learning sample such as eliminating several observations and cause changes in decision tree: increase or decrease of tree complexity, changes in splitting variables and values.
c) Hoeffding Tree: Hoeffding trees were introduced by Domingos and Hutten in high speed data stream. They refer to their implementation as VDFT an acronym for Very Fast Decision Tree leaner .The Hoeffding tree algorithm is the basic theoretical algorithm, while VFDT introduces several enhancement for practical implementation. Hoeffding tree it is based in decision tree it performed very well [13]. Hoeffding tree is an incremental decision tree learner for large data stream that assumes that the data distribution is not changing over time. It grows incrementally a decision tree based on the theoretical guarantee of Hoeffding bound [14]. Many stream classification algorithm use the Hoeffding bound to indentify the best splitting attributes during the induction. The stream classification attributes Hoeffding tree is also based Hoeffding bound this provides the expected performance guarantee. The goal of work is to improve accuracy & solution achieves lower error rate regarding split attributes [13][15].
i. Hoeffding Tree Algorithm: Hoeffding Tree uses a statistical method called the Hoeffding bound or additive Cher off bound to decide the splitting criterion of the attribute while constructing the tree during training process. The tree is built by recursively replacing leaves i.e. the selected attributes with decision node. A heuristic evaluation function is used to determine the best splitting criterion for converting leaves to nodes. Nodes contain the selected attributes and leaves contain the class labels. When a test data sample arrives, the tree is traversed from the root to the leaf, evaluating the relevant attributes satisfying the decisions at every node. The splitting technique uses a heuristic evaluation function G (.). The necessary number of samples uses HB (Hoeffding Bound) to limit the amount of training data required to construct the tree for making decisions[10][1].
∈ = √ ( / )
ii. Rule for Hoeffding Tree: Where
1. n:no of independent observations
2. r:random variable whose range is R,
3. 1/δ: Confidence level Let x1 is the attribute with the highest G (.), and x2 are the attribute with the second-highest G (.).
4. Formula: ∆G = G(x1) − G(x2)
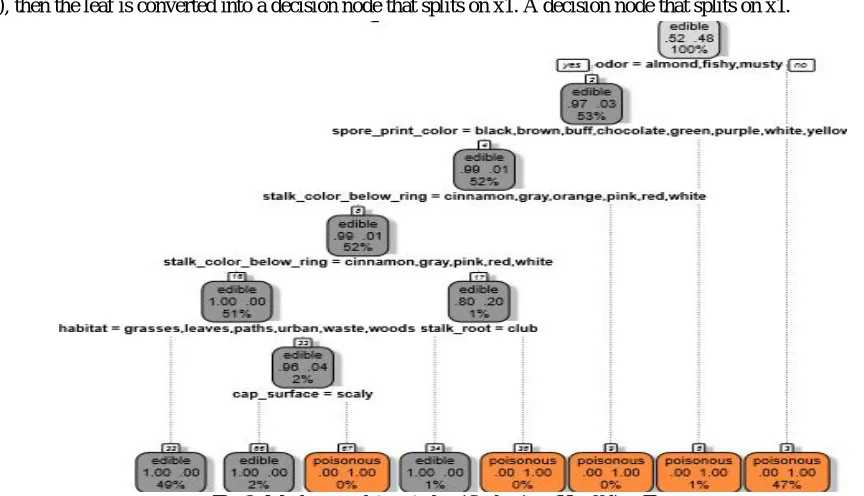
[image:5.612.83.515.475.723.2]5. If ∆G>HB with n samples is observed in a leaf, and HB states with probability 1/δ that x1 is the attribute with the highest value in G(.), then the leaf is converted into a decision node that splits on x1. A decision node that splits on x1.
The Hoeffding bound value is chosen to make the decision and constructed decision tree of mushroom dataset. Actually 4,208 (52%) instances are edible and 3,916 (48%) are poisonous. Hoeffding tree classifier classified 4,208 (52%), instances are edible and 3,916 (48%) are poisonous, no missing Instance and misclassifications in Hoeffding tree classification. Thus producing 100% result, the tree is shown in Fig 3.
IV.PERFORMANCEMEASURE
Accuracy is major concern as it deals with agriculture and human life. Accuracy is measured for each algorithm implementation. On collective analysis of accuracy the final decision is taken, accuracy is calculated using confusion matrix. Mushroom dataset after the classification process, the performance of the used algorithms are compared based on the performance measures such as correctly and incorrectly classified instances.
A. Correlation
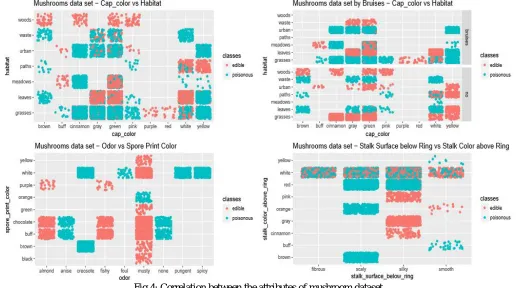
[image:6.612.48.565.287.575.2]A correlation is statistical measure that indicates that extents to which two or more variable fluctuate together. A positive correlation indicate the extent to which those variables increase in parallel, a negative correlation indicate the extent to which one variable increase as the other decreases. The Fig 4 illustrated the correlation between the two attributes of mushrooms data with the combination as given below.
Fig 4: Correlation between the attributes of mushroom dataset
The relationship between the mushrooms Cap colour vs Habitat, Bruises- cap colour vs Habitat, Odor vs Spore print colour, Stack surface below Ring vs Stalk Colour above Ring, Attributes with each other explains the higher correlation between them, and it is given in Fig 4.
B. Accuracy Measures of Classification Techniques with Confusion Matrix
A confusion matrix is a table that is often used to describe the performance of a classification model or "classifier" on a set of test data for which the true values are known.
i. Correctly classified instance = TP + TN
ii. Incorrectly classified instance = FP + FN
TABLE 1: FORMAT OF CONFUSION MATRIX
ACTUAL /PREDICTED PREDICTED YES PREDICTED NO
ACTUAL YES True Positive(TP) False Positive(FN)
ACTUAL NO False Negative(FP) True Negative(TN)
[image:7.612.167.442.230.340.2]a) Results for ID3 Decision Tree Classification: The performances analysis of the used ID3 algorithm are compared based on the performance measures such as correctly and incorrectly classified instances on mushroom dataset,and it is given in Fig 5.
Fig 5: Graph plotted ID3 correctly and incorrectly classified instances on mushroom dataset.
[image:7.612.82.484.451.659.2]The details of the above graph are shown in the bottom in the Table 2, it is shown in confusion matrix of the ID3 algorithm, and ID3 does handle the missing instance data of mushroom dataset. It leads to a total of 69 % accuracy and 31 % error on mushroom dataset.
TABLE 2 ID3 CLASSIFICATION CONFUSION MATRIXES
Predicted/ Actual Pred:Edible Pred:Poisonous
Actual: edible (4208) 3488 0
Actual: poisonous (3916) 0 2156
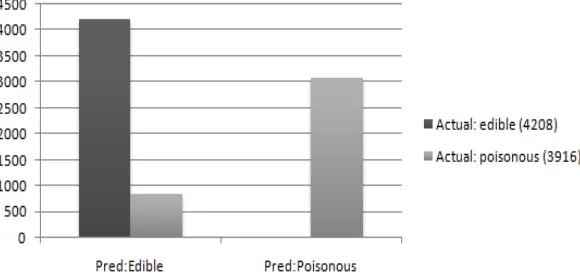
[image:7.612.163.453.522.660.2]b) Results for CART Decision Tree Classification: The performances analysis of the used CART algorithm are compared based on the performance measures such as correctly and incorrectly classified instances on mushroom dataset, and it is given in Fig 6.
Fig 6 Graph plotted of CART correctly and incorrectly classified instances on mushroom dataset.
TABLE 3: CART CLASSIFICATION CONFUSION MATRIX
Predicted/ Actual Pred:Edible Pred:Poisonous
Actual: edible (4208) 4208 0
Actual: poisonous (3916) 829 3087
c) Results for HoeffdingTree Decision Tree Classification: The performances analysis of the used Hoeffding Tree algorithm are compared based on the performance measures such as correctly and incorrectly classified instances on mushroom dataset, and it is given in Fig 7.
Fig 7: Graph plotted of Hoeffding Tree correctly and incorrectly classified instances on mushroom dataset.
[image:8.612.62.550.381.426.2]The details of the above graph are shown in the bottom on the Table 4, it is shown in confusion matrix of the HoeffdingTree algorithm, it has performed very well in prediction. It leads to a total of 100% accuracy and 0 % error rate. Hoeffding tree classification is scales different attribute better than other traditional algorithm (ID3& CART).
TABLE 4: Hoeffdingtree Classification Confusion Matrix
Predicted/ Actual Pred:Edible Pred:Poisonous
Actual: edible (4208) 4208 0
Actual: poisonous (3916) 0 3916
V. RESULTANDDISCUSSION
A. Comparisons of Performance Measures among Decision Tree Algorithms
The comparisons of performance measures among decision tree algorithms, Hoeffding tree provides better results missing values; misclassification and tree construction time is low for mushroom classification. It is best classifier for mushrooms dataset prediction compared to other two algorithms, it shown in Table 5.
TABLE 5: Comparison- Of Decision Tree Classification Output On Mushroom Dataset Decision tree algorithms Mushroom dataset Instances Edible Mushrooms Instances Poisonous Mushrooms Instances
Missing Value of Mushroom Instances
Mushroom Data Misclassified Instances
Time required for tree
construction(sec)
ID3 8124 3488 2156 2480 0 0.17
CART 8124 4208 3087 0 829 0.9
Hoeffding Tree
8124 4208 3916 0 0 0.3
B. Comparisons of Accuracy and Error Rate with Decision Tree Algorithms
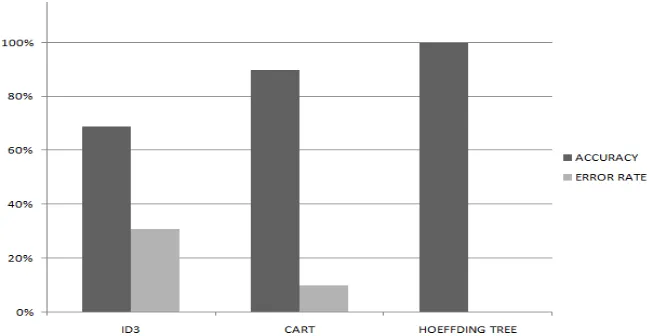
Fig 8: Graph plotted comparisons of accuracy and error rate with decision tree algorithms
[image:9.612.145.470.89.257.2]The details of the above graph are shown in the bottom of the Table 6, it is shown in the three classification algorithms are compared for accuracy and error rate. Hoeffding tree provides better results with highest Accuracy, least Error rate, compared with ID3 and CART decision trees classification algorithms on mushrooms dataset.
TABLE 6 Comparisons Of Accuracy And Error Rate With Decision Tree Algorithms
DECISION TREES ACCURACY ERROR RATE
ID3 69% 31%
CART 90% 10%
HOEFFDING TREE 100% 0%
C. Comparisons of Parameters Measures with Decision Tree Algorithms
[image:9.612.43.560.465.596.2]The three types of decision tree follow various parameters and they were different among themselves as shown in table 7.
TABLE 7: Comparison of Parameters For The Types Of Decision Tree
SNO PARAMETER ID3 CART HOEFFDING TREE
1 Tree structure Multi tree Binary tree Incremental tree
2 Handling missing data No Yes Yes
3 Method of handling
attributes selection
Entropy &
Information Gain
Gini Index Hoeffding Bound
4 Time required for tree
construction
More Moderate Less
5 Error rate High Medium Less
6 Scalability Poor Poor Good
D. Comparison-No of Correctly Classified Instance of Mushroom dataset
TABLE 8: Comparison-No. of Correctly Classified Mushroom Dataset S.
No
No Of
Instance
Correctly Classified Instances by ID3
Correctly Classified Instances by CART
Correctly Classified Instances By Hoeffding Tree
1 100000 73552 746512 81191
2 200000 144651 145001 162052
3 300000 22555 231456 242562
4 400000 27528 291409 322590
From Table 8, the Hoeffding tree provides better results always mushrooms dataset is added instance in future ID3 and CART algorithm classified in below 400000 instances, the instance will increase above 500000 instance the two traditional algorithms will CRASHED, but the instance will increased Hoeffding tree algorithm is processed and given good result. This algorithm can handle both online and offline database.
VI.CONCLUSIONSANDFUTURESCOPES
A. Conclusion
In this paper we used different data mining popular decision tree classification algorithms, namely ID3, CART and Hoeffding Tree. Our goal is to assess the risk to human life through the mushrooms that we intake, this work concentrates on mushroom dataset. Experiment result compares Accuracy and error rate for performance measured. ID3 and CART algorithm is not given good accuracy and error rate of mushroom dataset. Decision tree based on Hoeffding tree algorithm is proves better result compared to ID3 and CART, with 100% result.
B. Future Scope
After an extensive and a performance study on various decision tree algorithms, it’s understood that the drawbacks of ID3 and CART can be overcome by HT which makes it a right choice for us to explore and study more on the applications of this algorithm. Hoeffding Tree can be used to handle unstructured data. So, Hoeffding Tree can be used in locating and targeting on social media data like Face book using a distributed environment to decrease the execution time.
REFERENCES
[1] Pedro Domingos and Geoff Hulten, Mining HighSpeed Data Streams Dept. of Computer Science and Engineering , University of Washington, Box 352350,Seattle, WA 98195-2350, U.S.A.
[2] M.V.V.S Subramanian,Sri. V. VenkateswaraRao “VFDT Algorithm for Decision Tree Generation ”Sri Vasavi Engineering College,TadepalliGudem, WG DIST. IJDCST − November, Issue − V − 1, I − 7,SW − 94
[3] TusharkumarTrambadiya, Praveen Bhanodia “A Comparative study of Stream Data mining Algorithms ”International Journal of Engineering and Innovative Technology (IJEIT) Volume 2, Issue 3, September 2012.
[4] Arvind Kumar1, ParminderKaur and PratibhaSharm,” A Survey on Hoeffding Tree Stream Data Classification Algorithms” National Institute of Technology, Hamirpur-177005, India, CPUH-Research Journal: 2015, 1(2),28-32 ISSN (Online): 2455-6076.
[5] P.K. Srimani, Malini M. Patil* et,al.,[2015],[5] “Performance analysis of Hoeffding Tree in data streams by using massive online analysis framework”. [6] Chuquanliang,yang zhang, pengsh&zhengguo Hu et al.,[2015][ ]”learning accurate very fast decision trees from uncertain streams”.
[7] Data Mining, Southeast Asia Edition: Concepts and Techniques ByJiawei Han, MichelineKamber.
[8] Wei Peng, Juhua Chen and Haiping Zhou, of ID3, “An Implementation Decision Tree Learning Algorithm ”, University of New South Wales, School of Computer Science and Engineering, Sydney, NSW 2032, Australia.
[9] Data Mining:Concepts and Techniques Second Edition by JiaweiHan, elsevier.
[10] BadrHSSINA,AbdelkarimMERBOUHA,HananeEZZIKOURI,MohammedERRITALI”A Comparative study of decision tree ID3 and C4.5” , (IJACSA). RupaliBhardwaj, Sonia Vatta Implementation of ID3 in International Journal of Advanced Research in Computer Science and Software Engineering.
[11] XieNiuniu ,College of Information Science and Engineering Henan University of Technology Zhengzhou, China , Liu Yuxun , College of Information Science and Engineering Henan University of Technology Zhengzhou, China Review of Decision Trees.
[12] HarvinderChauhan,AnuChauhan ,Assistant Professor, P.G.Dept. of Computer Science Kamla Nehru College For Women, Phagwara(Punjab),ResearchScholar,Implementation of decision tree algorithm CART, International Journal of Scientific and Research Publica- tions, Volume 3, Issue 10, October 2013.
[13] AnkurShrivastava and Vijay Choudhary, Comparison between ID3 and CART in Contrast to IDS SurbhiHardikar, VSRD-IJCSIT, Vol. 2 (7), 2012, 659-667. [14] Yiwen Zhang ; Lili Ding ; Yun Wang ,Research and design of ID3 algorithm rules-based anti-spam email filtering, Software Engineering and Service Science
(ICSESS), 2011 IEEE 2nd International Conference on , DOI: 10.1109/ICSESS.2011.5982380 , Page(s): 572 – 575,Publication Year: 2011 .