Sensing Algorithm for Cognitive Radio Networks based
on Random Data Matrix
Rohitha Ujjinimatad, IEEE Member
Ballari Institute of Technology & Management ECE Deartment, Ballari, India.
Siddarama R Patil,
PhD.Professor and Head of the ECE Department PDA College of Engineering, Gulbarga, India.
ABSTRACT
Signal detection is a fundamental problem in Cognitive radio. In this paper a new statistical test is proposed based on random data matrix (RDM) for detecting the signals in noise, as opposed to the eigenvalue based tests. Among the many spectrum sensing methods, the RDM method detects the primary users without any prior information. The performance of the test is compared with energy detection (ED), covariance absolute value (CAV) and eigenvalue based algorithms through simulation analysis. This sensing algorithm can be used for very low SNR signal detection without requiring the knowledge of signal, channel and noise. Simulations are based on wireless microphone and identically and independently distributed (iid) signals.
Keywords
Cognitive radio, Random data matrix, Spectrum sensing, Sphericity test, sensing algorithms.
1.
INTRODUCTION
Conventional fixed spectrum allocation policy leads to low spectrum usage in many of the frequency bands. Cognitive radio, first proposed in [1], is a promising technology to exploit the under-utilized spectrum in an opportunistic manner [2]. One application of cognitive radio is spectral reuse, which allows secondary networks/users to use the spectrum allocated/licensed to the primary users when they are not active [3]. To do so, the secondary users are required to frequently perform channel sensing, i.e., detecting the presence of the primary users. If the primary users are found to be inactive, the secondary users can use the spectrum for communications. On the other hand, whenever the primary users become active, the secondary users have to detect the presence of those users in high probability, and vacate the channel within certain amount of time. One communication system using the spectrum reuse concept is IEEE 802.22 wireless regional area networks (WRAN) [4], which operates on the VHF/UHF bands that are currently allocated for TV broadcasting services and other services such as wireless microphone. To ensure that there will be no harmful interference to the primary user, the secondary users need to periodically detect (sense) the presence of the primary user.
To do so, each medium access control frame consists of two sub frames - a channel sensing sub frame and a data transmission sub frame. There are several factors that prevent the spectrum sensing from operating in a reliable manner. One factor is that the strength of the primary users’ signals could be very weak when they reach the secondary users. This is due to the fact that wireless propagation suffers from multipath fading and shadowing loss. Therefore, the signal-to-noise ratio (SNR) of the primary users’ signal could be very
active, its own signal will interfere with the primary users’ signals [5].
Spectrum sensing is a fundamental task for cognitive radio. However, there are several factors which make spectrum sensing practically challenging. First, SNR of the primary users may be very low. Since a cognitive radio operates as a secondary user which do not have primary rights to any pre-assigned frequency bands, it is necessary for it to dynamically detect the presence of primary users. If the secondary users are several hundred meters away from the microphone devices, the received signal SNR may be well below -20dB. The noise/interference level may change with time, which yields noise uncertainty. There are two types of noise uncertainty: receiver device noise uncertainty and environment noise uncertainty. The receiver device noise uncertainty comes from: (a) non-linearity of components; and (b) time-varying thermal noise in the components. The environment noise uncertainty may be caused by transmissions of other users, either unintentionally or intentionally. Because of noise uncertainty, in practice, it is very difficult to obtain the accurate noise power.
There have been several sensing methods, including the likelihood ratio test (LRT) [10], energy detection method [7, 8, 9, 10, 11, 12], matched filtering (MF)-based method [8, 10, 12, 13] and cyclostationary detection method [14, 15, 16], each of which has different requirements and advantages/ disadvantages. Although LRT is proved to be optimal, it is very difficult to use it in practice, because it requires exact channel information, and distributions of source signal and noise. In order to use LRT for detection, we need to obtain the channels and signal and noise distributions first, which are practically intractable.
To overcome the shortcomings of energy detection, in this paper, we propose new statistical test based on random data of the received signal samples. The proposed method does not require any information about the transmitted signal, channel and noise. It is shown by the simulation that probability of detection is very high for low SNR as compared to the eigenvalue based sensing algorithms (MED, MME and EME), CAV and ED methods.
The rest of the paper is organized as fallows. In section 2 a new statistical detection algorithm is proposed for cognitive radio networks in presence of uncertain noise and threshold calculation is shown. In section 3 energy detection, covariance based and eigenvalue based algorithms are discussed. In section 4 simulation results for two types of signals are presented for the proposed and for the existing algorithms. Finally in section 5, conclusions are drawn.
2.
DETECTION ALGORITHM BASED
ON RANDOM DATA
Let be the received signal, where is
the transmitted signal (Possible primary user’s signal) and
is the Additive white Gaussian noise (AWGN) with
zero mean and variance. Based on the received signal the cognitive user has to decide if whether the primary user is present or not. This may be formulated as a binary hypothesis testing problem.
(1)
Two probabilities are of interest. The probability of detection, which defines at hypothesis [ / =
], the probability of sensing algorithm having detected the presence of the signal; and probability of false alarm which defines at hypothesis . [ / = ], the probability of sensing algorithm claiming the presence of the signal. Let us consider the random data matrix of size N K from the received signal samples as
(2)
comprising N independent vectors, where each vector contain K number of entries. The sample covariance matrix of random data is defined as
Note that the sample covariance matrix is symmetric and Toeplitz. Based on we propose the following algorithm for signal detection in cognitive radio networks.
Algorithm: RDM Sensing method
Step 1: Set the threshold based on the target probability of false alarm. This is discussed in the next section.
Step 2: Generate the random data matrix as defined in (2) from the received signal samples
Step 3: Form the sample covariance matrix as defined in (3) from random data matrix
Step 4: Compute the following
Where denotes the trace of the matrix .
Step 5: Determine the presence of the signal based on T and threshold ( )
if > , signal exists; otherwise signal does not exist.
John (1971) proves that the test based on T is locally most powerful invariant test for sphericity. The asymptotic behavior of T as N and K go to infinity together with the ratio
converging to a limit . Most of the existing sphericity tests are based on the eigenvalues of sample covariance matrix, which constitute the maximal invariant statistic with respect to orthogonal transformation of data. The asymptotic power of such tests depends on the asymptotic behavior of the sample covariance eigenvalues under the alternative hypothesis. Ledoit and Wolf (2002) proved that,
under null hypothesis, . Where denotes convergence in distribution and N is the normal distribution. The proposed method uses only the received signal samples. It does not need any information of the signal, the channel and noise power as a priori. Also no synchronization is needed. The calculation of the threshold is independent of the received signal. For a good detection algorithm, should be high and
should be low. The choice of the threshold is a comprise between the and .
2.1
Calculation of Threshold for the RDM
Method
Since we have no information on the received signal (actually we even do not know if there is signal or not), it is difficult to set the threshold based on the . Hence, we choose the threshold based on the . For the proposed statistical test the threshold is given by
(5)
3.
PREVIOUS DETECTION METHODS
3.1 Energy Detection Algorithm
Energy detection is the basic sensing method, which was first proposed in [9] and further studied by others [5, 6, 7, 10]. It does not need any information of the signal to be detected and is robust to unknown dispersive channel. The Energy detection compares the average power of the received signal with the noise power to make a decision. To guarantee a reliable detection, the threshold must be set according to noise power and the number of samples [5, 6, 7]. The proposed method does not rely on the noise power to set the threshold. When the source signal is iid, it has been proved that the energy detection is optimal [8]. Let be the average energy of the received signals, that is,
Energy detection compares with a noise power to make a decision. If , signal exists; otherwise signal does not exists. For given , the threshold can be obtained as (for large N)
(7)
Where (8)
3.2
Covariance Based Detection Algorithm
Covariance based detection (CBD) exploits the fact that the statistical covariance matrixes of received signal and noise are usually different, thus the distinguishing property can be used to detect whether the primary user exists or not. The covariance-based detections directly use the elements of the covariance matrix to construct detection methods, which can reduce computational complexity, as compared to other blind algorithms. This technique is based on measuring the whiteness or correlation level of the covariance matrix. In practice, there are only a limited number of received signal samples. Hence, the detection methods are based on the sample covariance matrix,
Where
are the sample autocorrelations of the received signal r( ) and L is the smoothing factor. The CAV is one of the CBD algorithms and its test statistics is constructed directly from the entries of the sample covariance matrix and is given as
Where are the elements of the sample covariance matrix
The presence of the signal is based on and the threshold . If , signal exists; otherwise signal does not exists. For the CAV method threshold is given [18] as
Where N = sample size, L = smoothing factor and = required probability of false alarm.
Here threshold is related to the N, L and required .
3.3
Eigenvalue Based Detection Algorithms
This is a new detection method presented to research community in September 2007 [21]. The core of this method is the ratio of the eigenvalues of the covariance matrix of the received signal. Actually there are two types of eigenvalue based detection methods: maximum-minimum eigenvalue (MME) detection, which compares the ratio of the maximum eigenvalue and the minimum eigenvalue with a threshold; energy with minimum eigenvalue (EME) detection, which compares the ratio of the average energy and the minimum eigenvalue with a threshold. The first method doesn't need a-prior knowledge like the second that needs to know the SNR value. Thus the maximum-minimum approach can overcome the noise uncertainty problem and also retains the advantages of the energy approach. In this way the method detects signals with unknown source, unknown channel and unknown noise power. The drawback is its complexity.
To use eigenvalue-based sensing algorithm, we need to compute the eigenvalues of the sample covariance matrix,
. The test statistics for MME
and EME methods based on the sample covariance matrix eigenvalues are given [20] as
power to make a decision. When L=1, the method turns to the energy detection. Hence MED method can be treated as an extension of the energy detection. The thresholds for MME, EME [20] and MED [17] sensing methods are given as
(17) (18) (19) Table 1 is the numerical table for the tracy–widom distribution of order 1 which is used to compute the at certain points.
For example Unlike energy detection, the threshold in eigenvalue based methods is not related to noise power. The threshold can be pre-computed based only on N, L and irrespective of signal and noise.
4.
SIMULATIONS
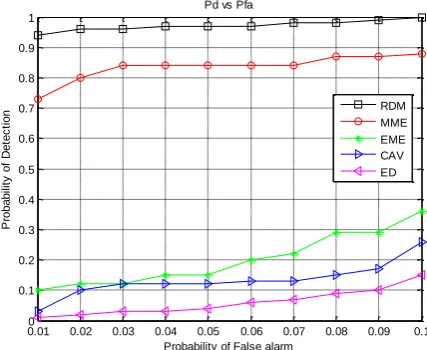
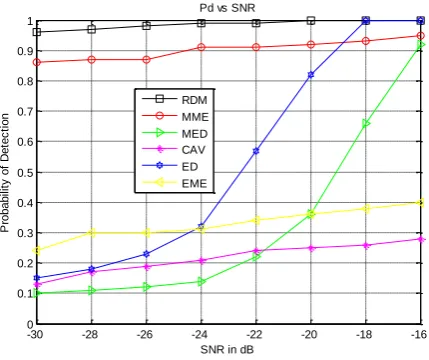
In the following we will give some simulation results using wireless microphone signal and iid signals. The sampling frequency of the signal is 22.05 khz. The capturing time of the signal is 22 seconds. In order to use the signals for simulating the algorithm at very low SNR, we need to add additive white Gaussian noise to obtain various SNR levels. To evaluate the performance of the proposed RDM sensing algorithm we have simulated this in MATLAB along with the MME, EME [20], MED [17], CAV [18,19] and ED [4] sensing methods. Figure 1 gives the for various SNR levels. The performance of the RDM method is much better than ED, MME, EME, MED and CAV algorithms at low SNR level. The Performance of these methods at different sample sizes and fixed SNR=-20 dB are given in figure 2. Figure 3 gives the simulation results for at various values of (0.01 to 0.1). The simulation results for at various SNR levels and at different sample sizes for detecting the iid signal is shown in figure 4 and figure 5 respectively. From figure 4 it is clear that ED algorithm is optimal for iid signal. The performance of the MED and CAV methods degrades slightly compared to the ED algorithm. In summary, the simulation result shows that the proposed statistical test is approaches to MME for iid signal and much better than ED, CAV, EME and MED methods.
Figure 1: vs SNR for Wireless microphone signal with N = 2 Lac. and
Figure 2: vs Sample Size for Wireless microphone signal with SNR= - 20 dB and
Figure 3: vs for Wireless microphone signal with SNR = - 20 dB
-30 -25 -20 -15 -10 -5 0 5 10
0 0.1 0.2 0.3 0.4 0.5 0.6 0.7 0.8 0.9 1
SNR in dB
P ro b a b ili ty o f D e te c ti o n
Pd vs SNR
RDM MME MED CAV ED EME
0.2 0.4 0.6 0.8 1 1.2 1.4 1.6 1.8 2
x 105 0 0.1 0.2 0.3 0.4 0.5 0.6 0.7 0.8 0.9 1 Sample Size P ro b a b ili ty o f D e te c ti o n
Pd vs Sample Size
RDM MME CAV ED EME
0.010 0.02 0.03 0.04 0.05 0.06 0.07 0.08 0.09 0.1
0.1 0.2 0.3 0.4 0.5 0.6 0.7 0.8 0.9 1
Probability of False alarm
P ro b a b ili ty o f D e te c ti o n
Pd vs Pfa
[image:4.595.322.560.78.254.2] [image:4.595.53.285.150.322.2] [image:4.595.326.544.295.475.2] [image:4.595.329.543.527.702.2]Figure 4: vs SNR for iid signal with Ns=100000 and
Figure 5: vs Sample Size for iid signal with SNR= - 22 dB and
5.
CONCLUSIONS
In this paper, a sensing algorithm based on random data matrix generated from the received signal samples (we call it as RDM method) has been proposed. The normal distribution function is used to set the threshold for the given probability of false alarm. The RDM method can be used for various signal detection applications without knowledge of signal, channel and noise. Simulations analysis has shown that the performance of the RDM algorithm is much better than ED, MED, CAV, EME and MME sensing algorithms at very low SNR. The Wireless Microphone signals and iid signals have been used to verify the proposed method.
6.
REFERENCES
[1] J. Mitola and G. Q. Maguire, “Cognitive radios: making software radios more personal,” IEEE Personal Communications, vol. 6, no. 4, pp. 13–18, 1999.
[2]
S. Haykin, “Cognitive radio: brain-empowered wireless
communications,” IEEE Trans. Communications, vol. 23, no. 2, pp. 201–220, 2005.[3] FCC, “Facilitating opportunities for flexible, efficient, and reliable spectrum use employing cognitive radio technologies, notice of proposed rule making and order,” in FCC 03-322, Dec. 2003.
[4] 802.22 Working Group, IEEE P802.22/D0.1 Draft Standard for Wireless Regional Area Networks. http://grouper.ieee.org/groups/802/22/, May 2006.
[5] Parthapratim De and Ying - Chang Liang, “Blind Spectrum Sensing Algorithms for Cognitive Radio Networks,”IEEE Transactions on Vehicular Technology, vol. 57, no. 5, September 2008
[6] R. Tandra and A. Sahai, “ Fundamental limits on detection in low SNR under noise uncertainty,” in Proc. 2005 Int. Conf. Wireless Netw., Commun., Mobile Comput., Jun. 13–16, 2005, vol. 1, pp. 464–469.
[7] A. Sonnenschien and P. M. Fishman, “Radiometric detection of spread-spectrum signals in noise of uncertain power,” IEEE Trans. Aerosp. Electron. Syst., vol. 28, no. 3, pp. 654–660, Jul. 1992.
[8] A. Sahai and D. Cabric, “Spectrum sensing: fundamental limits and practical challenges,” in Proc.IEEE International Symposium on New Frontiers in Dynamic Spectrum Access Networks (DySPAN), (Baltimore, MD), Nov. 2005.
[9] R. Tandra and A. Sahai, “Fundamental limits on detection in low SNR under noise uncertainty,” in Wireless Com 2005, (Maui, HI), June 2005.
[10] S. M. Kay, Fundamentals of Statistical Signal Processing: Detection Theory, vol. 2. Prentice Hall, 1998.
[11] H. Urkowitz, “Energy detection of unkown deterministic signals,” Proceedings of the IEEE, vol. 55, no. 4, pp. 523–531, 1967.
[12] D. Cabric, A. Tkachenko, and R. W. Brodersen, “Spectrum sensing measurements of pilot,energy, and collaborative detection,” in Military Comm. Conf. (MILCOM), pp. 1–7, Oct.2006.
[13] H. S. Chen, W. Gao, and D. G. Daut, “Signature based spectrum sensing algorithms for IEEE 802.22 WRAN,” in IEEE Intern. Conf. Comm. (ICC), June 2007.
[image:5.595.68.283.76.256.2][14] W. A. Gardner, “Exploitation of spectral redundancy in cyclostationary signals,” IEEE Signal Processing Magazine, vol. 8, pp. 14–36, 1991.
TABLE 1: NUMERICAL TABLE FOR THE TRACY – WIDOM DISTRIBUTION OF ORDER 1
0.001 0.005 0.01 0.02 0.03 0.05 0.07 0.08 0.09 0.1 0.3 0.6 0.9
3.2724 2.42 2.023 1.6 1.33 0.97 0.73 0.62 0.53 0.45 -0.59 -1.58 - 2.78
-30 -28 -26 -24 -22 -20 -18 -16
0 0.1 0.2 0.3 0.4 0.5 0.6 0.7 0.8 0.9 1
SNR in dB
P
ro
b
a
b
ili
ty
o
f
D
e
te
c
ti
o
n
Pd vs SNR
RDM MME MED CAV ED EME
0.2 0.4 0.6 0.8 1 1.2 1.4 1.6 1.8 2
x 105 0
0.1 0.2 0.3 0.4 0.5 0.6 0.7 0.8 0.9 1
Sample Size
P
ro
b
a
b
ili
ty
o
f
D
e
te
c
ti
o
n
Pd vs Sample Size
[image:5.595.68.284.304.488.2] [image:5.595.61.528.724.767.2][15] W. A. Gardner, W. A. Brown, III, and C.-K. Chen, “Spectral correlation of modulated signals: part ii digital modulation,” IEEE Trans. Communications, vol. 35, no. 6, pp. 595–601, 1987.
[16] N. Han, S. H. Shon, J. O. Joo, and J. M. Kim, “Spectral correlation based signal detection method for spectrum sensing in IEEE 802.22 WRAN systems,” in Intern. Conf. Advanced Communication Technology, (Korea), Feb. 2006.
[17] Y. Zeng, Choo Leng Koh, and Y. Liang, “Maximum eigenvalue detection: theory and application,” IEEE International Conference on Communications, Beijing, 2008, pp. 4160-4164.
[18] Yonghong Zeng and Ying-Chang Liang, “Spectrum Sensing Algorithms for Cognitive Radio Based on Statistical Covariances,” IEEE Transactions on Vehicular Technology, vol. 58, pp.1804-1815, May 2009. [19] Y. Zeng and Y. Liang, “Covariance Based Signal
Detections for Cognitive Radio,” Proc. IEEE Int. Symp. on New Frontiers in Dynamic Spectrum Access Networks, DySPAN, April 2007.
[20] Y. Zeng and Y.-C. Liang, “Eigenvalue-based sectrum sensing algorithms for cognitive radio,” IEEE Trans. Commun., vol. 57, no. 6, pp. 1784– 1793, Jun. 2009. [21] Yonghong Zeng and YingChang Liang, Sep2007,
Maximum-minimum eigenvalue detection for cognitive radio, Singapore: IEEE 18th Int.Symp.Pers.Indoor Mobile Radio Commun.
AUTHOR’S PROFILE
Rohitha Ujjinimatad received B.E. degree in Electronics and Communication Engineering from Bangalore University and M.Tech in Digital Electronics from VTU, Belgaum. He is student member of IEEE and life member of ISTE.
Currently, he is doing Ph.D in VTU and he is working as a Associate Professor in ECE Department at Ballari Institute of Technology, Ballari, India. His area of research is Spectrum sensing in Cognitive Radio Networks. He has two national and one International Conference Papers to his credit.
Siddarama R Patil received B.E. degree in Electronics and Communication Eng., from Gulbarga University, the M.Tech in Telecommunication Engg and Ph.D from Indian Institute of Technology, Khargpur, India in 1999 and 2009 respectively.
Currently, he is the professor and head of the ECE Department at Poojya Doddapa Appa College of Engineering, Gulbarga, India. He has Published more than 12 research papers in various national and international journals and conferences. He has guided many B.E. and M.Tech Projects, and guiding 5 Ph.D students. His current research includes Information Theory and Coding, Turbo Codes, LDPC codes, Iterative decoding algorithms, wireless sensor network, Mobile Adhoc Network, Cognitive Radio.