Community Detection in Complex Network via BGLL
Algorithm
Pooja Chaturvedi
M.Tech(CSE)
ASET,Amity University
Lucknow
Mousumi Dhara
Research Scholar
IT-BHU
Varanasi
Deepak Arora, PhD.
Assistant Professor
ASET,Amity University
Lucknow
ABSTRACT
A large number of networks in nature, society and technology are defined by a mesoscopic level of organization, in which groups of nodes form tightly connected units, called communities, that are sparsely inter-linked to each other .Identifying this community structure is one of the most important problems in understanding of functions and structures of real world complex systems, which is still a challenging task. Various methods proposed so far are not efficient and accurate for large networks which comprise of millions of nodes because of their high computational cost. In this manuscript we will provide the implementation and behavioral analysis of BGLL algorithm for determining the structure of complex networks. This method is a variant of hierarchical agglomerative clustering approach, which finds the communities which are nested within one another. This method emphasizes on the idea of building the communities by combining the initial partition into super networks by repeatedly optimizing the modularity.
In this work we will implement the BGLL Algorithm on various large networks which exhibit the community structure .We will also determine the optimal modularity at every pass and determine the hierarchical structure of large complex systems that comprise of millions of nodes. We will also provide a brief comparison of BGLL algorithm with some methods.
General Terms
Graph Theory, Data Mining.Keywords
Complex Networks, Community Structure.
1.
INTRODUCTION
Representation of various real world systems as graphs can give deep insight to the understanding the structure and functions of complex networks. Identification of Community structure has gained a lot of attention among the researchers, along with the other properties of these networks such as small world effect, scale free, power-law degree distribution. A network is said to possess community structure if the edge density within the community is sufficiently larger than between the communities.
Clustering is considered as an important task in the study of complex network’s properties. Merriam Webster 2008 defines clustering as a ―statistical classification technique for determining whether the elements of a cluster fall into different groups by ensuring quantitative comparison of
divided in two groups: (i) Hierarchical Clustering approach and (ii) Partition Clustering approach. Hierarchical clustering algorithms recursively find interconnected clusters in either Agglomerative manner(Bottom-up) or Divisive manner(Top-Down) Berkhin (2009) found six more approaches in addition to above two groups :1.Grid-Based Methods 2.Methods based on co-occurrence of categorical data 3.Constraint Based Clustering 4. Clustering algorithms used in machine learning 5.Scalable Clustering algorithms 6.Algorithms for High Dimensional Data. Clustering founds its application in various fields including information retrieval, image segmentation, character recognition, VLSI design, computer graphics and gene analysis. Graph Clustering applications include: monitoring computer networks for administration purposes ,visualizing knowledge bases to support human understanding, clustering metric data etc.
2.
RELATED WORK
Newman and Girvan’s work in 2001 suggested that complex systems posses the property of community structure. Identification and detection of community structure was originated as the extension of the problem of graph partitioning. Graph partitioning problem comprised of the division of graph nodes into predetermined number of partitions such that the number of edges between the groups is as few as possible. The number of edges between the groups is called as cut size. Kernighan Li approach is the most popular method for this problem. Spectral bisection is another approach for this problem, which is based on the Laplacian matrix. Another approach for graph partitioning is based on the min cut max flow method proposed by Ford and Fulkerson. Min cut and max flow approach is used in determining communities in the web networks by Flake et.al. Graph can be partitioned into groups by measuring the conductance which affine to the cut size of the graph. Conductance is computed as:
φ(∁)=(c(∁,g/∁))/(min(k_∁,k_(g/∁)) )
Where c(∁,g\∁)is the cut size of ∁,and k_(g\∁) are the total degrees of ∁ and of the rest of the graph g\∁ ,respectively.
Newman proposed a method of community detection which was based on the idea of betweenness measure. The betweenness was calculated for each pair of edges and edges with the maximum betweenness removed. This process was repeated until no edge remains. Clauset, Newman and Moore proposed the fast modularity approach for community detection which basically finds the best pair of communities to merge and what will be the criteria to stop merging the communities. In this method three data structures were maintained:
1. A sparse matrix Q containing the modularity increment for every pair of communities having a common edge.
2 A max heap consists of the maximum element of each row of Q.
3. An ordinary vector array a.
The method starts by calculating the initial values of matrix Q and with the help of following formulas:
∆Qij=
1 2m−
kikj
(2m)2, 𝑖𝑓 𝑖 𝑎𝑛𝑑 𝑗 𝑎𝑟𝑒 𝑐𝑜𝑛𝑛𝑒𝑐𝑡𝑒𝑑
0, otherwise
a
i=
k
i2m
Then we select the largest element from each row of the matrix and merge the related communities. This process is repeated until there is one community remains. The running time of this method is O(mdlog n).The extension of CNM algorithm was proposed by Xu Liu in their seminal paper, where they used an additional parameter head-size with the heap data structure. The head size controlled the randomness in the search path and search strategies. Pons and Latapy used the idea of random walks across the network for community detection. Instead of using modularity as similarity measure this method used the node similarity measure based on short walks. This method was also an instance of hierarchical aggregation. Walk trap method has the complexity of O(mn)2
which could be reduced to O(n4 ).
Markov clustering algorithm was implemented as a simulation of flow through the network. The underlying idea of this method is that the random walker will spend more time inside the same community. The Markov clustering algorithm has the complexityO(n3 ). Karsten and Nitesh V.Chawla proposed
a method based on random walks. It assumed that a random walker with predetermined number of steps is likely walk inside a single community. The idea of this method was to compute many random short walks and keep tracks of the visited nodes in a single walk.
3.
BGLL ALGORITHM
Overview of the method
This community detection algorithm is mainly known as Louvain Method, named after its co-authors location. This method gained a lot of attention among the researchers because of its computational speed and accuracy of the communities detected. The idea of this method was given by Etienne Lefebvre in his Master’s Thesis. This method was first improvised and studied by Blondel et al in their paper
―Fast Unfolding of Communities‖. They concluded in their study that this method was fast in determining the community structure for large networks. It efficiency was also tested on a large data set of Belgian Phone network and on adhoc-networks. It is a simple, efficient and fast method which has been tested on large networks consisting of millions of nodes. This method is considered as one of the most popular methods for community detection. Louvain method is considered as better method than other methods because it computes high modularity partitions and hierarchies of large networks in quick time. This method is more important because of its independence from the resolution limit problem, which was the major concern for all the other methods.
BGLL algorithm consists of two phases— In the first step each node belongs to its own cluster. The clusters are formed more specifically by finding the modularity change by moving a node into the group of neighborhood node. A node is placed into that group for which the modularity gain is positive and maximum. This process is applied for all nodes until there is no improvement possible in the value of modularity. In this modularity gain is computed by:
∆Q=[ +2kin i ,in
2m -( +ki tot
2m ) 2]-[ in
2m-( tot
2m) 2-(kii
2m) 2]
Where in is the sum of weights of the link inside C, tot s the sum of the weights of the links incident to nodes in C,ki
is the sum of the weights incident to node C,ki,in is the sum of
the weights of the links from node i to node in C, m is the sum of the weights of all the links in the network.
The second phase comprise of building a new network by considering the communities found in first phase as nodes. The weight of the link between the two nodes is given by the sum of weights of the links in the communities. The two phases combined constitute a pass. After each the number of meta-communities decreases every time. The passes are repeated until no improvement can be achieved and the maximum modularity is achieved. The hierarchy of the structure is determined by the number of passes. The advantage of this method is that the calculation of modularity gain is simple in this method. The algorithm provides high modularity partition and hierarchical structure can be visualized at different resolution. Thus this method eliminates the resolution limit problem of earlier methods.
The algorithm consists of three main functions.
1. Convert: This function takes the graph in .txt format
describing the nodes as a pair of source and destination nodes, as input and converts the graph in binary format.
2. Community: This is the heart of the algorithm, where the
communities are computed according to the two phases as described above.
3. Hierarchy: This function describes the hierarchical
structure of the networks in terms of number of levels and number of nodes at each level.
It is also possible to find the belongingness of nodes by using the function node2_comm_level at any level.
4.
Experimental Results
4.1 Tests on Real Networks
Table 2 represents the maximum modularity achieved and the number of communities detected by applying the algorithm on various real world networks.
4.2 Hierarchical Organization of networks
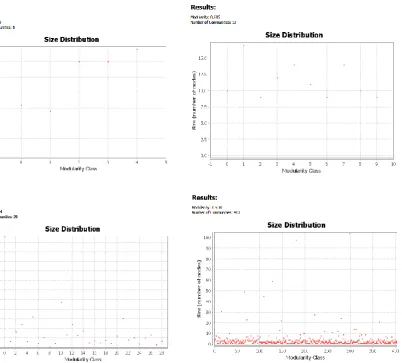
Table 3 represents the hierarchical structure of the networks as obtained after the application of the algorithm. It shows the number of nodes decrease in subsequent passes, indicating that nodes are combined to form a super-network of the nodes found in earlier pass. The process stops when there is no change in modularity i.e. when the optimum modularity is achieved.4.3 Size distribution with modularity
change
Figure 1 represents the size distribution of the nodes with the modularity class.
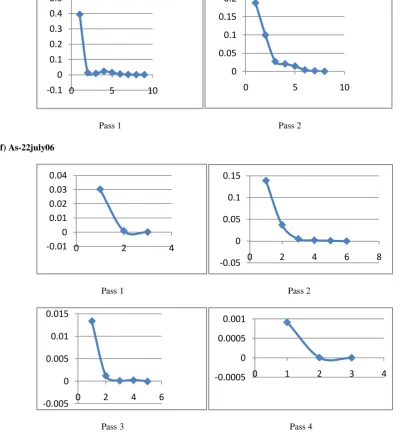
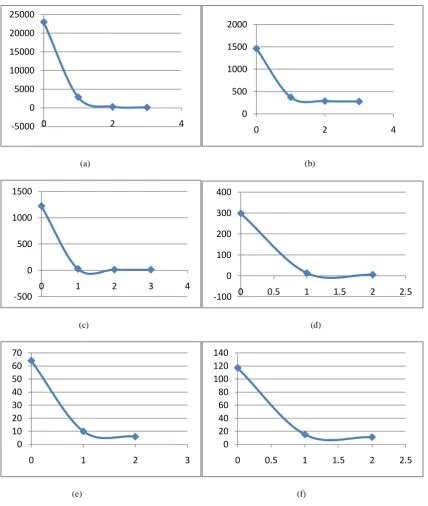
4.4 Modularity Change in various passes
Figure 2 represents the modularity change in the respective pass. Horizontal axis represents the number of pass and vertical axis represents the modularity change.4.5 Community Structure
Figure 3 provides the visualization of the communities detected by the algorithm. We have used Gephi software for the visualization of communities.
4.6 Hierarchical level of networks
Figure 4 represents the hierarchical level in the form of drastic change in the number of nodes after few passes. The hierarchical level obtained provides the facility to have a deep insight to the network structure at multiple resolution.
5. CONCLUSION AND DISCUSSION
Graph partitioning approaches are based on the idea of maximum flow and minimum cut. It also imposes the constraint that clusters should be of equal size. This problem is known as minimal bisection problem. Studies have showed that finding the partitions of all equal size is a NP-hardproblem. Kerninghan Li algorithm is the most popular method used for graph partitioning. It finds the random partition of predefined size. The subsets having equal number are swapped in the groups. After the swapping the group with the maximum modularity is selected. This method performs in quick time if there are a limited number of swaps.
Hierarchical clustering approaches are very popular for graph clustering. They can be either agglomerative or divisive. The problem of these methods is that they don’t discriminate the partitions so well. Also as they don’t consider neighborhood, so there may be the possibility of considering a node with a single neighbor as the separate clusters. A main drawback of agglomerative hierarchical clustering method is that it does not scale well, i.e. it doesn’t perform accurately for large networks. If points are scattered ins space then distance can be used as a dissimilarity measure and the method runs in O(n2)
for single linkage, O(n2log n) for complete and average
linkage schemes. For graph clustering, where distance is not specifically defined these methods may have larger complexity. Another approach for graph clustering is spectral clustering, which is based on the computation of first k Eigen vectors of a Laplacian Matrix, which becomes practically difficult for large graphs.
Newman’s betweenness method is divisive clustering approach. It is based on the idea of calculating the betweenness between each pair of edges. Here betweenness is referred to as the shortest distance between the edges. It works by removing the edge with the maximum betweenness and continues until all the edges have been taken into consideration. This algorithm has a drawback of large computation time, as it take the time complexity of the order of O(m2n) or O(n3) for a large sparse graph.
[image:3.595.63.531.520.737.2]Newman defined a new parameter to define the quality measure of the partition, which is known as modularity. Newman also proposed a new approach of graph clustering which was based on modularity optimization.
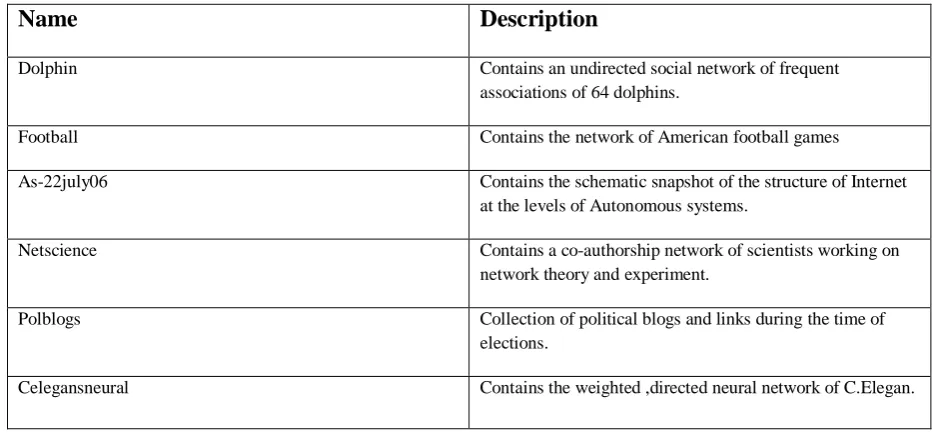
Table 1: Description of the data sets on which BGLL algorithm have been tested
Name
Description
Dolphin Contains an undirected social network of frequent
associations of 64 dolphins.
Football Contains the network of American football games
As-22july06 Contains the schematic snapshot of the structure of Internet
at the levels of Autonomous systems.
Netscience Contains a co-authorship network of scientists working on
network theory and experiment.
Polblogs Collection of political blogs and links during the time of
elections.
Table 2.Table represents the optimal modularity achieved in each networks and the number of communities detected.
Name No. of Nodes No. of Links Weights Modularity Communities
Dolphins 64 160 320 0.524531 5
Football 117 614 1228 0.605156 10
As-22july06 22965 48437 96874 0.660659 29
Netscience 1463 2743 5486 0.959522 403
Polblogs 1225 16717 33434 0.426983 277
Celegansneural 298 2149 4298 0.393309 5
Fig 2: Community structure of real world networks---a) Dolphins b) Football c) Netscience d) Polblog e) Celegansneural.
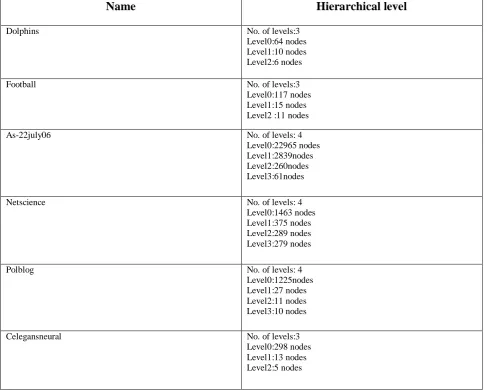
Table 3 : Hierarchical level of netwroks with shrinking nodes.From this table we may conclude that the number of passes is at most 5.
Name
Hierarchical level
Dolphins No. of levels:3
Level0:64 nodes Level1:10 nodes Level2:6 nodes
Football No. of levels:3
Level0:117 nodes Level1:15 nodes Level2 :11 nodes
As-22july06 No. of levels: 4
Level0:22965 nodes Level1:2839nodes Level2:260nodes Level3:61nodes
Netscience No. of levels: 4
Level0:1463 nodes Level1:375 nodes Level2:289 nodes Level3:279 nodes
Polblog No. of levels: 4
Level0:1225nodes Level1:27 nodes Level2:11 nodes Level3:10 nodes
Celegansneural No. of levels:3
a) Dolphins Network
Pass 1 Pass 2 b) Football Network
Pass 1 Pass 2 c) Netscience
Pass 1 Pass 2 Pass 3 d) Polblog
Pass 1 Pass 2 Pass 3
-0.1
0
0.1
0.2
0.3
0.4
0
2
4
6
0
0.5
1
1.5
2
2.5
0
0.5
1
1.5
-0.1
0
0.1
0.2
0.3
0.4
0
2
4
6
0
0.5
1
1.5
2
2.5
0
0.5
1
1.5
-0.5
0
0.5
1
0
5
10
-0.05
0
0.05
0.1
0
2
4
0
1
2
3
0
0.5
1
1.5
0
0.1
0.2
0.3
0
10
0
1
2
3
0
1
2
0
1
2
3
e) Celegans Neural
Pass 1 Pass 2 f) As-22july06
Pass 1 Pass 2
[image:8.595.54.455.108.544.2]
Pass 3 Pass 4
Figure 2 Modularity Change in various passes in networks
-0.1
0
0.1
0.2
0.3
0.4
0.5
0
5
10
0
0.05
0.1
0.15
0.2
0
5
10
-0.01
0
0.01
0.02
0.03
0.04
0
2
4
-0.05
0
0.05
0.1
0.15
0
2
4
6
8
-0.005
0
0.005
0.01
0.015
0
2
4
6
-0.0005
0
0.0005
0.001
(a) (b)
(c) (d)
[image:9.595.54.483.67.574.2](e) (f)
Figure 3: Hierarchical level of networks with shrinking nodes ---a) as-22july06 b) netscience c) polblogs d) celegansneural e) dolphins f) football. In this graph horizontal axis represents the number of pass and vertical axis represents the number of
nodes.
In this method a matrix describing the modularity change between two nodes i and j was maintained. The two communities are merged if they have the highest modularity change. This method was now able to perform clustering for large network, But later Clauset et.al. work proposed that the calculation of modularity change required many useless operations in between, due to the sparsity of adjacency matrix, hence increasing the time complexity. Clauset introduced max-heap to maintain these updates. The greedy modularity optimization ignores the communities of small size and it
modularity is always computed from the initial graph topology, operating on supergraphs enables one to consider the variations of modularity for partitions of the original graph after merging and/or splitting of groups of vertices. Therefore, at some iteration, modularity cannot increase any more, and the algorithm stops. The technique is more limited by storage demands than by computational time. The latter grows like O(m), so the algorithm is extremely fast and graphs with up to
109 edges can be analyzed in a reasonable time on current
computational resources. The modularity maxima found by
-5000
0
5000
10000
15000
20000
25000
0
2
4
0
500
1000
1500
2000
0
2
4
-500
0
500
1000
1500
0
1
2
3
4
-100
0
100
200
300
400
0
0.5
1
1.5
2
2.5
0
10
20
30
40
50
60
70
0
1
2
3
0
20
40
60
80
100
120
140
the method are better than those found with the greedy techniques by Clauset et al. and Wakita and Tsurumi. One thing to be note about our method is that the outcome depends on the order in which the nodes are considered. Although the order doesn’t affect the modularity obtained in each pass, but it may affect the computation time. So in order to enhance the computation time, some threshold of the modularity is to be considered as stopping criteria.
The hierarchical level of networks is determined by the number of passes. From the results, we may conclude that the number of passes is generally a small number. The experimental result shows that the algorithm is extremely fast, as the complexity of this method is linear for typical and sparse data-sets.
6. FUTURE WORK
In this work we have tested the efficiency of BGLL on various large real networks. The limitation of this method was the storage of networks in the main memory than the computation time. We have also found that our algorithm performs well than earlier methods in terms of modularity optimization and computation time. The speed of this algorithm can be further increased by stopping the first phase when the certain threshold of the modularity is achieved. We can also increase the computation speed by removing the nodes of degree 1 from the network initially and adding them further after the community computation.
BGLL algorithm only detects the disjoint communities, whereas in real networks nodes may belong to more than one community. In the future this algorithm may be used for calculating the initial partition of network and further constraints may be applied to identify and analyze the overlapping communities. Also our method doesn’t detect the hubs and outliers in the networks. Hubs are defined as the nodes which provide the link between the two communities,whereas outliers are the nodes that are marginally connected to the communities. So the method can be further refined to detect the hub and outliers.
7. ACKNOWLEDGEMENT
We are very thankful to Mr. Aseem Chauhan, Additional President, Amity University, Lucknow, Maj. Gen. K.K. Ohri, AVSM (Retd.), Director General, Amity University, Lucknow, India, for providing excellent computation facilities in the University campus. We also pay our regards to Prof. S.T.H. Abidi, Director and Brig. U.K. Chopra,Deputy Director, Amity School of Engineering, Amity University, Lucknow for giving their moral support and help to carry out this research work. We are very thankful to Blondel et. Al and Newman et al. for their work as it provides us the good understanding of the community detection concept.
8. REFERENCES
[1] L. Euler, Solutio problematis ad geometriam situs pertinentis, Commentarii Academiae Petropolitanae 8 (1736) 128-140.
[2] R. Albert, A.-L. Barabási, Statistical mechanics of complex networks, Rev. Mod. Phys. 74 (1) (2002) 47-97. [3] M.E.J. Newman, The structure and function of complex networks, SIAM Rev. 45 (2) (2003) 167-256.University Press, Cambridge, UK, 2008.
[4] P. Erdös, A. Rényi, On random graphs. I., Publ. Math. Debrecen 6 (1959) 290297.
[5] S. Fortunato, C. Castellano, Community structure in graphs, in: R.A. Meyers (Ed.), Encyclopedia of Complexity and Systems Science, vol. 1, Springer,Berlin, Germany, 2009, eprint arXiv:0712.2716.
[6] G.W. Flake, S. Lawrence, C. Lee Giles, F.M. Coetzee, Self-organization and identification of web communities, IEEE Computer 35 (2002) 6671.
[7] R.S. Weiss, E. Jacobson, A method for the analysis of the structure of complex organizations, Am. Sociol. Rev. 20 (1955) 661668.
[8] S.A. Rice, The identification of blocs in small political bodies, Am. Polit. Sci. Rev. 21 (1927) 619627.
[9] G.C. Homans, The Human Groups, Harcourt, Brace & Co, New York, 1950.
[10] M.E.J. Newman, M. Girvan, Finding and evaluating community structure in networks, Phys. Rev. E 69 (2) (2004) 026113.
[11] E.A. Leicht, M.E.J. Newman, Community structure in directed networks, Phys. Rev. Lett. 100 (11) (2008) 118703.
[12] M. Latapy, P. Pons, Lect. Notes Comput. Sci. 3733 (2005) 284293.
[13] B.H. Good, Y. de Montjoye, A. Clauset, The performance of modularity maximization in practical contexts, eprint arXiv:0910.0165.
[14] M.E.J. Newman, Finding community structure in networks using the eigenvectors of matrices, Phys. Rev. E 74 (3) (2006) 036104.
[15] B.W. Kernighan, S. Lin, An efficient heuristic procedure for partitioning graphs, Bell Syst. Tech. J. 49 (1970) 291307.
[16] G.W. Flake, S. Lawrence, C.L. Giles, Efficient identification of web communities, in: Sixth ACM SIGKDD International Conference on Knowledge Discovery and Data Mining, ACM Press, Boston, USA, 2000, pp. 150160.
[17] M.E.J. Newman, A measure of betweenness centrality based on random walks, Soc. Netw. 27 (2005) 3954. [18] M.E.J. Newman, Analysis of weighted networks, Phys.
Rev. E 70 (5) (2004) 056131.
[19] M.E.J. Newman, Fast algorithm for detecting community structure in networks, Phys. Rev. E 69 (6) (2004) 066133.
[20] A. Clauset, M.E.J. Newman, C. Moore, Finding community structure in very large networks, Phys. Rev. E 70 (6) (2004) 066111.
[21] K. Wakita, T. Tsurumi, Finding community structure in mega-scale social networks, eprint arXiv:cs/0702048. [22] V.D. Blondel, J.-L. Guillaume, R. Lambiotte, E.
Lefebvre, Fast unfolding of communities in large networks, J. Stat. Mech. P10008 (2008).
[24] M.E.J. Newman, From the cover: Modularity and community structure in networks, Proc. Natl. Acad. Sci. USA 103 (2006) 85778582.
[25] M.E.J. Newman, The structure of scientific collaboration networks, Proc. Natl. Acad. Sci. USA 98 (2) (2001) 404409.
[26] J. G. White, E. Southgate, J. N. Thompson, and S. Brenner, "The structure of the nervous system of the nematode C. Elegans", Phil. Trans. R. Soc.London 314, 1-340 (1986).
[27] D. J. Watts and S. H. Strogatz, "Collective dynamics of `small-world' networks", Nature 393, 440-442 (1998). [28] D. Lusseau, K. Schneider, O. J. Boisseau, P. Haase, E.
Slooten, and S. M. Dawson, The bottlenose dolphin community of Doubtful Sound features a large proportion of long-lasting associations, Behavioral Ecology and Sociobiology 54, 396-405 (2003).
[29] D. Lusseau, The emergent properties of a dolphin social network,Proc. R. Soc. London B (suppl.) 270, S186-S188 (2003).
[30] D. Lusseau, Evidence for social role in a dolphin social network,Preprint q-bio/0607048 (http://arxiv.org/abs/q-bio.PE/0607048).
[31] M. Girvan and M. E. J. Newman,Community structure in social and biological networks,Proc. Natl. Acad. Sci. USA 99, 7821-7826 (2002).
[32] M. E. J. Newman, SIAM Review 45, 167-256 (2003) and S. Boccaletti et al., Physics Reports 424, 175-308 (2006),Lada A. Adamic and Natalie Glance, "The political blogosphere and the 2004 US Election", in Proceedings of the WWW-2005 Workshop on the Weblogging Ecosystem (2005).
[33] Identifying and evaluating community structure in complex networks Karsten Steinhaeuser, Nitesh V. Chawla *University of Notre Dame, Department of Computer Science and Engineering, Interdisciplinary Center for Network Science and Applications (iCeNSA), Notre Dame, IN 46556, USAvan Dongen, S., 2000.
Graph Clustering by Flow Simulation, Ph.D. Thesis, University of Utrecht, Netherlands.
[34] Pons, P., Latapy, M., 2006. Computing communities in large networks using random walks. J. Graph Algorithms Appl. 10 (2), 191–218.
[35] M.E.J. Newman, The structure and function of complex networks‖.
[36] Zenklusen Rico,Complex networks:An overview. [37] Benjamin Lam,Data mining with clustering and
classification,springer,2007.
[38] Santo Fortunato ,Community detection in graphs, Physics Reports 486 (2010) 75-174.
[39] Xu Liu a, Jeffrey Yi-Lin Forrest a,b, Qiang Luoc, Dong-Yun Yi a,,∗ Detecting community structure using biased random merging.
[40] M.E.J Newman,The structure and function of complex networks, arXiv:cond-mat/0303516v1 [cond-mat.stat-mech] 25 Mar 2003.
[41] Milligan, G., Cooper, M., 1986. A study of the comparability of external criteria for hierarchical cluster analysis. Multivar. Behav. Res. 21 (4),441–458.
[42] Merrian Webster,Online Dictionary,2008.Cluster Analysis. http://www.merriam-webster-online.com. [43] Jain,A.K.,2009.Data Clustering :50 years beyond
k-means
,<http://dataclustering.cse.msu.edu/papers/jainDataCluste ringPRL09.pdf>.
[44] Steinhaus,H.,1956.Sur la division des corp materials en parties.Bull.Acad.Polon.Sci.,C1,III IV,801-804.
[45] Berkhin,P.,2009. Survey of clustering data mining techniques,http://www.ee.ucr.edu/barth/EE242/.