DenTrac: A Density based Trajectory Clustering Tool
Hazarath Munaga
(MHM Krishna Prasad) Dept. of CSE, UCEV_JNTUK,
Vizianagaram, AP, 535 003, INDIA.
M. D. R. Mounica Sree
Test Analyst Infosys Technologies, Hyderabad, AP, INDIA.
J. V. R. Murthy
Dept. of CSE UCE_JNTUK, Kakinada,
AP, 533 003, INDIA.
ABSTRACT
In this paper, we present a novel density based trajectory clustering technique for clustering and visualizing Spatio-temporal data to analyze the navigational behavior of moving entities, such as users, virtual characters or vehicles. For testing our proposal, we developed DenTrac (Density based Trajectory Clustering and visualization tool for Spatio-Temporal data), a tool designed to analyze the moving entities navigating in real as well as virtual environments. Such analysis allows the analyst to derive the information at a level of abstraction suitable to support (i) the evaluation of user spaces and (ii) the identification of the predominant navigation behavior of users. We demonstrate the effectiveness of our solution by testing the tool on data acquired by recording the movements of users navigating through a virtual environment.
Keywords
Data Mining, Density based Trajectory Clustering, Trajectory Visualization, Virtual Environment.
1.
INTRODUCTION
Undoubtedly one of the great challenges for computer science analysts is under-standing the human behavior. Widespread use of sensor networks and location aware devices has resulted in large amounts of Spatio-temporal datasets in a variety of different contexts. From the data mining point of view, Spatio-temporal data introduce new dimensions and, subsequently, novel issues in performing the analysis tasks. The number and size of these datasets continues to increase rapidly, making their manual analysis impossible. The analysis of moving entities is a crucial task in several application domains and different techniques have been proposed in the literature referring to data acquired both from real and virtual environments (hereinafter, VEs). In the literature there are two main categories of solutions: (i) trajectory clustering techniques to identify and classify relevant subsets from very large data repositories (e.g., recurrent or unique navigational behaviors), and (ii) visual techniques targeted at supporting the analysis by displaying trajectories in an effective way.
Authors [1] presented a variation of expectation maximization algorithm to cluster small sets of trajectories obtained from real environment. However, their method is a model-based approach and hence characterized by scalability problems. A novel method based on non-parametric statistics for clustering time series data has been proposed by [2]; authors tested their proposal on the dataset of mouse mammary gland development, showing that their solution is able (i) to match a manual clustering by a domain expert and (ii) to cluster groups of genes with known related functions. However, their
solution is based on number of time points, and as the number of time points increases, the number of trajectories increases exponentially and some cluster combining is required. Some of the authors [3] uses artificial neural networks for clustering trajectories. However, these solutions suffer from typical limitations of neural networks, such as hidden node complexity and the difficulty of modifying the network once it has been trained.
The second category of techniques for studying spatio-temporal data is based on visual analysis that ranges from approaches targeted at supporting the analysis of users interactions during the navigation on the Web, to solutions focused at highlighting navigation problems into VEs. Some of them [4] [5] [6] supports both non-aggregated and aggregated visualizations of users navigation; non-aggregated visualizations separately display the path followed by each moving entity, while aggregated visualizations employ various techniques for displaying the navigational behavior of groups of users. The latter solution is particularly effective when the analysis concerns huge number of different trajectories.
Ref. [7] proposed ViEWNet, a clustering and visualization tool for detecting and visualizing the hierarchies of dense areas on spatial network by monitoring the moving objects through the GPS receiver. They used color coded line and arrow drawings for visualizing the objects. However, it is based on hierarchical partitioning/clustering, and then it is sensitive to noise and outliers as well as difficulty in handling different shape (e.g., convex shape) and sized clusters [8]. [9] demonstrated the usage of trajectory clustering for selecting cluster heads which implicitly used to extenuate the life time of wireless sensor networks.
The previously discussed solutions can not answer queries (except [5]) like
"Which individuals of a population move together?" or "Find groups of entities that perform similar sequences of
changes or non-changes in their direction?"
2.
DENSITY BASED TRAJECTORY
CLUSTERING
Any clustering algorithm requires a dissimilarity method for calculating dissimilarity between trajectories. For example, [10] proposed the usage of Euclidean distance between time series of equal length as the measure of similarity and it has been generalized in [11] for subsequence matching. Here we used [12] for calculating dissimilarity between trajectories, since it is suitable for increasing dimensions and mainly designed for calculating dissimilarity between trajectories.
2.1
Algorithm
Density based clustering locates regions of high density that are separated from one another by regions of low density. DenTrac is inspired by the DBSCAN and DENCLUE density based clustering algorithms [13] [14]. Density based clustering algorithm and areas that are densely populated and combine the objects of the dense area into a cluster. These algorithms have the desirable properties of being able to determine the number clusters present in the data and being able to handle noise. We used the center based approach for finding the density.
2.2
Classification of Trajectories according
to Center based Density
We adopted the center based approach classification proposed by [8] [13] that allow us to classify a trajectory as being
in the interior of a dense region (a core trajectory), on the edge of a dense region (a border trajectory), or in a sparsely occupied region (a noise or outlier
trajectory). More specifically,
Core trajectories: These are in the interior of a density based cluster. A trajectory is a core trajectory if the number of trajectories within a given neighborhood around the trajectory as determined by the distance function and a user specified distance parameter, Eps, exceeds a certain threshold, MinTrajs, which is also a user specified parameter.
Border trajectory: A border trajectory is not a core trajectory, but falls within the neighborhood of a core trajectory. A border trajectory can fall within the neighborhoods of several core trajectories.
Noise or Outlier trajectory: A noise trajectory is any trajectory that is neither a core trajectory nor a border trajectory.
Based on the above classification, the DenTrac algorithm works as follows:
Any two core trajectories that are close enough, within a distance Eps of one another, are put in the same cluster. Likewise, any border trajectory that is close enough to a core trajectory is put in the same cluster as the core trajectory. (Ties may need to be resolved if a border trajectory is close to core trajectories from different clusters.) Noise trajectories are considered as outliers and are discarded.
2.3
Fixing MinTrajs and Eps parameters
Compute MinTrajs distance for all the trajectories and for some k (e.g. 3), sort them in increasing order, obtain the sharp change, or knee point of the curve, at the value of MinTrajs distance and x it as a Eps value.
Finding the knee point of a curve: Fixing the cluster size is a vital role in density based clustering algorithms. Some existing validity indices indicate the structure of data sets very well and contribute a lot to the problem. However, we can not directly obtain the correct number of clusters from these indices when they decrease or increase monotonously or only
have some significant local changes. In this case, the structure of the dataset can be revealed by using a good knee point detection method. The knee of a curve is loosely defined as the point of maximum curvature. In literature [15] [16] [17] [18], various methods to find the knee of a curve are:
1. The largest magnitude difference between the two points. 2. The largest ratio difference between the two points [15]. 3. The first data point with a second derivative above specified threshold [16].
4. The data point with the largest second derivative [17]. 5. The point on the curve that is farthest from a line fitted to the entire curve.
The above list is ordered from the methods that make a decision about the knee locally, to the methods that locate the knee globally. The first two methods use only single pairs of adjacent points to determine the knee location. The third and fourth methods use more than one pair of points, but still only consider local trends in the graph. The last two methods consider all data points at the same time. Local methods may work well for smooth, monotonically increasing/decreasing curves. However, they are very sensitive to outliers and local trends, which may not be globally significant. The fifth method takes every point into account, but only works well for continuous functions, and not curves where the knee is a sharp jump.
A straightforward approach is to take the difference of successive index values, e.g., calculating the difference between previous and current values of the index. There will be peaks at the points with significant local changes in the difference curve. It is also possible to consider more points of the curve in successive difference.
DiffFun(m)=F(m-1) + F(m+1) −2 * F(m) --- (1)
Where DiffFun is the difference function, F(m) is the index value and m is the current number of clusters. It takes use of the previous, afterward and current values simultaneously. The disadvantage of the successive difference method is that it only considers several points instead of the whole curve following the index to find only local changes without a global perspective. If there are several local changes, then it may give a wrong result.
Hence, here we adopted the angle based method proposed by [18]. As per authors suggestion, after calculating the successive difference using the above formula (1) to get the function difference DiffFun and detect n local significant changes by finding the first n minimum values in DiffFun. Here n = m/2 – 1 because at least 2 points can generate 1 trough. Sort the local minimum values in a decreasing order. Start from the points with bigger troughs; calculate the angle of those points by the following formula(2).
angle=atan (1/ |F(m)−F(m-1)|)+atan (1/|F(m+1)−F(m)|)---(2)
2.4
DenTrac
To support the analyst for analyzing the navigational behavior of users, the DenTrac provides:
a group of clusters, each one containing similar navigation behavior, and
a set of trajectories equal to the number of clusters, which is used for representing the behavior each cluster (hereinafter, representative trajectory).
1. the dissimilarity matrix is computed between all pairs of trajectories (using the dissimilarity algorithm [12])
2. trajectories are grouped into initial clusters using the initialization procedure (Table. 1)
3. for each cluster, a representative trajectory is identified using the representative Trj procedure (Table. 2). This trajectory represents the overall navigational behavior of the cluster.
4. by considering the representative trajectories, re-compute the set of clusters using the re-cluster procedure (Table. 3). Steps 3 and 4 are repeatedly executed until there are no changes in the representative trajectories between two subsequent iterations.
Table 1. Initialization procedure: compute initial clusters
1. Initially all trajectories are labeled as core, border, or noise trajectories
2. based on Eps and MinTrajs, eliminate noise trajectories 3.Take the rst trajectory as rst cluster. Classify all the remaining trajectories into this cluster if they are within the given Eps.
4. Take an unclassied trajectory and consider it as a new cluster.
Take all the other trajectories which are not kept in any clusters and keep in this new cluster if they are with in Eps. 5. Repeat the previous step until no new clusters are generated.
Table 2. RepresentativeTrj procedure: derive the representative trajectory
For each trajectory of a cluster, calculate the cumulative dissimilarity with all other trajectories of the same cluster. Select the trajectory which having the minimum cumulative dissimilarity and take this as the representative trajectory of the cluster.
Table 3. Re-cluster procedure: re-compute clusters
For each trajectory calculate dissimilarity with all the other representative trajectories and assign to the cluster which is having minimum dissimilarity.
3.
USING DENTRAC IN PRACTICE
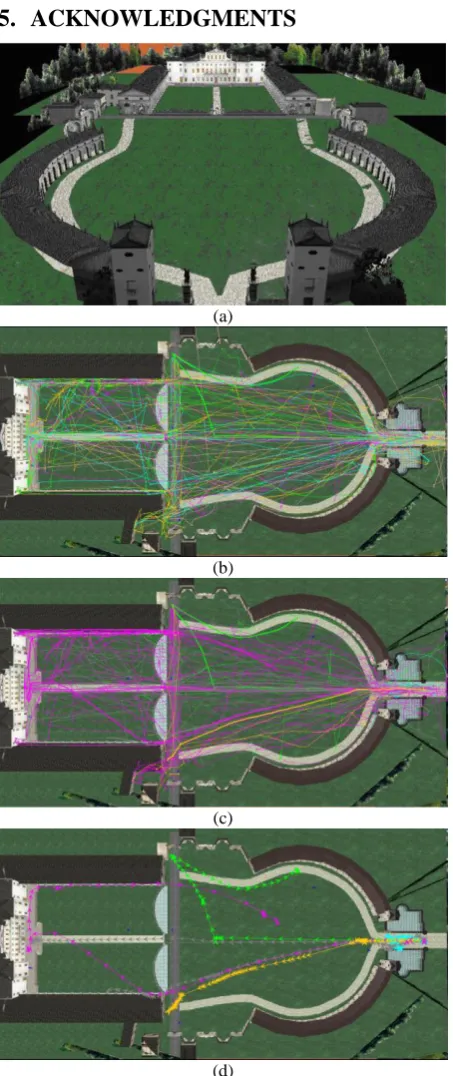
This section presents a detailed case study where DenTrac has been effectively used to analyze navigation logs of VillaManin3D1, an online VE developed in VRML. VillaManin3D allows users to take a virtual walk into the Villa Manin Estate, located in the village of Passariano, Udine (Italy). As shown in Fig. 1(a), the VE is characterized by two main parts separated by a central gate with side parapets of open wells. Users start their visit at the main entrance of the museum (bottom portion of Fig. 1(a)), and then they can freely navigate through the VE. For example, they can start to visit the VE by navigating straightly through the open space towards the central gate of the museum, or moving through left and right corridors. To reach the main hall of the museum (upper portion of Fig. 1(a)), users can navigate through the central gate of the museum as well as the open space and corridors of the rectangular area.
For testing the proposed tool, we remotely collected navigation data of 60 users containing 23293 samples, using a script on the client side sending at constant time intervals to our server information about the current user position and orientation. We started the analysis of collected samples by studying the non-aggregated visualization of raw data (Fig.
1(b)). This visualization allowed us to study in detail the behavior of each individual user. However, the non-aggregated visualization is not very effective if the analysis is targeted at extracting information on the general navigational behavior of users; in this case, it is more appropriate to use the aggregated visualizations based on proposed clustering technique.
Fig. 1(c) shows the obtained non-aggregated visualizations, where the above 60 trajectories are grouped into five clusters, and representative trajectories of the clusters are highlighted by increasing their line thickness. Fig. 1(d) shows the obtained aggregated visualizations with direction of movement of the clusters. From Fig. 1(d), one can observe that, after entering the museum maximum users are navigated through the left side entrance of the museum, moderate users are navigated through middle entrance of the museum, less users are navigated up to central gate of the VE, and very less users are navigated at the entrance of the VE only (i.e. these are not familiarize with the VE, hence they exit from the VE at the initial stage only), moreover, initially users navigated very slowly at the entrance of the museum, after once familiarizing with the controls they navigated freely (this can be observed from the gap between two arrow heads).
4.
CONCLUSION AND FUTURE WORK
In this paper, we have presented a novel density based trajectory clustering technique and ready-to use tool for clustering Spatio-temporal data. To show the effectiveness of the tool, we demonstrated it on a variety of trajectories moving with different directions and accelerations. Based on the experimental results, the tool proved to be effective in supporting the analyst in discovering navigation patterns, identifying critical situations, and prompting usability improvements. For example, this tool can be used by the site designers to evaluate and improve the performance of the site, optimizing the user spaces and subsequently to improve the company return of interest.
Generally complete trajectory cannot be similar with other trajectories but some portion of the trajectory will be similar. By clustering the users very long and complex path we may miss some valuable information, instead, if we segment the trajectories and cluster them we may get some more and important. For this we need to segment the trajectories based on some criteria for example, whenever the users changes his orientation.
5.
ACKNOWLEDGMENTS
One of the authors, Hazarath Munaga is thankful to Prof.Luca Chittaro and Dr. Lucio Ieronutti, University of Udine, Udine, Italy, for their support during his research work.6.
REFERENCES
[1] Ganey, S., Smyth, P.: Trajectory clustering with mixtures of regression models. In: KDD '99: Proceedings of the fifth ACM SIGKDD international conference on Knowledge discovery and data mining, New York, NY, USA, ACM (1999) 63−72.
[2] Phang, T.L., Neville, M.C., Rudolph, M., Hunter, L., Trajectory clustering: A non-parametric method for grouping gene expression time. In: Proceedings of Pacific Symposium on Biocomputing, Courses, With Applications to Mammary Development. (2003) 8−351.
[3] Sas, C., O'Hare, G., Reilly, R.: Virtual environment trajectory analysis: a basis for navigational assistance and scene adaptivity. Future Gener. Comput. Syst. 21(7) (2005) 1157−1166.
[4] Chittaro, L., Ranon, R., Ieronutti, L.: Vu-flow: A visualization tool for analyzing navigation in virtual environments. IEEE Transactions on Visualization and Computer Graphics 12(6) (2006) 1475−1485.
[5] Hazarath, M., Lucio, I., Luca, C.: CAST - A novel trajectory clustering and visualization tool for spatio temporal data. In: IHCI-2009: Proceedings of the First International conference on Intelligent Human Computer Interaction, Springer (2009) 169−175.
[6] Hazarath, M., Murthy, J.V.R., Venkateswarlu, N.B.: A Hybrid Trajectory Clustering for Predicting User Navigation. International Journal on Recent Trends in Engineering 3(1) (2010) 76−80.
[7] Kriegel, H.P., Kunath, P., Pfeifle, M., Renz, M.: Viewnet: Visual exploration of region-wide traffic networks. In: ICDE. (2006) 166.
[8] Tan, P.N., Steinbach, M., Kumar, V.: Introduction to Data Mining. Addison-Wesley (2005).
[9] Hazarath, M., Murthy, J.V.R., Venkateswarlu, N.B.: A Novel Trajectory clustering technique for selecting cluster heads in Wireless sensor networks. International Journal on Recent Trends in Engineering 1(1) (2009) 357−361.
[10] Agrawal, R., Faloutsos, C., Swami, A.N.: Efficient similarity search in sequence databases. In: FODO '93: Proceedings of the 4th International Conference on Foundations of Data Organization and Algorithms, London, UK, Springer-Verlag (1993) 69−84.
[11] Faloutsos, C., Ranganathan, M., Manolopoulos, Y.: Fast subsequence matching in time-series databases. In: SIGMOD '94: Proceedings of the 1994 ACM SIGMOD international conference on Management of data, New York, NY, USA, ACM (1994) 419−429.
[12] Laurinen, P., Siirtola, P., R"oning, J.: Efficient algorithm for calculating similarity between trajectories containing an increasing dimension. In: AIA'06: Proceedings of the 24th IASTED international conference on Artificial intelligence and applications, Anaheim, CA, USA, ACTA Press (2006) 392−399.
[13] Ester, M., Kriegel, H.P., Sander, J., Xu, X.: A density-based algorithm for discovering clusters in large spatial databases with noise. In: KDD. (1996) 226−231.
[14] Hinneburg, A., Hinneburg, E., Keim, D.A.: An efficient approach to clustering in large multimedia databases with noise. In: KDD'98, AAAI Press (1998) 58−65. (a)
(b)
(c)
(d)
[image:4.595.55.282.70.609.2][15] Chiu, T., Fang, D., Chen, J., Wang, Y., Jeris, C.: A robust and scalable clustering algorithm for mixed type attributes in large database environment. In: KDD '01: Proceedings of the 7th ACM SIGKDD international conference on Knowledge discovery and data mining, New York, NY, USA, ACM (2001) 263−268.
[16] Foss, A., Zaïane, O.R.: A parameter less method for efficiently discovering clusters of arbitrary shape in large datasets. In: ICDM '02: Proceedings of the 2002 IEEE International Conference on Data Mining, Washington, DC, USA, IEEE Computer Society (2002) 179.
[17] Harris, R., Hess, D., Venegas, J.: An objective analysis of the pressure-volume curve in the acute respiratory distress syndrome. American Journal of Respiratory and Critical Care Medicine 161(2) (February 2000) 432−439.